- by New Deal democrat
I am departing from my typical recap of new home sales this month, because of the important turn that was revealed in last week’s report on building permits and starts. I usually point out that, while new home sales are the most leading of the housing construction metrics, they are noisy and heavily revised. This is true, and was true this month as well. But there is another aspect of the report that is assuming additional importance - if the outcome of the Fed rate hikes since 2022 turns out to be a recession after all.
Got your attention?


In April sales (blue in the graph below) declined -4.7% m/m to 634,000 annualized, after March was revised downward by -28,000 to 637,000. Again, very noisy, big revision. As the five year graph below shows, beginning in 2023 sales have stabilized in the 650,000 +/-50,000 range. For comparison I also include the much less noisy, but slightly less leading single family housing permits (red), which as anticipated have started to follow sales down from their peak:
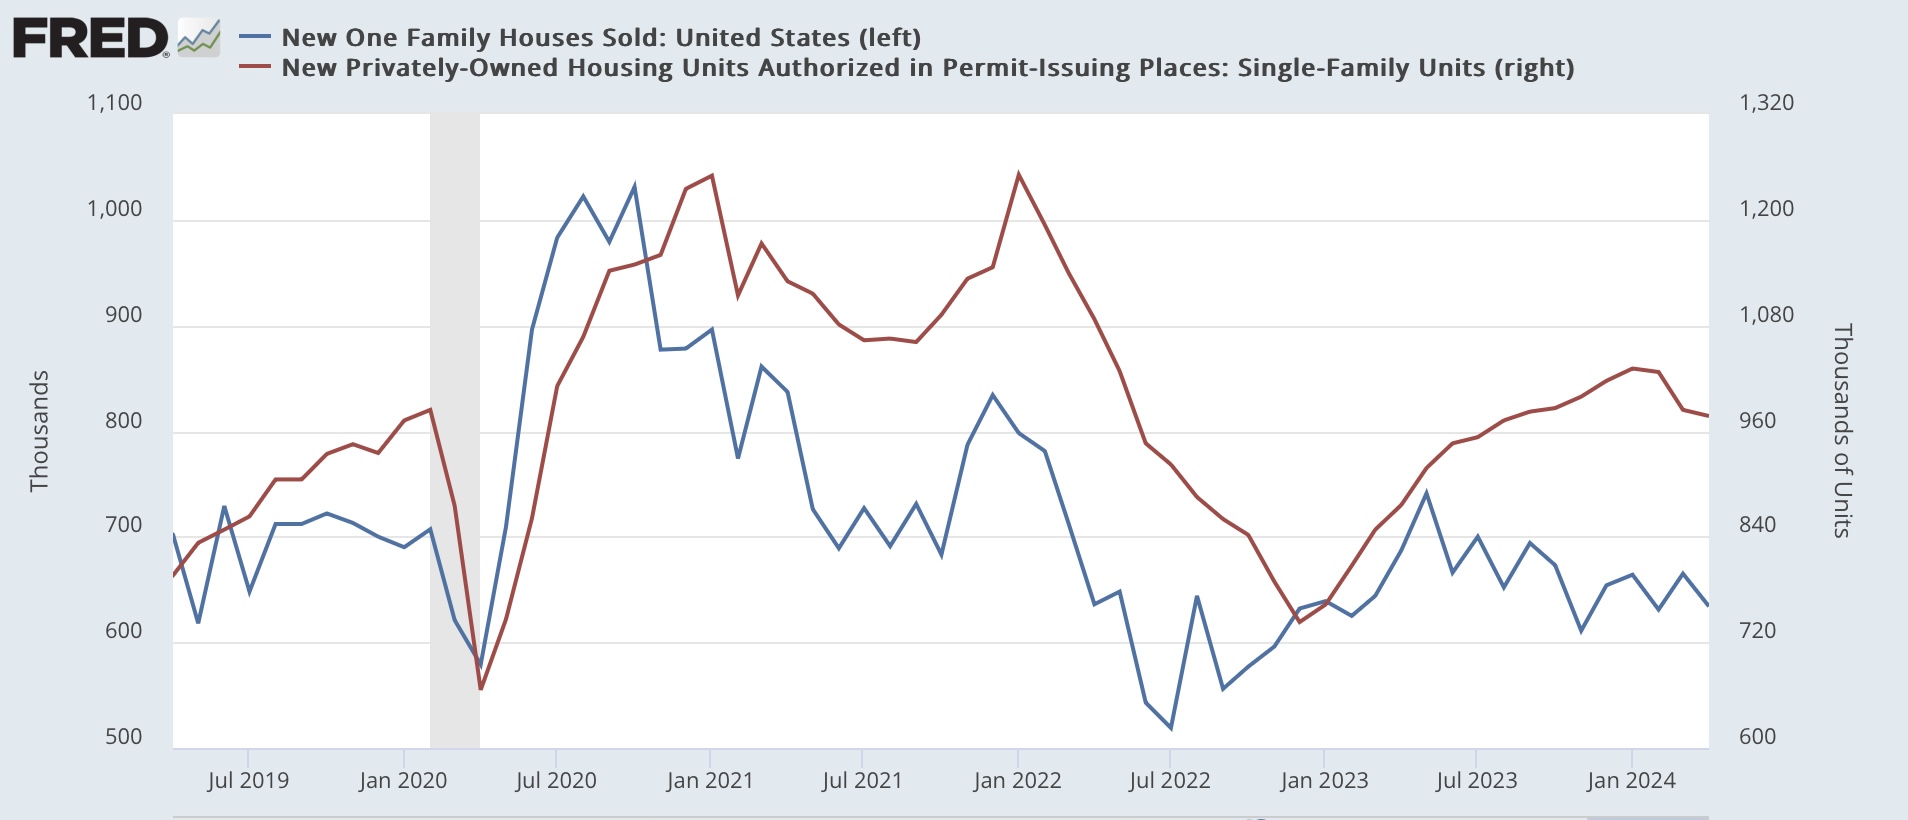
Last month I wrote that “because mortgage rates have risen somewhat in the past few months (from 6.67% to 7.10%, I expect this range in new home sales to continue, with a slight downward bias in the immediate months ahead.” As indicated above, that is what happened in April. Although mortgage rates have pulled back to 7.02% from 7.22% two weeks ago, they remain elevated, so downward pressure will continue to be placed on new home sales and construction.
As I always point out, prices follow sales, and that has continued to be the case as well. The median price of a new home in April was $433,500, continuing in the range it has established since at least February 2023:

But let me also harken back to all of my earlier inflation and housing posts this week, because, just like the Case Shiller repeat sales index (brown in the graph below), the median price of new homes as of April was up 4.7% YoY, continuing its recent higher trend:

Unlike existing home sales, where inventory is being constrained by would-be sellers trapped in 3% mortgages and thus prices remain near all-time highs, the median price of new homes had declined as much as -16% from peak at their lows last year, but now are only down -5.8% (per the graph 2nd above).
Which brings me to the special sauce of this month’s (and perhaps the next number of of months’) report: new homes for sale.
Because in addition to the most leading metric of “new single family houses sold,” the report also includes the metric of “new single family houses for sale” (red in the graph below). As you can easily see, the former has always led the latter, and by a significant margin:

Now, let’s bring back last week’s new residential construction report into the discussion. Because new home sales are the most leading (but noisy) metric, followed by building permits, followed by building starts. Followed by housing units under construction, which have decisively turned down at last in the past two months.
Which led me to ask, what is the relationship between building units under construction, and new single family homes for sale? And that is what is answered by the below graph:

With only one exception (the 1981 “double-dip” recession), housing units under construction have always led new homes for sale, by varying time frames but most usually the peak in the former has led the peak in the latter by about 6 months.
Further, as you can also see from the above - and this is most important - new homes for sale have *always* also turned down before a recession, at least by 3 months (1970 and 1973) but usually by a significantly longer period of time.
In fact, with the exception of the 1970 recession, they have always turned negative YoY shortly before a recession has begun (in 1970 it was one month later):

And as is easily seen by the above graph, at present new homes for sale are not just increasing, but at an increasing rate YoY.
To bring this around to my Big Picture for this year, I am watching the manufacturing and construction sectors especially closely to see if, with the tailwind of supply chain un-kinking gone, the Fed has pulled off a “soft landing,” or whether a recession is going to occur in response to their aggressive rate hikes after all.
When it comes to construction, with the exception that new building units under construction are not down 10%, all of the shoes have dropped but one. And that one shoe remaining is new homes for sale. If that reverses and turns down, it means Trouble.