Saturday, January 27, 2007

The Market's Last Week

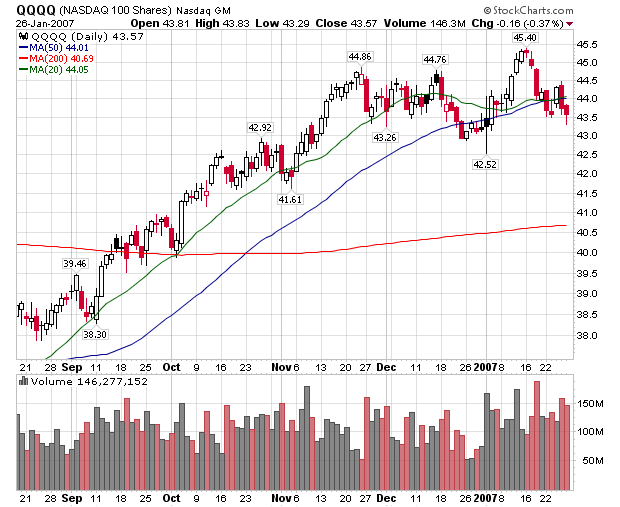
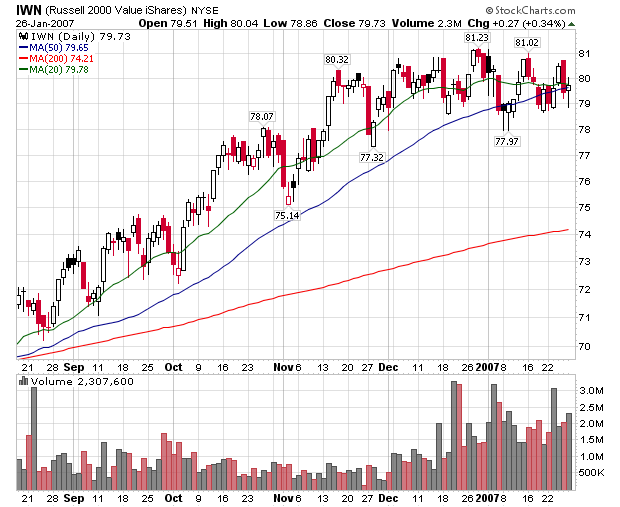
Let's see how the markets acted last week. Just for review, I use the exchange-traded funds for the S&P 500 (SPY), Nasdaq 100 (QQQQ) and the Russell 2000 (IWN). The DJIA is at best antiquated.

Here's a chart for the S&P and QQQQs, which both say the same thing.

Photobucket - Video and Image Hosting

Photobucket - Video and Image Hosting

We had two days of gains followed by two days of selling. However, the selling occurred on noticeably higher volume. In addition, the SPYs hit a higher level on Wednesday, then quickly retreated to lower levels -- again on higher volume. The QQQQ's looked like they were going to start moving up, but sold off the earlier in the week levels -- on higher volume. So -- short version is simple: last week there were more sellers than buyers in the market. In addition, market participants sold into the rallies. This is not a sign of confidence.

The IWNs were a little different.

Photobucket - Video and Image Hosting


This average has been trading in a range since the beginning of December. Last week we say a similar pattern to the SPYs and QQQQs, but the IWNs sold off to about 50% of the Tuesday-Wednesday rally. In addition, it looks like the IWNs may be forming a triangle trading pattern, which usually means consolidation before a move in wither direction.

In summation, traders were concerned about the market last week, with an emphasis on selling rather than buying. Before I speculated that the decreased likelihood of an interest rate cut may be acting as a ceiling on the market. With the numbers from Friday showing strength, that may still be the case.

Friday, January 26, 2007

Weekend Weimar

Photobucket - Video and Image Hosting

New Home Sales Increase 4.8%

From Bloomberg

New home sales in the U.S. rose more than forecast in December, showing the real-estate market is improving following its biggest slump since 1990.

Sales rose 4.8 percent to an annual pace of 1.12 million in December, the most since April, from a 1.069 million rate the prior month, the Commerce Department said today in Washington. For all of last year, sales dropped 17 percent, the biggest decline in 16 years, to 1.061 million from a record 1.283 million in 2005.

Buyers were lured back into the market after builders cut prices and sweetened incentives. Combined with more jobs, rising incomes and still-cheap mortgage rates, the sales increase may give companies such as Lennar Corp. reason to be more optimistic on the outlook for this year


Looking at the numbers from the Census Bureau, there are two large gains in the Midwest and Northeast -- which each increased 27% from November levels. I am guessing that unseasonably weather weather had something to do with these increases. Finally, these numbers to not completely comport with the slew of horrible homebuilder announcements this quarter, a majority of which have been horrible. I speculated that homebuilders may be front-loading bad news into their reports -- that is, adding a ton of bad news to an already bad quarter simply to get it over with. We'll have to wait and see if this is the case.

(From Bloomberg) The median price of a new home fell 1.5 percent in December, to $235,000 from $238,600 a year earlier. The median price of $245,300 for all of 2006 was 1.8 percent higher than the previous year.

The number of homes for sale at the end of the month fell to 537,000, the fewest since January, from 542,000 in November. That left the supply of homes at the current sales rate at 5.9 months' worth, compared with 6.1 months in November.


The drop in median prices indicates that sellers concessions are starting to pay-off in terms of higher sales. However, I would caution that lower prices do not include the increased use of incentives in sales. I would also caution that new home sales do not account for cancellations. Home builders have reported a much larger cancellation rate over the last few months.

Home builders have piled on incentives, including offering free vacations and new cars, to sell homes and reduce inventories.

Such incentives are not subtracted from the sales price reported to the government. Sales are reported when a contract is signed, not at the closing of the sale.

What's more, many of the nation's home builders have reported a large increase in cancellations in recent months. Cancellations are not reflected in the government data, so the reported sales are likely overstated.


The drop in inventory is a welcome development. The huge inventory overhang over the last year has been very concerning. However

However, the inventory of completed-but-unsold homes rose to a record 172,000, up about 50% in the past year. With builders having to carry the costs of those vacant houses, housing starts should weaken further this year until the inventory is worked off, Moody said.

Durable Goods Orders Increase 3.1%

From the Census Bureau:

New orders for manufactured durable goods in December increased $6.7 billion or 3.1 percent to $221.9 billion, the U.S. Census Bureau announced today. This was the fourth increase in the last five months and followed a 2.2 percent November increase. Excluding transportation, new orders increased 2.3 percent. Excluding defense, new orders increased 3.9 percent.


These numbers jib with the Fed's industrial production figures for December.

Excluding transportation, the overall number has decreased each month for the last three months. This indicates how important Boeing is to the US economy.

There was a big drop in semi-conductors (down 22%), but semis increase big two months ago (up 29.2%). My guess is producers are still working off that inventory.

There was also a big drop in computers and related equipment (down 5.7%). Communication equipment dropped 10.7%,Considering how important technology is to the latest stock market rally, this does not bode well for the coming trading week.

We saw a good increase in auto production (up 5.8%). This is probably a production increase in anticipation of new models.

Thank-God foreign airlines are buying planes.

Construction Layoffs In Last Unemployment report

For the last few months, I've been looking at the weekly unemployment reports to see how the housing slowdown is impacting construction employment. There have been some pretty sizable layoffs, and last week was no exception.

California had 10,000+ layoffs in "construction and service" employment.

Minnesota had Pennsylvania had 4000+ layoffs in construction or "construction, trade and service."

Florida had 3400 layoffs in "construction, trade, service, and manufacturing industries."

I am expecting this slow bleed to continued for some time. We've had a rash of homebuilding companies report very negative numbers for the 4th quarter. While housing inventory decreased in the latest existing homes survey, it's still had very high levels. Sales in 2006 dropped the most in over a decade. In other words, the soft landing for housing is still suspect.

Thursday, January 25, 2007

Richmond Fed -- Another Bad Month

The Richmond Fed issued this report on January 23. Because I was traveling I missed it and am now playing catch-up/.

From the Richmond Fed

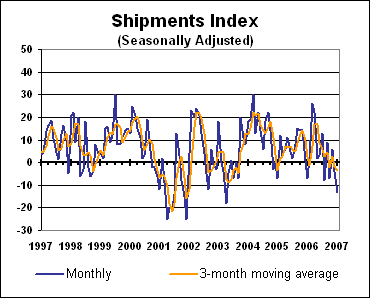
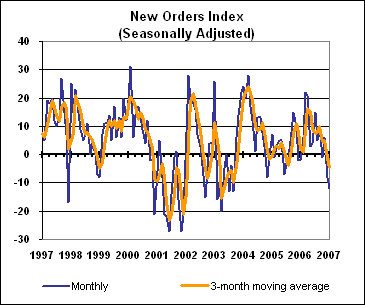
Manufacturing activity in the central Atlantic region contracted again in January, according to the Richmond Fed’s latest survey. Respondents reported further declines in factory shipments and new orders, although employment and order backlogs declined on pace with December. Capacity utilization moved slightly lower, while delivery times edged higher. In addition, manufacturers reported somewhat quicker growth in finished goods inventories.


Photobucket - Video and Image Hosting

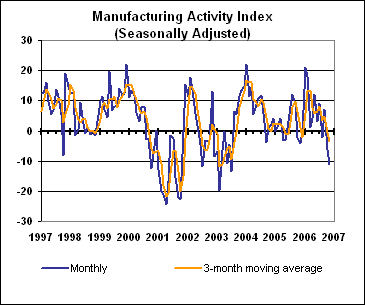
This chart is not good -- it shows the Richmond Federal Reserve District had another bad month and has been contracting for the better part of 2006. On the good side, the overall index had similar performance between 2004 - 2005 without a major problem. However, seeing any index drop like this does not raise confidence.

Here are the shipments and new orders indexes. They both show a similar pattern.

Photobucket - Video and Image Hosting

Photobucket - Video and Image Hosting

We've seen mixed manufacturing news over the past month. While overall industrial production for December increased .4%, the 4th quarter showed an overall decline. The Phily Fed was up moderately, but was nothing to write home about. The Empire State Survey softened a bit. The Kansas Fed index eased as well.

All of these regional reports are pointing to a slowing of overall production in February.

The Long View: Where Is the Trade Deficit?

BruceMcF

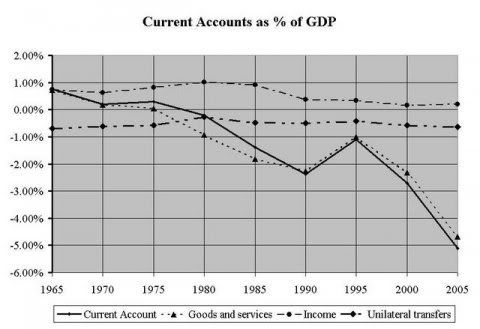
A long time ago, I looked at the current account blowout in The Long View: Current Account, which ended with a promise to have a look at the make-up of the blow out in terms of both geography and industry.
What I am looking at now is the broad outline of the geographic break down.

How broad? I am breaking the whole world down into The Americas, Europe, Asia & Oceania, and Africa. So the answer is, just about as broad as possible.

The Story So Far

Where I left off, before the long haitus, was the stark reality of the current account blowout:
  • It is massively bigger than anything we have experience in living memory

  • The problem is not income or unrequited transfers: it is trade

The trade account is made up trade in goods and trade in services. What I am going to be looking at today is trade in goods.

And before I put this information up, I will add a note that you should not shoot the messenger. After careful contemplation, I have come to the firm conclusion that messenger-shooting is counter-productive.

The source of this information is the same BEA site that provided the info for the first in this series. The only difference is that instead of working with table 1, I am working with Table 2b: Trade in Goods, Additional Historical Historical Data.

Where In The World Is the Trade Taking Place?

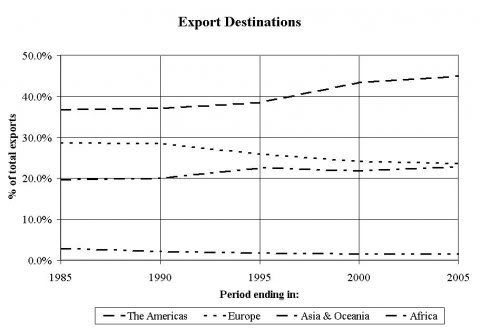
First, lets look at Exports to these four regions as a share of total exports. In all three of these graphs:
  • the Americas are the "dash" line,
  • Europe is the "dot" line,
  • Asia and Oceania is the "dash dot" line, and
  • Africa is the "dash dot dot" line.


The trends here are simple. Europe is losing ground as an export market, with most of that share being taken up by the Americas, and some being taken up by Asia and Oceania. Africa is a very small market, both because of the small size of so many African economies as export markets, and because of the dominance of European firms in those markets.

Now, lets look at Imports from these four regions, as a share of total imports.
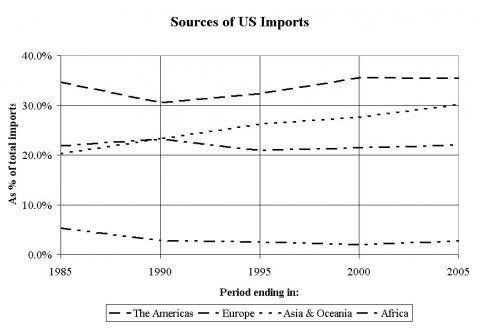
Here we have the Americas as the dominant source of imports, with a loss in market share in the 80-85 period that is regained with something to spare. The second spot, however, trades place, Europe holding a slight lead over Asia in 80-85, while by 01-05, Asia and Oceania is on a path toward taking over as the primary source of imports.

Don't Forget the Blowout

A word of caution is in order here. It is important to bear in mind that the two diagrams are showing shares of totals that are sliding rapidly apart. That is, 45% (about) of our goods exports go to the Americas, and 35% of our goods imports. But that is 45% of a smaller number, and 35% of a bigger number.

The way I have set this up is to take the average of imports and exports as "average trade", and look at the Balance of Payments with each global region as a percentage of "average trade". And here ... as in the earlier diary that focused on the current account overall ... things are moving "south" at a very rapid pace.
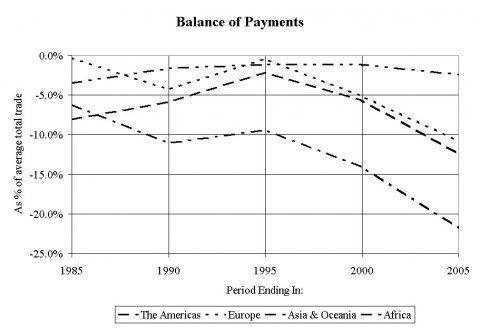

Bear in mind here that what you are looking at is trade in goods, not goods and services overall. The US tends to have a stronger position in services than in goods. As you will see when I look at trade in services, a "small" negative balance in goods trade is good news for the overall trade account.

And for the global regions, the balance of trade compared to average trade breaks down into two stories. For the Americas, Europe, and Africa, the story by and large is improvements up through to 90-95, and then a rising deficit through to 00-05 (and, if we sneaked at table 2a, on to the present).

For Asia and Oceania, the "improvement" in the trade deficit is there, but it is very small ... from about -11% to about -9% ... and the slide since then is the single largest source of the trade deficit.

And remember: this last figure is compared to the average amount of all trade in goods. The deficit in goods trade with Asia and Oceania is more than 20% of the average trade in all goods.

The Path Ahead

Of course, whenever you find Economic bad news, you can find a pollyana that will explain that its just the market in operation, and in the end its all for the best. The main hope for the pollyanas are that "in the long run", the deficits in the goods trade will be balanced by surpluses in services trade.

And so, in the third installment in this series, I will see what the long term view of the balance of trade in services has to tell us. ... to be continued ...

Existing Homes Sales Decrease .8%

From Bloomberg

Sales of previously owned homes in the U.S. declined in December for the first time in three months, capping the biggest annual drop since 1989, a slide that's shown signs of bottoming.

Purchases dropped 0.8 percent to an annual rate of 6.22 million, the National Association of Realtors said today in Washington. For the entire year, sales fell 8.4 percent from 2005's record. In a sign the slide may be nearing an end, the number of homes on the market decreased for a second month.

``This grinding sort of correction will continue for much of this year,'' said Joshua Shapiro, chief U.S. economist at Maria Fiorini Ramirez Inc. in New York. ``Housing will make a negative contribution to the economy this year, but the declines won't be as big as those we have seen in the most recent past.''


The best news in this report is the drop in inventory, which decreased from a 7.3 month supply to a 6.8 month supply. While that figure is still high, it is lower than recent inventory readings.

It's important to remember that interest rates have increased to around 4.85%. This does not bode well for continued strength in the housing market. When interest rates dropped from this level in mid-October we saw an increase in housing sales. Now that rates have returned to this level, I would expect sales to decrease.

While sales appear to have stabilized over the last four months, the high level of consumer debt indicates we are not out of the woods yet in housing.

Tuesday, January 23, 2007

State of the Union: A Nation Off Track

So, we’re all eagerly awaiting President Bush’s State of the Union address to hear the honest facts about the nation’s economy, among other key issues.

OK, not.

Looks like we’ll have to dig up the real deal on our own by taking a gander at some of the recent data and what they portend for us working types.

Tonight, Bush likely will talk about the great economic recovery we’ve seen in the past couple of years. But newly released data from two separate sources reveal just how skewed the distribution of economic growth has been in the current recovery, according to the Economic Policy Institute.
Data from the Bureau of Economic Analysis through the third quarter of 2006 show that a historically high share of corporate income is going into profits and interest (i.e., capital income) rather than employee compensation. And a newly released Congressional Budget Office (CBO) analysis of household incomes shows that a greater share of this capital income goes to the richest households than at any time since the CBO began tracking such trends. In other words, our economy is producing more capital income and that type of income is more likely to go to those at the very top of the income scale. Together, these dynamics are contributing to a uniquely skewed recovery.
That means those in the top 1 percent of the income scale received 59.4 percent of all the capital income in 2004 (CBO's latest data), up from 49.1 percent in 2000 and just 37.8 percent in 1979. The increase in the concentration of capital income to the upper 1 percent grew as quickly over the four-year period from 2000 to 2004 as over the preceding 11 years (1989–2000).

So, the economic recovery Bush will tout is mostly about the rich getting richer. And those tax cuts that Bush will call the shining star of his economic acumen? Guess what. They’re helping the rich more than the economy. As Citizens for Tax Justice puts it:
First, the tax breaks enacted since 2001 are heavily skewed toward the very wealthiest few. Second, because the tax cuts are being paid for with borrowed money, the cost of paying the added national debt more than wipes out any benefits from the tax cuts for 99 percent of residents in each state. Only the best-off one percent are net winners from the president’s fiscal policies.
But those tax cuts for the wealthy must do something for the overall economy, right? Indeed. According to the Center on Budget and Policy Priorities:
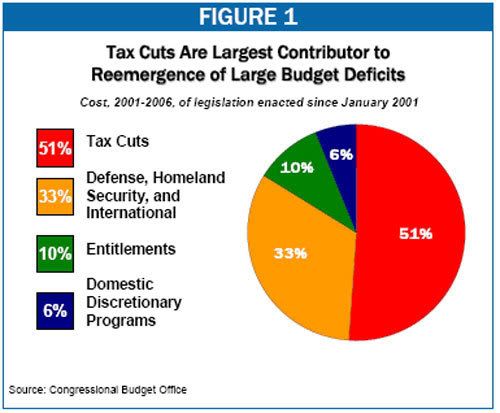
Congressional Budget Office data show that the tax cuts have been the single largest contributor to the reemergence of substantial budget deficits in recent years. Legislation enacted since 2001 has added about $2.3 trillion to deficits between 2001 and 2006, with half of this deterioration in the budget due to the tax cuts (about a third was due to increases in security spending, and about a sixth to increases in domestic spending). Yet the president and some Congressional leaders decline to acknowledge the tax cuts’ role in the nation’s budget problems, falling back instead on the discredited nostrum that tax cuts “pay for themselves.”
As the Center on Budget and Policy Priorities sums up:
A study by the president’s own Treasury Department recently confirmed the common-sense view shared by economists across the political spectrum: Cutting taxes decreases revenues.
The Bush administration ran the Clinton budget surplus into the ground after less than a year in office—and has kept adding to the national tab so that the United States is now more than $8 trillion in debt (that’s nearly $29,000 for every man, woman and child in the nation). Yet after all these years of draining the federal budget into oblivion, administration cronies now suddenly are sounding the alarm.


And they’re offering solutions. But they’re not suggesting the nation cut back on the $255 million a day Bush is spending on the Iraq war or back off those tax cut payoffs to wealthy donors. Instead, in a recent speech, Ben Bernanke, Federal Reserve chairman, used a warning about the growing deficit as the opening salvo to attack on what’s left of our country’s successful heath and retirement programs.
Warning against complacency over the federal deficit, Ben S. Bernanke, the Federal Reserve chairman, said Thursday that recent positive trends on the budget were a “calm before the storm” masking a long-term danger posed by looming deficits in Social Security and Medicare.

snip

Bernanke’s comments were consistent with his past warnings, and those of his predecessor, Alan Greenspan, about the unfunded cost of the postwar generation’s retirement. But his tone was more urgent, and it seemed aimed at the arrival of a new Democratic-led Congress that is just now setting its priorities.
Let’s see. The budget deficit is in the dumpster and the Bush administration wants to salvage it by cutting back on retirement and health care. Let’s look at retirement. Without Social Security, millions of retired Americans would struggle in poverty. Between 1960 and 2004, Social Security helped cut the poverty rate among seniors by more than two-thirds, from 35 percent to 10 percent. Social Security takes on more, not less, importance as we go forward, with fewer and fewer workers getting retirement benefits on the job. As AFL-CIO Secretary-Treasurer Richard Trumka said in testimony today before the House Ways and Means Committee:
Only half of American families have an employer-provided retirement plan of any sort, a proportion largely unchanged for decades. However, whereas 40 percent of workers participated in employer guaranteed “defined-benefit” pension plans in 1980, today only 20 percent have such plans. In substituting “defined-contribution” for defined benefit plans, employers are shifting the risk of retirement onto workers. And American workers are ill prepared to carry this risk.
There are a lot of reasons why Bush’s approval rating has tanked, according to recent polls. And it’s pretty clear that Iraq isn’t the only reason 71 percent are saying the country is seriously off track.

Traveling

I am traveling today and tomorrow. Posting will resume on Thursday afternoon.

BS

Sunday, January 21, 2007

10-Year Treasury and Housing

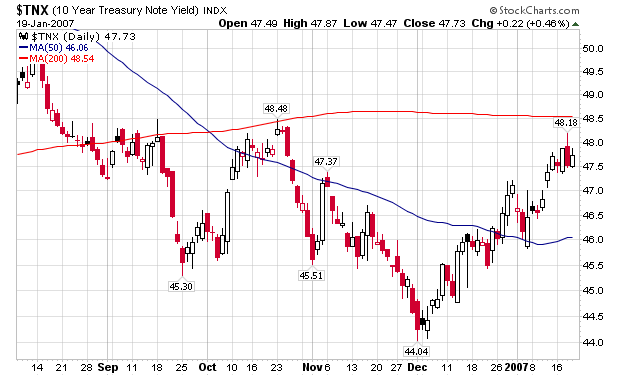
Talk of a housing bottom started sometime in October. Since then we've gotten more news on new and existing home sales to stoke talk of a housing bottom (We've also had home builders report some really lousy earnings reports). In addition, interest rates started to drop about that same time. Here's a chart of the 10-year Treasury from stockcharts.com

Photobucket - Video and Image Hosting

Rates have risen steadily since early December, largely because good economic news and public statements from various Fed governors dampened speculation of a rate cut in early 2007. As a result, the 10-year Treasury's interest rate is back near 4.84%. This was at least a non-restrictive interest level in October. We'll have to see if that still holds going forward.

Saturday, January 20, 2007

Cleveland Median CPI +.3%

From the Cleveland Federal Reserve:

According to the Federal Reserve Bank of Cleveland, the median Consumer Price Index rose 0.3% (3.5% annualized rate) in December. The median CPI is a measure of core inflation calculated by the Federal Reserve Bank of Cleveland based on data released in the Bureau of Labor Statistics’ (BLS) monthly CPI report.

Earlier today, the BLS reported that the seasonally adjusted CPI for all urban consumers rose 0.5% (6.7% annualized rate) in December. The CPI less food and energy rose 0.2% (2.3% annualized rate) on a seasonally adjusted basis.

Over the last 12 months, the median CPI rose 3.7%, the CPI 2.5%, and the CPI less food and energy 2.6%.


Over the past few months, several Fed officials have commented they think inflation was too high. While no one has mentioned the Cleveland median CPI as the source of their information, I am beginning to think it carries more weight than the Fed is letting on. I can't prove that -- it's just a hunch.

The Markets Last Week

Let's take a look at how the markets performed last week. All charts below are from stockcharts.com

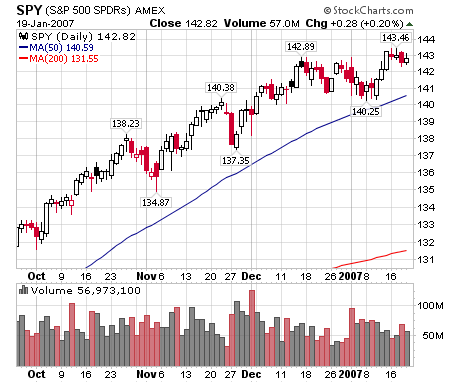
Here's the chart for the SPY (S&P 500).

Photobucket - Video and Image Hosting

Remember the market's were closed on Monday.

Four days with a slight downward bias that followed three strong upward bars. That indicates several points. First, there was no news strong enough to send the market in either direction. In other words, the good news canceled out the bad news. We had some good earnings news this week (broker dealers), but we also had some bad news (Motorola, IBM, Intel) combined with CPI and PPI implying the Fed won't be lowering rates anytime soon. One analysis described the market thusly:

"I think we're at an extremely pivotal psychological level," said T.J. Marta, economic strategist at RBC Capital Markets. He said earnings and economic data support the Federal Reserve's notion that the economy can pull off a soft landing. Marta contends Wall Street is now mulling whether the economy will do a "fly-by" and skip a soft landing entirely with growth continuing apace.


This analyst didn't mention the implied ceiling caused by the Fed's not acting on interest rates. I think that is a big ceiling on the market right now.

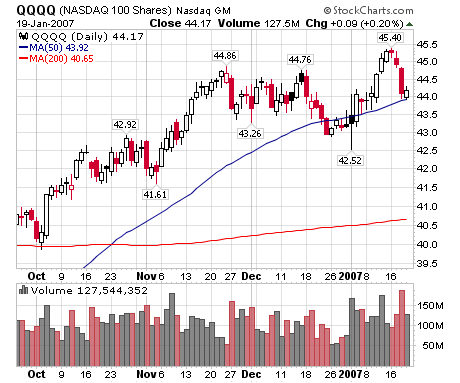
Here's a chart of the QQQQs

Photobucket - Video and Image Hosting

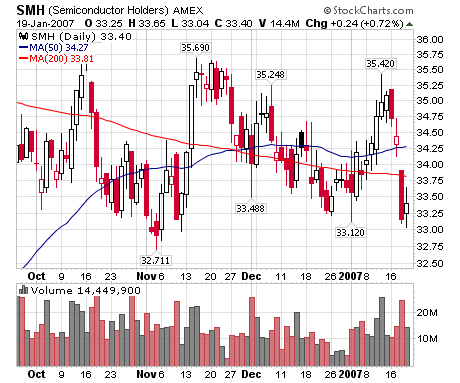
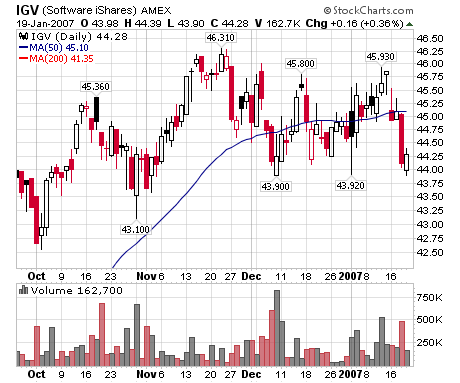
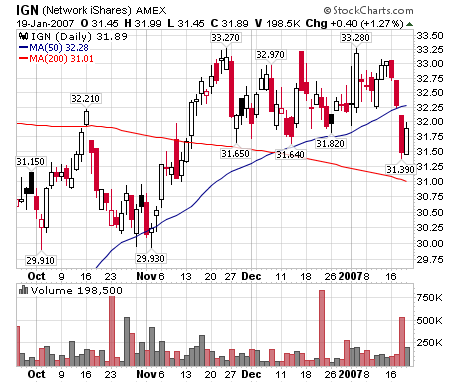
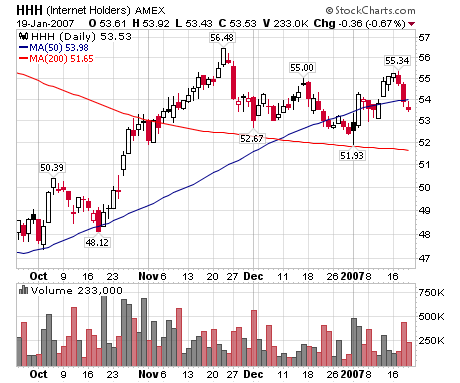
This is where the bad tech news really hit hardest. Technology has reemerged as a market sector over the last 6 months, and the news from Intel, IBM and Apple hit this market hardest. Take a look at various technology related ETFs for the week:

Semiconductors

Photobucket - Video and Image Hosting

Software

Photobucket - Video and Image Hosting

Networking

Photobucket - Video and Image Hosting

Internet

Photobucket - Video and Image Hosting

This charts should cause concern among those in the bullish market camp. Technology has been the driver of the latest rally that started in late July/early August of last year. Now that sector is somewhat suspect going forward.

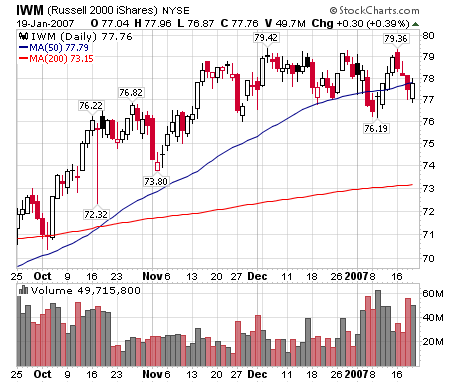
Here's a chart for the Russell 2000

Photobucket - Video and Image Hosting

We're back to a trading range for this index, between roughly 76 and 79.50. Trading ranges mean supply and demand are about equal. Traders aren't bullish enough to bid the index higher or bearish enough to sell it lower. We're waiting for some catalyst to make the market decide on one direction.

Friday, January 19, 2007

Phily Fed Up Moderately

From the Phily Fed:

The survey’s broadest measure of manufacturing conditions, the diffusion index of current activity, increased from a revised reading of -2.3 in December to 8.3 (see Chart).* This month, 25 percent of the firms reported increased activity; 17 percent reported decreased activity. The new orders and shipments indexes offer mixed signals about the strength of this month’s overall improvement. Demand for manufactured goods has not yet recovered much: The new orders index rose two points, from -0.9 to 1.3, after negative readings for two consecutive months. The shipments index increased 10 points from December; 37 percent of the firms reported an increase in shipments; 13 percent reported a decrease. Indexes for delivery times and unfilled orders remained negative, indicating shorter delivery times and a decline in unfilled orders.

Evidence of modest growth in manufacturing is suggested by replies concerning employment and hours worked. The percentage of firms reporting an increase in employment (21 percent) was somewhat higher than the percentage reporting decreases (13 percent). The current employment index was virtually unchanged from its revised December reading. The average workweek index edged four points higher, but the percentage of firms reporting longer hours (16 percent) was nearly the same as the percentage reporting shorter hours (15 percent).


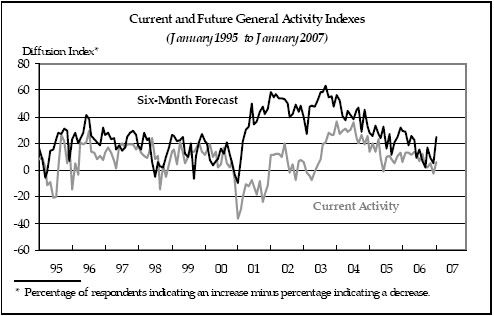
Let's take a look at the general diffusion chart:

Photobucket - Video and Image Hosting

The gray line (current conditions) has trended down for the last 6 months or so. We saw a longer downtrend from mid-'04 to mid-'05 without a serious problem. That means the most recent decrease could be nothing more than a natural slowdown from peak activity. In addition, we have seen modest increases over the last year, so the recent increase into positive territory could be the beginning of a return to slower but positive production levels. However, we are near the 0 line, so this trend bears watching.

The new orders index rose two points, from -0.9 to 1.3, after negative readings for two consecutive months.


The new orders index isn't offering us much hope right now.

Here's some good news in the report:

Photobucket - Video and Image Hosting

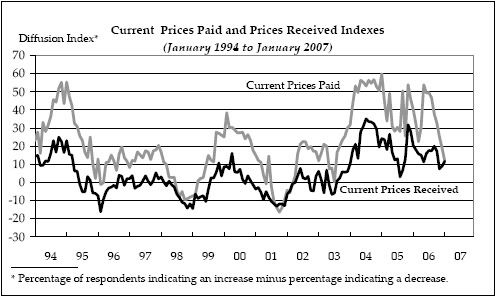
The prices paid component has dropped for the last 6 months. This is good news on the inflation front.

The current employment index was virtually unchanged from its revised December reading.


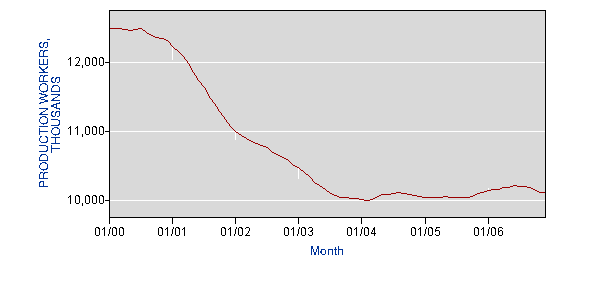
We've seen manufacturing employment take a big hit during this expansion. Here's a chart of national manufacturing since 2000.

Photobucket - Video and Image Hosting

The large productivity gains have translated into fewer manufacturing employees. There is no reason to think this trend won't continue.

The short version is all the recent manufacturing numbers have showed a slightly positive reading not strong enough to warrant extreme optimism, but enough to warrant a soft-landing.

Explain This To Me

From Bloomberg:

``Central banks will get naughtier,'' said Jan Loeys, global head of market strategy at JPMorgan Chase & Co. ``They will see inflation and they will have to raise rates.''


OK -- I've been reading financial press for about 20 years. I have never see a central bank described as naughty. Maybe it's an English thing.....

Thursday, January 18, 2007

New Nome Construction Increases 4.5%

From CBSMarketwatch

New construction on homes in the United States rose for the second straight month in December, reflecting year-end strength in apartment construction, the Commerce Department estimated Thursday.

Meanwhile, the number of new building permits issued rose for the first time in 11 months.

Economists said weather played a major role in the increased building activity.

The increase in housing starts was likely due to "a few large multifamily projects that were able to get started due to record warm weather," wrote Joshua Shapiro, chief economist for MFR, in an e-mail to clients.

"We do not take the data as a sign that the housing market is stabilizing, nor do we believe the worst of the housing correction is behind us," wrote Richard Moody, chief economist for Mission Residential, in an e-mail.

...

Starts of multifamily housing jumped 42.1% in December, reaching 412,000. This marked the biggest gain since April 2005.

On the other hand, starts of single-family homes fell 4.1%, trending to a seasonally adjusted annual rate of 1.23 million from 1.28 million in November.


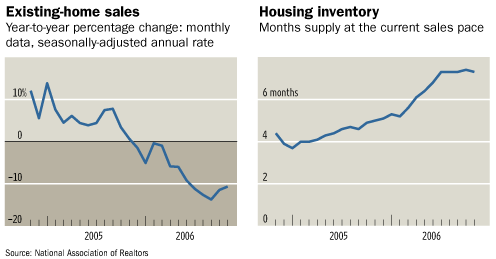
The starts in multi-family projects appear to be the reason for the jump. That makes sense. Considering the following charts from the WSJ:

Photobucket - Video and Image Hosting

Sales are trending down and inventory is up. This is not the time to be adding to inventory.

CPI Up .5%; Core Up .2%

From the Bureau of Labor Statistics:

On a seasonally adjusted basis, the CPI-U increased 0.5 percent in December, the first advance since August. Energy prices, which had declined in each of the preceding three months, rose 4.6 percent in December. Within energy, the index for petroleum-based energy increased 7.7 percent and the index for energy services increased 1.2 percent. The food index was unchanged in December. The index for all items less food and energy, which was virtually unchanged in November, increased 0.2 percent in December. Upturns in the indexes for apparel and for tobacco and smoking products werelargely responsible for the acceleration. Shelter costs rose less than in November, but still accounted for about 80 percent of the December advance in the index for all items less food and energy.


From Bloomberg:

U.S. consumer prices accelerated in December for the first time in four months, suggesting the easing of inflationary pressures that the Federal Reserve is counting on will be slow.

The consumer price index increased 0.5 percent last month, the most since April and reflecting higher costs for gasoline and natural gas, after no change in November, the Labor Department said today in Washington. Excluding food and energy, so-called core consumer inflation rose 0.2 percent, following no change a month earlier.


Let's break these numbers down a bit.

1.) The core and total numbers same in at or slightly above expectations -- depending on whether you read Bloomberg or CBS.Marketwatch for your forecasts. So the number won't be unexpected.

2.) Transportation and energy costs were a big reason for the increase. Transportation increased 1.8% after three months of declines and overall energy prices increased 4.6% after three months of decreases. Oil has dropped in a big way since late December, meaning January's number may be much lower than December.

3.) The 12-month December to December change is 2.5%. This is still high for the Fed.

4.) Bloomberg notes this is the biggest increase since April. That's not a good development.

Beige Book's Inflation News is Fair

From the Beige Book:

Overall prices increased moderately. Prices for energy and a number of materials have eased, and competition has kept prices for final goods in check. Atlanta, Chicago, Minneapolis and Kansas City described price pressures as easing or moderating. Manufacturers in the Boston and Cleveland Districts reported that input prices were stable, although contacts noted some increases in metal prices. Meanwhile, manufacturers in the New York District indicated some increases in input price pressures. Retail prices were steady in the New York, Atlanta and Dallas Districts, but were edging up slightly in the Richmond District. Philadelphia noted that reports of price increases at business firms were not as widespread as they were earlier in the fall. Dallas described price pressures as mixed, while San Francisco said final prices rose at a modest pace.


First -- copper prices have dropped since this report was written. That means the "some contacts indicated metal prices were increasing" has either already gone away or is in the process of ameliorating.

This report uses the word "moderating" and "eased" a lot. That plays into the Fed's general story right now, which is as the economy slows price pressures will weaken. This has been the Fed's contention for the last 6 months. When Bernanke first started using this language I was skeptical. However, the economy is making Ben look good right now.

The areas of inflation increases look more like inflation "hot pockets" -- areas of limited scope and influence rather than a system wide problem.

Ben speaks to the Senate today.

Wednesday, January 17, 2007

Industrial Production Increases .4%

From CBSMarketwatch.com

U.S. industrial production rose by an overall 0.4% in December, as the high-technology and motor-vehicle industries posted strong output for the month, the Federal Reserve said Wednesday.

....

Bear Stearns economists said that, coupled with other recent data, the industrial output figure showed the economy improved at the end of the year.

"Data on employment, retail sales, and production suggest that the economy's momentum was picking up at the end of 2006," the economists wrote in a research note.


Let's look inside the report, because there are two sides to analyze.

Overall industrial production decreased -.3%, -.1% and -.1% in September through November, respectively. That means the overall .4% look like a rebound.

On a monthly basis there are lots of increases -- consumer durables and non-durables, business equipment (which saw a big bump), durable and nondurable manufacturing and mining all saw increases. These increases should give the market some confidence going forward because they occurred across a wide spectrum of industrial areas.

I should note that last months manufacturing ISM saw increases as well, although the index was hovering around 50 which is the line between expansion and contraction.

However, overall industrial production fell at a -.5% rate in the fourth quarter. The second lowest annual growth rate occurred in the third quarter at 4%. In other words, the fourth quarter saw an overall downturn. All industrial areas - manufacturing, consumer goods, energy, business goods -- saw low numbers on a quarterly basis. Manufacturing contracted -1.4% on an annual basis in the 4th quarter.

The breadth of this month's increases is a good sign. However, another month of increases is required before we pop the champaign corks.

Homebuilder Lennar Swings to Loss

From the Street.com

The Miami-based homebuilder lost $196 million, or $1.24 a share, for the quarter ended Dec. 31, reversing the year-ago profit of $581 million, or $3.54 a share. Revenue slipped 15% from a year ago to $4.27 billion.

Analysts surveyed by Thomson Financial were looking for an loss of 81 cents a share on sales of $4.15 billion.

The latest quarter includes write-offs of option deposits and pre-acquisition costs of $111.1 million and valuation adjustments of $382.8 million. Lennar said it posted a latest-quarter homebuilding operating loss of $319.4 million, as new orders dropped 6% from a year ago.

"Uncertain market conditions make it difficult to provide a 2007 earnings goal," CEO Stuart Miller said. "While we know that the margin in our backlog will result in lower profitability in the first half of 2007, we believe that if the current environment of strong employment, low interest rates and a healthy economy continues, and the market for new homes demonstrates traditional, seasonal improvement, we will meet or exceed our 2006 earnings of $3.69 per share."


Some of these losses could be the company loading a ton of bad news into an already bad quarter, essentially taking care of all the bad news at once. We have seen a large number housing companies report terrible fourth quarters that include a ton of bad news.

However, I wouldn't be surprised if we saw a continuation of this trend going forward for at least another quarter. Cancellations are high and the US consumer is heavily indebted with mortgage debt already. In addition, with the declining sales rate and increasing inventory, the market is shifting to a buyers market, which is going to put more downward pressure on prices.