Friday, December 12, 2008
Weekend Weimer and Beagle
Hey folks -- sorry about the lack of posting today. It has really been, well, crazy -- but is a really good way. I'll be back on Monday.
You'd Think I Would Have Posted This Sooner
Below is a video of a panel I participated in last summer. At the time I participated I realized that it was being taped. It just slipped my mind after the panel was over and I forgot about it until I found the recording yesterday. Go figure
Forex Friday's

Click for a larger image
Notice the following on the weekly chart
-- Prices rose 23% over the last 5 months
-- All the SMAs are still moving higher
-- The shorter SMAs are above the longer SMAs
-- Prices have now moved through the 10 week SMA
-- The MACD is overbought
-- The RSI is overbought and declining

Click for a larger image
Notice the following on the dollar's daily chart:
-- Prices are still in an uptrend,
BUT:
-- During the consolidation the RSI and MACD decreased
-- Prices are now below the 10, 20 and 50 day SMA
Bottom line: technically, this chart wants to go lower. Fundamentally the failure of the Detroit bail-out will help to add downward momentum.
Thursday, December 11, 2008
Today's Markets
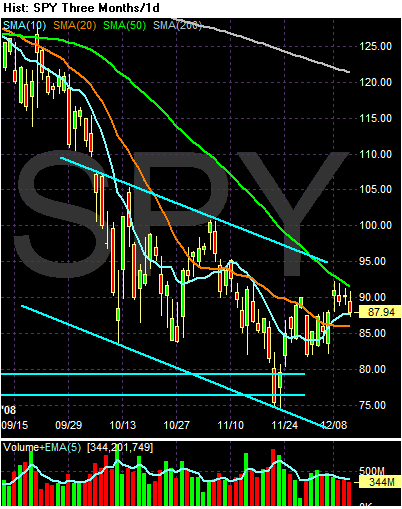
The overall tone of the market remains negative. The general SMA situation is negative. The 200 and 50 day SMA are moving lower. The 20 is moving sideways. The 10 day SMA is rising, but prices retreated from the 50 day SMA. Should prices move below the 10 day SMA they will bring the 10 day SMA lower.
Although prices were fluctuating just below the 50 day SMA, they did so on decreasing volume indicating decreasing buying interest.
We're Nowhere Near a Bottom in Housing
From Bloomberg:
This is what started the whole thing rolling. And it won't end until housing stabilizes. The central problem right now is inventory which is still at high levels in both an absolute and months of inventory on the market sense. Foreclosures are continually adding to that total, which in turn is bringing home prices down. And they won't stop falling until the amount of inventory drops -- which won't happen until foreclosures start to drop.
U.S. foreclosure filings climbed 28 percent in November from a year earlier and a brewing “storm” of new defaults and job losses may force 1 million homeowners from their properties next year, RealtyTrac Inc. said.
A total of 259,085 properties got a default notice, were warned of a pending auction or were foreclosed on last month, the seller of default data said in a report today. That’s the fewest since June. Filings fell 7 percent from October as state laws and lender programs designed to delay the foreclosure process allowed delinquent borrowers to stay in their homes.
“We’re going to see a pretty significant storm next year,” Rick Sharga, executive vice president of marketing for Irvine, California-based RealtyTrac, said in an interview. “There are two or three clouds that suggest a pretty heavy downpour.”
Rising unemployment, expiring foreclosure moratoriums and state efforts that “run out of steam” will push monthly filings toward the record of more than 303,000 set in August, Sharga said. The number of homes that revert to lenders, the last stage of foreclosure and known as “real estate owned” or REO properties, will increase to 1 million from as many as 880,000 this year, he said.
This is what started the whole thing rolling. And it won't end until housing stabilizes. The central problem right now is inventory which is still at high levels in both an absolute and months of inventory on the market sense. Foreclosures are continually adding to that total, which in turn is bringing home prices down. And they won't stop falling until the amount of inventory drops -- which won't happen until foreclosures start to drop.
The Clock Ticks Down for GM
From Bloomberg:
This just adds more fuel to the fire.
General Motors Corp. has been asked for payments in advance by a small number of auto-parts suppliers after saying it would run out of money by month’s end without U.S. loans, people familiar with the matter said.
GM has rejected the requests, which so far come from a fraction of its 3,600 suppliers, said the people, who asked not to be identified because the discussions are private. GM typically pays vendors about 45 days after getting an invoice.
Demands for upfront cash add to the strain on the biggest U.S. automaker as it waits on a short-term industry rescue in Washington and the shift in power to President-elect Barack Obama and a new Congress in January. Obama favors using federal funds to remake the companies and keep them out of bankruptcy.
This just adds more fuel to the fire.
Thursday Oil Market Round-Up

Click for a larger Image
Notice the following on the weekly chart:
-- Prices are near their lowest level in three years
-- All the SMAs are moving lower
-- The shorter SMAs are below the longer SMAs
-- Prices are below all the SMAs
BUT:
-- The MACD is very oversold and
-- The RSI is very oversold

Click for a larger image
Notice the following on the daily chart:
-- Prices have been dropping for 5 months
-- All the SMAs are moving lower
-- The shorter SMAs are below the longer SMAs
-- Prices are below all the SMAs
BUT:
-- The MACD is rising, and
-- The RSI is oversold
Bottom line: A lot of technical indicators have been calling for a turnaround for the last 3-4 weeks. But it hasn't materialized. Why? Technical indicators are signals that the possibility of something happening is increasing. A technical indicator could be oversold for months without something happening. This is where a knowledge of the fundamental market is vitally important. Oil traders have been talking relentlessly about demand destruction and a global economic slowdown for the last few months. That's the primary driving force in the oil market. I also think there is an issue of the role speculation played in the run-up to 145. And don't forget the rising dollar and its effect of commodity prices.
Wednesday, December 10, 2008
Today's Market
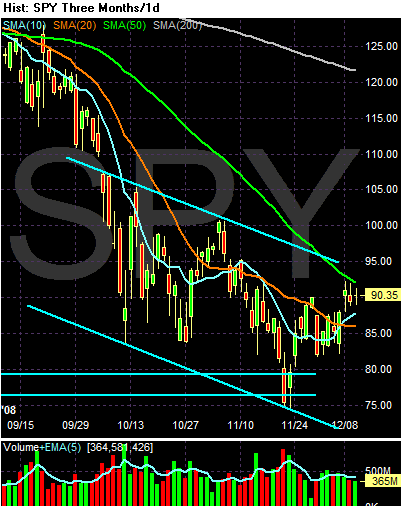
The overall tone of the market is still bearish. Notice all SMAs save the 10 day SMA are moving lower. While the 20 day started moving sideways, it did this at the end of October so this is not a move to thril a trader. Also notice the amount of resistance offered by the 50 day SMA. Prices just do not want to cross that line -- at least not yet.
Stiglitz On the Crisis
From the latest Vanity Fair:
Read the whole thing. Now.
There will come a moment when the most urgent threats posed by the credit crisis have eased and the larger task before us will be to chart a direction for the economic steps ahead. This will be a dangerous moment. Behind the debates over future policy is a debate over history—a debate over the causes of our current situation. The battle for the past will determine the battle for the present. So it’s crucial to get the history straight.
What were the critical decisions that led to the crisis? Mistakes were made at every fork in the road—we had what engineers call a “system failure,” when not a single decision but a cascade of decisions produce a tragic result. Let’s look at five key moments.
Read the whole thing. Now.
Restaurant Jobs No Longer Safe Haven
From the WSJ:
Remember that one of the biggest drops we have seen at the macro level over the last few months are personal consumption expenditures. This trend started in 2007 so it's been going on for some time:

Click for a larger image
And real (inflation-adjusted) retail and food service sales have fallen off a cliff.

Click for a larger image
During the last recession these sales went sideways. From an employment perspective this kept the sector viable as a place to work. However in this recession consumers have cut back sharply. In the chart above note that real sales have dropped.

Click for a larger image
As a result, the year over year percentage change in real sales is now in negative numbers.
Let's compare the the job situation from the last recession to this one. We'll use the "leisure and hospitality" job figures from the BLS. This isn't an exact match, but it's close enough to give us an idea.

Click for a larger image
In the last recession, the total number of jobs in this area of the economy peaked in July 2001 with 12,110,000 jobs. The trough came in June 2002 with 11,905,000 jobs for total job losses of 205,000.
This time around the economy had 13,635,000 leisure and hospitality jobs in December of last year and 13,486,000 in November 2008 for total losses of 149,000 so far.

Click for a larger image
We've also seen a decrease in the number of hours worked during the latest recession.
how is this news impacting the restaurant stocks?

Click for a larger image
As the chart from Prophet.net shows, the industry is holding up relatively well. While it has broken support from the multi-year rally, the sector rallied back to the upward sloping trend line where it ran into resistance. However, the employment numbers indicate this is a laggini sector, so there is probably still some downward pressure left.
Restaurant jobs, a reliable fallback for many unemployed and immigrant U.S. workers, are shrinking almost as fast as tips left on tables.
The restaurant industry, one of the largest U.S. employers, is experiencing its longest period of job losses on record. Data released Friday by the Bureau of Labor Statistics show that food-service and drinking establishments shed jobs for five consecutive months through November. That's the biggest stretch since 1990, when the government began tracking such numbers.
Major chains like Starbucks Corp. and Brinker International Inc., parent of Chili's, are shutting many locations as customers cut back on everything from lattes to Saturday night dinners out. Weak consumer spending and high ingredient prices have pushed many independent restaurants out of business.
Remember that one of the biggest drops we have seen at the macro level over the last few months are personal consumption expenditures. This trend started in 2007 so it's been going on for some time:

Click for a larger image
And real (inflation-adjusted) retail and food service sales have fallen off a cliff.

Click for a larger image
During the last recession these sales went sideways. From an employment perspective this kept the sector viable as a place to work. However in this recession consumers have cut back sharply. In the chart above note that real sales have dropped.

Click for a larger image
As a result, the year over year percentage change in real sales is now in negative numbers.
Let's compare the the job situation from the last recession to this one. We'll use the "leisure and hospitality" job figures from the BLS. This isn't an exact match, but it's close enough to give us an idea.

Click for a larger image
In the last recession, the total number of jobs in this area of the economy peaked in July 2001 with 12,110,000 jobs. The trough came in June 2002 with 11,905,000 jobs for total job losses of 205,000.
This time around the economy had 13,635,000 leisure and hospitality jobs in December of last year and 13,486,000 in November 2008 for total losses of 149,000 so far.

Click for a larger image
We've also seen a decrease in the number of hours worked during the latest recession.
how is this news impacting the restaurant stocks?

Click for a larger image
As the chart from Prophet.net shows, the industry is holding up relatively well. While it has broken support from the multi-year rally, the sector rallied back to the upward sloping trend line where it ran into resistance. However, the employment numbers indicate this is a laggini sector, so there is probably still some downward pressure left.
Commodities Related Job Market Dropping
From the Street.com:
Natural resource jobs have been consistent performers for the job market for the duration of this expansion:

Click for a larger image
As the chart from the Bureau of Labor Statistics demonstrates natural resource related jobs have increased 41% since 2003, increased from 569,000 in May 2003 to 800,000 in November 2008.
But...

Click for a larger image
Companies started cutting back on hours worked/week at the beginning of this year. When the total number of hours/week fell below 45 for the second time this year it should have become obvious problems were developing.
Rio Tinto (RTP Quote - Cramer on RTP - Stock Picks), one of the world's biggest mining companies, plans to cut 14,000 jobs and reduce capital expenditures to $4 billion from $9 billion in 2009 as the global economic downturn has caused sharp falls in commodity prices.
The company said its 2008 dividend will remain at the 2007 level of $1.36.
Rio Tinto said in a press release Wednesday it's committed to reduce operating costs by at least $2.5 billion a year in 2010, and has expanded its "scope of assets targeted for divestment."
Natural resource jobs have been consistent performers for the job market for the duration of this expansion:

Click for a larger image
As the chart from the Bureau of Labor Statistics demonstrates natural resource related jobs have increased 41% since 2003, increased from 569,000 in May 2003 to 800,000 in November 2008.
But...

Click for a larger image
Companies started cutting back on hours worked/week at the beginning of this year. When the total number of hours/week fell below 45 for the second time this year it should have become obvious problems were developing.
Wednesday Commodity Round-Up

Click for a larger image
Notice the following on the weekly chart:
-- Prices are near their lowest level in three years
-- Prices have fallen 54% since their high during the summer
-- Prices are below all the SMAs
-- All the SMAs are moving lower
-- The shorter SMAs are below the longer SMAs
BUT:
-- The MACD is oversold, and
-- The RSI is oversold

Click for a larger image
Notice the following on the daily chart:
-- Prices have been dropping for 5 months
-- Prices have continually moved through previously established lows
-- All the SMAs are moving lower
-- The shorter SMAs are below the longer SMAs
-- Prices are below all the SMAs
BUT
-- The MACD is rising, and
-- The RSI is weak
Bottom line: Three indicators -- the daily MACD, the weekly MACD and the weekly RSI have been signaling a possible reversal for some time. Yet, that reversal has not materialized. Why? First, indicators are not fool-proof; they merely give clues to what might happen. Secondly, there is a fundamental change occurring in the commodities market. Traders are contemplating a prolonged slowdown and the impact of that slowdown on commodity prices. Major commodity companies are reporting layoffs (more on that later today). That is having a pronounced effect on prices that is trumping technical considerations.
Tuesday, December 9, 2008
Reworked Mortgages Aren't Working
From CNBC
In reality, I don't find this that surprising. If someone needs to work their re work their mortgage, it tells us the person was probably in an unaffordable home to begin with.
Companies:Citigroup Inc | Bank of America Corp | JPMorgan Chase and Co
Reuters | 08 Dec 2008 | 01:22 PM ET
Text Size
Recent data suggests that many borrowers who received help with mortgage modifications earlier this year tended to re-default on their payments, a top U.S. banking regulator said on Monday.
"The results, I confess, were somewhat surprising, and not in a good way," said John Dugan, head of the U.S. Office of the Comptroller of the Currency, in prepared remarks for a U.S. housing forum.
"Put simply, it shows that over half of mortgage modifications seemed not to be working after six months," he said.
In reality, I don't find this that surprising. If someone needs to work their re work their mortgage, it tells us the person was probably in an unaffordable home to begin with.
Today's Market

The main issue is the market is still in the middle of a downward sloping channel. Until me get out of this channel we're in for boring update. However, notice the following:
-- All the SMAs except the 10 day SMA are moving lower
-- The shorter SMAs except for the 10 day SMA are below the longer SMA
-- Prices are stuck below the 50 day SMA as well
More Job Cuts Announced
From the NY Times:
From CNBC:
Here's what I think is happening: companies are simply getting the pain out at the end of their fiscal year. These are large job cuts, meaning I don't think they just started talking about them. In other words, the companies are ripping the band-aid off as quickly as possible.
Dow Chemical said Monday it would cut 5,000 full-time jobs — about 11 percent of its work force — close 20 plants and sell several businesses to rein in costs amid the recession.
From CNBC:
Japan's Sony said it will cut 16,000 jobs, curb investment and pull out of businesses to save $1.1 billion a year as the financial crisis ravages demand for its electronics products.
The job cuts are the biggest announced by an Asian firm so far in the crisis and underscore the challenges facing Sony, which has fallen behind Apple Inc's iPod in portable music and is losing money on flat TVs.
Here's what I think is happening: companies are simply getting the pain out at the end of their fiscal year. These are large job cuts, meaning I don't think they just started talking about them. In other words, the companies are ripping the band-aid off as quickly as possible.
A Note on the Auto Bail-Out
I haven't written anything on the auto bail-out. But as someone who writes on economic matters it's probably something I should mention.
Here's my basic opinion. I have spent a fair amount of timecriticizing lampooning the US auto industry. All three companies are run by people who give the word idiot a bad name. And the fact the head of Ford made $50 million over the last 2 years indicates the Board of Directors is just as stupid (I am sure he's not alone -- I just happen to know that number off the top of my head). And no -- this is not the unions fault. The problems rest squarely with management -- you know, the people who are supposed to run the company.
What the auto execs are basically doing right now is using their employees as hostages. At any other time in economic history a bankruptcy the size of GM or Ford would lead to a quarter of negative US growth followed by a resumption of 3%+ growth (maybe two quarters, but you get the idea). Unfortunately, right now the economy cannot afford a bankruptcy of that size without running the risk of that particular event leading to a major and prolonged downswing. It would be like throwing a boulder into a puddle -- the puddle will probably disappear.
That being said, I am an incredibly reluctant supporter of the bail-out, not because I think it's a good idea but because letting a US car company go bankrupt would be an incredibly bad idea. As a result, I would attach a ton of conditions to the money. For example, mileage standards would have to improve big-time. The big three's reliance on the SUV business model would go bye-bye. Executive compensation would have to be cut until the companies showed a profit (personally, I would propose a package and then subtract the total compensation for the last 5 years for the Board of Directors and Executives from the package total because these guys clearly didn't earn that money). Major financial cuts at all levels would happen. That means executive fly coach and rent compact cars on business trips. Downsizing from a physical plant and personnel perspective is a must. Simply put, the car companies would still have to face major restructuring. It's simply unavoidable at this point; the US auto industry would look very different when this is all said and done.
Angry Bear adds some really interesting ideas and observations
Here's my basic opinion. I have spent a fair amount of time
What the auto execs are basically doing right now is using their employees as hostages. At any other time in economic history a bankruptcy the size of GM or Ford would lead to a quarter of negative US growth followed by a resumption of 3%+ growth (maybe two quarters, but you get the idea). Unfortunately, right now the economy cannot afford a bankruptcy of that size without running the risk of that particular event leading to a major and prolonged downswing. It would be like throwing a boulder into a puddle -- the puddle will probably disappear.
That being said, I am an incredibly reluctant supporter of the bail-out, not because I think it's a good idea but because letting a US car company go bankrupt would be an incredibly bad idea. As a result, I would attach a ton of conditions to the money. For example, mileage standards would have to improve big-time. The big three's reliance on the SUV business model would go bye-bye. Executive compensation would have to be cut until the companies showed a profit (personally, I would propose a package and then subtract the total compensation for the last 5 years for the Board of Directors and Executives from the package total because these guys clearly didn't earn that money). Major financial cuts at all levels would happen. That means executive fly coach and rent compact cars on business trips. Downsizing from a physical plant and personnel perspective is a must. Simply put, the car companies would still have to face major restructuring. It's simply unavoidable at this point; the US auto industry would look very different when this is all said and done.
Angry Bear adds some really interesting ideas and observations
Treasury Tuesdays
Let's start with the long end of the market
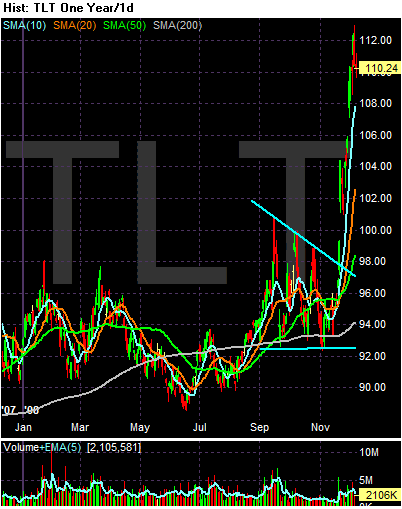
Notice the following on the TLT's
-- Prices consolidated in a triangle pattern from September to mid-November then had a very strong rally
-- The rally from the break-out to the 110 level is a gain of 12.24% -- a pretty impressive monthly gain in the stodgy bond world
-- Prices are above all the SMAs
-- The shorter SMAs are above the longer SMAs
-- All the SMAs are rising
The US 30 year Treasury is currently yielding 3.15%. I have to wonder if that is adequate compensation for a 30 year risk from a 30 loan.
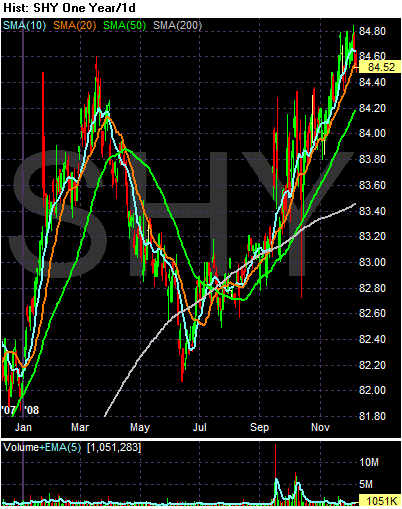
On the SHYs (the short end of the curve) notice the following:
-- Prices started a rally in late June
-- All the SMAs are rising
-- The shorter SMAs are above the longer SMAs
-- Prices are currently right at the 20 day SMA, using it for technical support
-- Also note the SHYs could be forming a long-term double top right now.
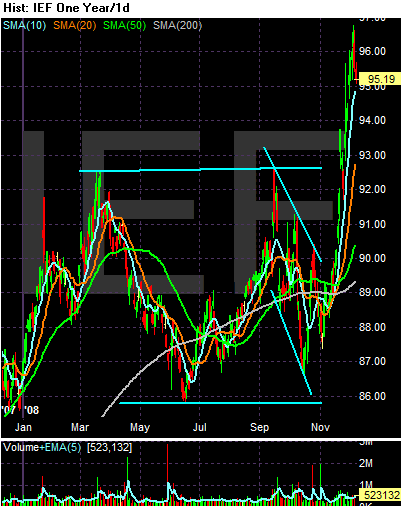
On the year-long IEF chart, notice prices broke out of a year-long consolidation pattern. From low to high the IEF has rallied from 87 to 95 or a gain of about 9%.

Notice the following on the three month chart:
-- Prices are above all the SMAs
-- The shorter SMAs are above the longer SMAs
-- All the SMAs are moving higer

Notice the following on the TLT's
-- Prices consolidated in a triangle pattern from September to mid-November then had a very strong rally
-- The rally from the break-out to the 110 level is a gain of 12.24% -- a pretty impressive monthly gain in the stodgy bond world
-- Prices are above all the SMAs
-- The shorter SMAs are above the longer SMAs
-- All the SMAs are rising
The US 30 year Treasury is currently yielding 3.15%. I have to wonder if that is adequate compensation for a 30 year risk from a 30 loan.

On the SHYs (the short end of the curve) notice the following:
-- Prices started a rally in late June
-- All the SMAs are rising
-- The shorter SMAs are above the longer SMAs
-- Prices are currently right at the 20 day SMA, using it for technical support
-- Also note the SHYs could be forming a long-term double top right now.

On the year-long IEF chart, notice prices broke out of a year-long consolidation pattern. From low to high the IEF has rallied from 87 to 95 or a gain of about 9%.

Notice the following on the three month chart:
-- Prices are above all the SMAs
-- The shorter SMAs are above the longer SMAs
-- All the SMAs are moving higer
Monday, December 8, 2008
Today's Market
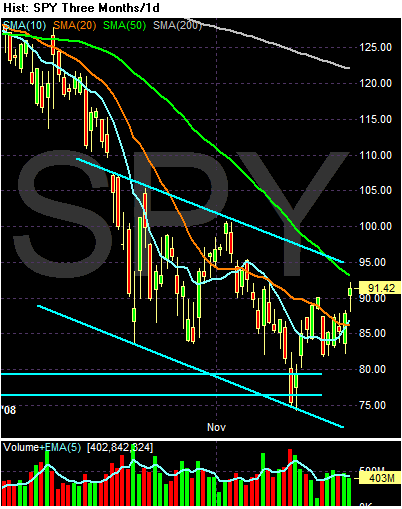
-- The market is still in the middle of a downward sloping channel.
-- The 10 day SMA has crossed over the 20 day SMA
-- All the other SMAs are moving lower
Until we're out of this channel I won't be impressed with any rally. However, consider these charts of the NYSE and NASDAQ AD line (click for a larger image):


Breaking through the upper trend line might not be far off.
We're Nowhere Near a Bottom in Housing
From Bloomberg:
Despite what my friend New Deal Democrat says the housing market is still years away from a bottom. The primary problem is the massive dislocation between supply and demand. Here is a graph from Calculated Risk of the absolute supply of homes on the markets:

Click for a larger image
Notice that on an absolute level, the inventory of existing homes for sale is mammoth. All of the homes in foreclosure will add to that level, which means the downward pressure on prices will continue for some time. Here is a chart (also from Calculated Risk) of the Case Shiller home price index's year over year percentage change in price.

Click for a larger image
Basically home prices are in free fall right now.
When the year over year percentage change in home prices stabilizes we'll be near a bottom in housing.
One in 10 American homeowners fell behind on mortgage payments or were in foreclosure during the third quarter as the world’s largest economy shed jobs and real estate prices tumbled.
The share of mortgages 30 days or more overdue rose to a seasonally adjusted 6.99 percent while loans already in foreclosure rose to 2.97 percent, both all-time highs in a survey that goes back 29 years, the Mortgage Bankers Association said in a report today. The gain in delinquencies was driven by an increase of loans with payments 90 days or more overdue.
.....
New foreclosures fell to 1.07 percent from 1.08 percent in the second quarter as some states enacted laws to temporarily stop home repossessions and lenders increased efforts to modify the terms of loans, Brinkmann said.
.....
Purchases of existing homes in October slid to an annual rate of 4.98 million, lower than forecast, the National Association of Realtors said in a Nov. 24 report. The median price fell 11.3 percent from a year earlier, the most since the group began collecting data in 1968.
Despite what my friend New Deal Democrat says the housing market is still years away from a bottom. The primary problem is the massive dislocation between supply and demand. Here is a graph from Calculated Risk of the absolute supply of homes on the markets:

Click for a larger image
Notice that on an absolute level, the inventory of existing homes for sale is mammoth. All of the homes in foreclosure will add to that level, which means the downward pressure on prices will continue for some time. Here is a chart (also from Calculated Risk) of the Case Shiller home price index's year over year percentage change in price.

Click for a larger image
Basically home prices are in free fall right now.
When the year over year percentage change in home prices stabilizes we'll be near a bottom in housing.
Market Monday's
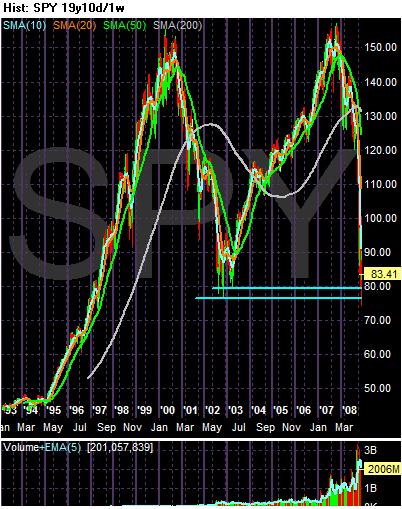
Let's start with a really long view. Note the market has
-- Wiped out the gains from the 2003 - 2007 rally
-- Is trading far below the 200 week SMA
-- Appears to have bounced off a bottom established in the 2002 - 2003 trough
-- The last few weekly bars have occurred on incredibly high volume.
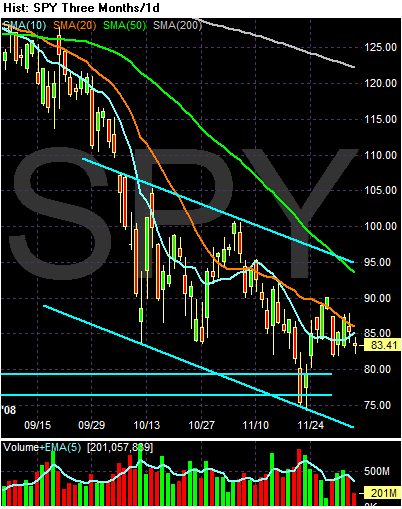
Notice the following on the 3 month chart:
-- Prices are in a downward sloping channel
-- The horizontal lines at the bottom of the chart are from the 2002 - 2003 lows. Prices bounced off the lows and then rallied higher
-- Notice the technical importance of prices in the 83 - 85 area. Prices have found a great deal of support in this area
-- Prices are below the 200 day SMA
-- The 20, 50 and 200 day SMAs are moving lower
-- With the exception of the 10 day SMA all the SMAs are moving lower
-- The 10 day SMA is about to cross over the 20 day SMA. However, this has happened recently with little follow-through. What maters more is when the 20 day SMA starts to move higher -- that is, the 10 day SMA remains above the 20 day SMA for a period of time and the 20 day SMA moves higher as a result.
Subscribe to:
Comments (Atom)