Saturday, April 18, 2020

Abbreviated coronavirus dashboard for April 18


 - by New Deal democrat


Here is the update through yesterday (April 17) 

There are some extended comments I want to make about the pandemic, and some graphs comparing States, etc., that are best done separately, so this will be an abbreviated update.

Here are yesterday’s numbers.

Number and rate of increase of Reported Infections (from Johns Hopkins via arcgis.com)
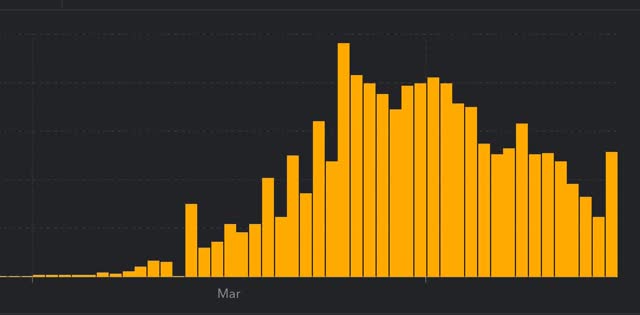
  • Number: up +35,354 to 706,779 (vs. 35,219 prior peak on April 10)
  • ***Rate of increase: day/day: 5% (vs. 5% for the past week, and 5% on April 15)
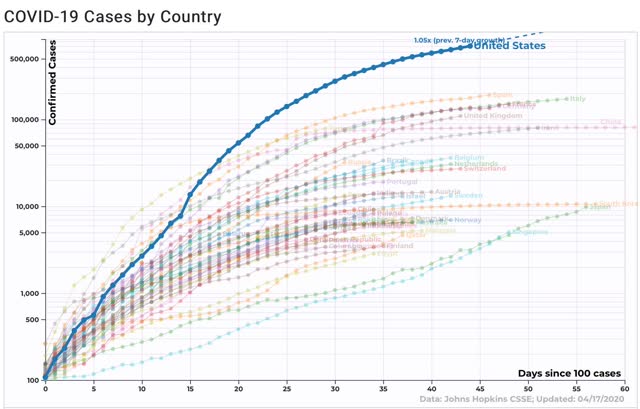
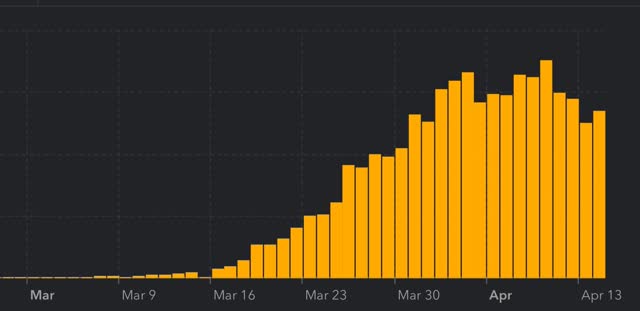
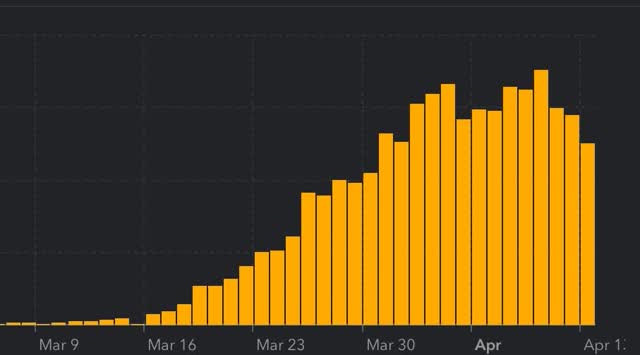
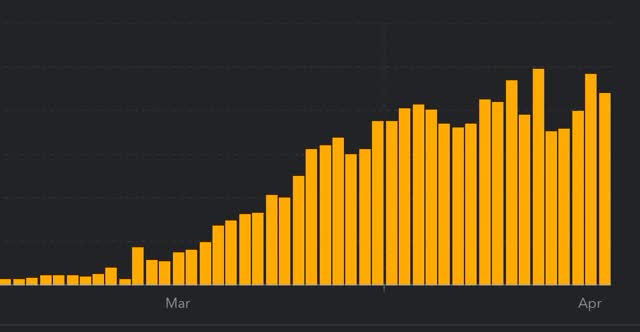
The number of new infections made a new peak yesterday. The increase in the past four days puts us back at the plateau from one week ago.
Number of deaths and infections and rate of increase of testing (from COVID Tracking Project)
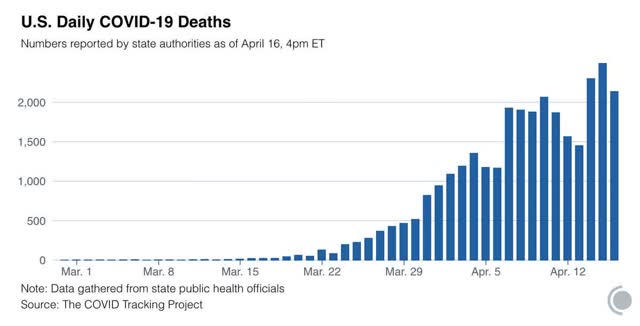
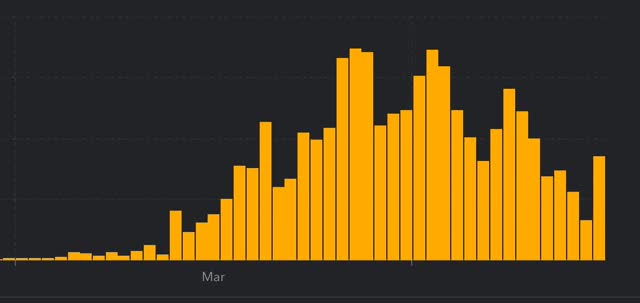
  • ***Number of deaths: Total 32,365, increase of +2,069 day/day (vs. 2,492 daily high on April 15)
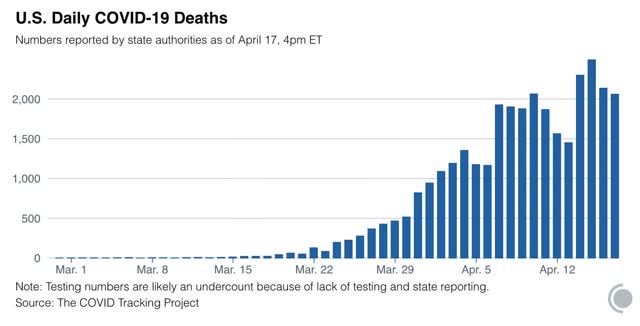
  • Rate: increase of 7% day/day vs. average of 9% in past week
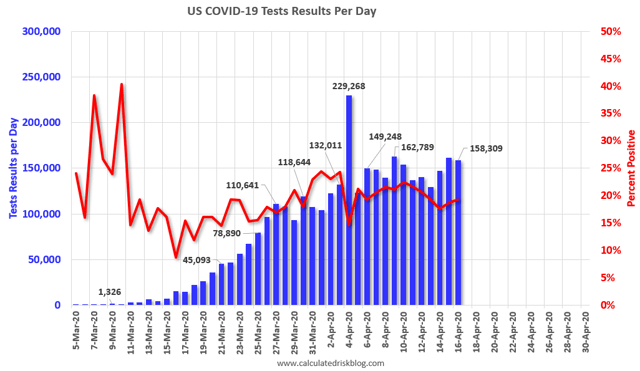
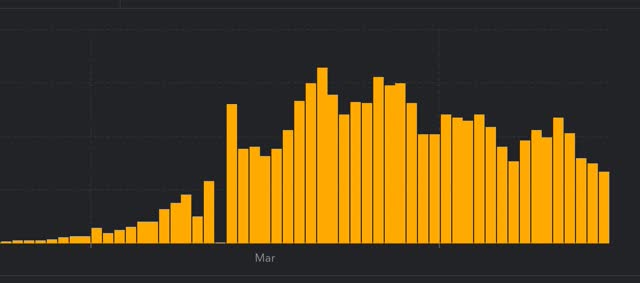
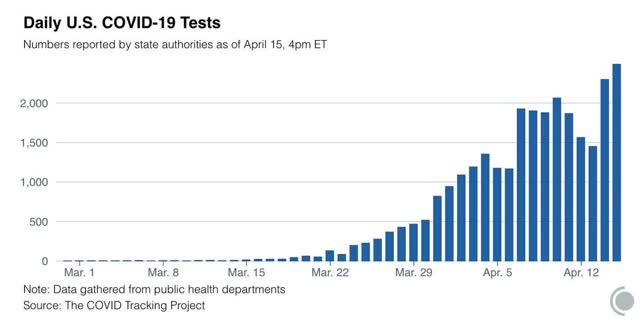
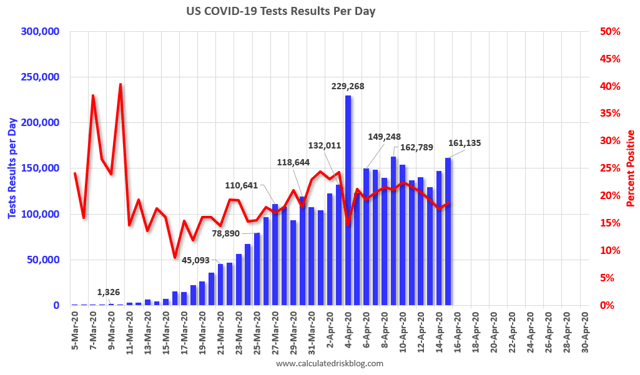
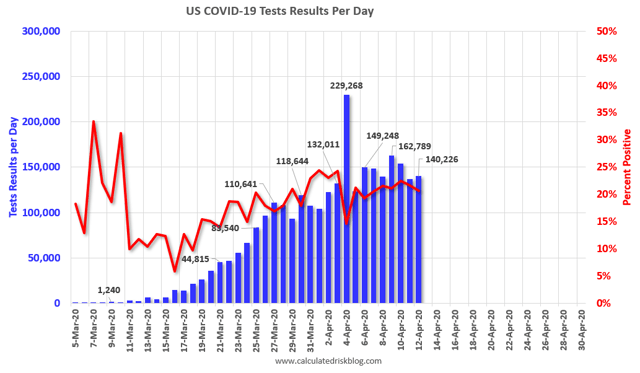
  • Number of tests: 156,429, down -1,880 day/day (vs. 163,769 peak on April 9)
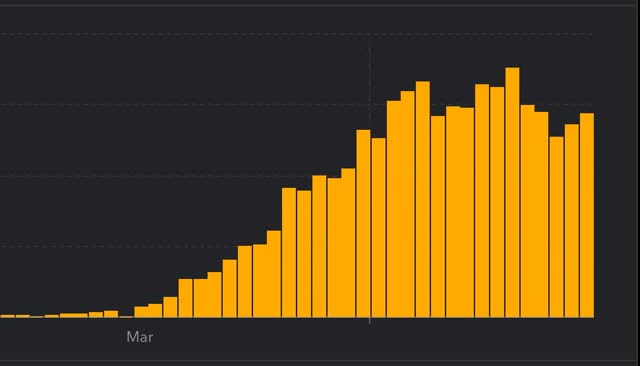
  • Ratio of positive tests to total: 5.0:1 (vs. 5.8:1 peak on March 28)
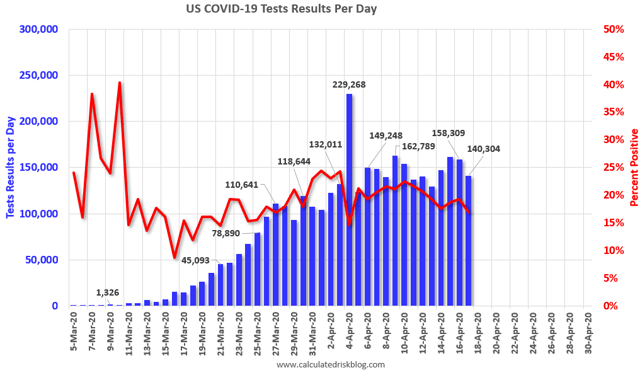

We still aren’t testing nearly enough.

New infections have been increasing at a rate of 5%/daily for a week now, and are back at their peak levels daily from a week ago.

In no way is the US ready to “open up” at all.
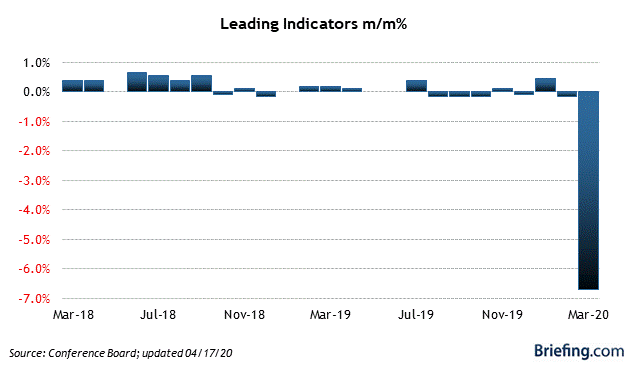
Weekly Indicators for April 13 - 17 at Seeking Alpha


 - by New Deal democrat

My Weekly Indicators post is up at Seeking Alpha.

The final dominoes among the coincident indicators fell this past week. In the “real economy,” the impact of the coronavirus pandemic is fully priced in.

In the stock market . . . I’m scratching my head.

As usual, clicking over and reading should not only be informative for you, but tosses me a penny or two for my efforts in bringing you all this content.

Friday, April 17, 2020

What the Index of Leading Indicators tells us about the 2020 Presidential election


 - by New Deal democrat

One of the better econometric models that I made use of back in 2016 was that by Prof. Robert S. Erickson of Columbia University and Prof. Christopher Wlezien of the University of Texas at Austria, entitled “Forecasting the Presidential Vote with leading economic indicators and the polls”

The model takes two steps. First, average the head-to-head heats by the two major candidates during the first quarter of the election year. Second, apply the result of the Index of Leading Indicators at the end of the first quarter to that average.  

Put simply: if Incumbent Candidate A leads (trails) Challenger Candidate B at the end of the first quarter of the election year, and the Index of Leading Indicators forecasts that the economy will continue to improve (decline), then Candidate A will win (lose). If Incumbent Candidate A leads (trails) Challenger Candidate B at the end of the first quarter of the election year, and the Index of Leading Indicators forecasts a reversal of the economic trend will reverse from improvement to decline (decline to improvement), then the race will tighten, and the outcome might reverse from that predicted by first quarter polling.

Applying this econometric approach to the 2020 election is very unfriendly to Donald Trump, to say the least. In all of the recent head-to-head match-ups with Joe Biden, Trump trails.

But worse is - well, here’s a look at the Index of Leading Indicators as it stands after March’s figure of -6.7% - the worst monthly decline ever recorded - was reported this morning:


Even before the March catastrophe, only 3 of the previous 10 months had been positive numbers. Essentially the index was treading water. As of now, it suggests that the next 4 to 8 months of the economy are going to be the worst since the Great Depression.

Voters are not going to blame Trump for the existence of the coronavirus, or the necessity for at least briefly shutting down the economy in order to halt the virus’s exponential growth. But they certainly can blame him for not acting fast enough, for his incoherence, and for his interference with States’ actions to ameliorate the situation. More succinctly, one or two months of awful news due to a natural catastrophe might be tolerated by voters. But if the awful news continues into the 3rd and maybe even 4th quarter — and the LEI suggests that it will do so for the next few months at least — voters are going to be extremely unforgiving.

At a feral level Trump knows this. That’s why he is left with a “Hail Mary” pass, hoping that if the economy is “opened up” in May the virus will miraculously abate, and that if it doesn’t, he can blame others.

Coronavirus dashboard for April 17: two opposing trends in States for the way forward


 - by New Deal democrat

Here is the update through yesterday (April 16). As usual, significant new items are in italics.

Seven Midwestern States just announced a new consortium for plans to gradually ease restrictions based on a “test, trace, and isolate” regimen. Massachusetts is hiring 1,000 tracers. Meanwhile at the other end of the spectrum, Trumpist governors in two States that never shut down announced that they want to “open up,” even though one of them just had its worst day yet. Meanwhile, tests of the USS Theodore Roosevelt crew added to the evidence that the true number of coronavirus infections is probably closer to the high end, perhaps 5x, of tested numbers.

In Washington, Trump announced a “three phase” plan to gradually open up the economy, which is said to be less stringent than CDC guidelines:

States must first meet a "gating" criterion that includes a "downward trajectory of documented cases within a 14-day period" or a "downward trajectory of positive tests as a percent of total tests within a 14-day period (flat or increasing volume of tests)," as well as hospital preparedness. 
Under the first phase of the three-phase plan, restaurants, movie theaters and large sporting venues would be appropriate to reopen under certain conditions, while schools, day care centers and bars would noto reopen.
The guidelines do not suggest any reopening dates.
Here are yesterday’s numbers.

Number and rate of increase of Reported Infections (from Johns Hopkins via arcgis.com)
  • Number: up +31,761 to 671,425 (vs. 35,219 peak on April 10)

  • ***Rate of increase: day/day: 5% (vs. 5% for the past week, and 5% on April 15)

The number of new infections has declined from a recorded peak last week. The increase in the past three days is concerning, but hopefully is just temporary noise.
Number of deaths and infections and rate of increase of testing (from COVID Tracking Project)
  • ***Number of deaths: Total 30,296, increase of +2,136 day/day (vs. 2,492 daily high on April 15)

  • Rate: increase of 8% day/day vs. average of 9% in past week
  • Number of tests: 158,309, down -2,826 day/day (vs. 163,769 peak on April 9)
  • Ratio of positive tests to total: 5.2:1 (vs. 5.8:1 peak on March 28)
  •  
US States and population in total lockdown, business lockdown, and partial restrictions - no changes in past 24 hours 
Below are the States that have not gone to lockdown orders:
  • Partial restrictions on business (bars, restaurants): 5 States (IA*, ND^, NE, UT*^, WY^) 9.7 million, 2.9%
  • School closure only: 2 States (AR^, SD*) 3.9 million, 1.2%
*some local areas under lockdowns
^restrictions on or quarantine of travelers from out of State
US States and population with “test, trace, and quarantine” programs
  • East Coast consortium: 7 States: CT, DE, MA, MD, NJ, NY, PA, RI (53.7 million)
  • West Coast consortium: 3 States: CA, OR, WA (31.3 million)
  • Midwest consortium: 7 States: IL, IN, KY, MI, MN, OH, WI (57.0 million)
  • Mid-Atlantic consortium*: 3 Jurisdictions: DC, MD, VA (15.2 million)
*informal cooperation
Total population covered by consortiums: 157.2 million)
Summary for April 16

Here’s how we stand (meaningful new developments in italics): 
  • About 95% of the total US population remains under total lockdown.
  • In States with no lockdowns, a meat-packing plant in South Dakota has emerged as the new national hotspot. Trumpist governors in Wyoming and North Dakota are speaking of easing restrictions further by May 1, even though the latter has just had its worst day for new infections yet.
  • The number of daily new infections appears to have plateaued in the past week, and is slightly lower. The trend in deaths is unclear. I am looking for a decline of roughly 15%/week in new infections if the peak has indeed been reached, so long as the lockdowns stay in place.
  • The number of daily tests has improved a little bit to about 160,000. We likely are continuing to miss a large percent of new infections. My personal suspicion is that the . Testing of the nearly 4,000 sailors on board the USS Theodore Roosevelt indicated that 60% of the 600+ infected were asymptomatic. This makes me think the actual number of total infections in the US is about 5x the official number, or roughly 3.5 million at present.
  • The Trump Administration has taken no steps - and realistically will never take steps -towards a nationwide “test, trace, and quarantine” plan that will be needed to lift lockdowns, or to assist States to do so, and is using a haphazard, secret, and likely corrupt method of distributing vital medical equipment. The “guidelines” it announced yesterday are not concrete, and are less stringent than the CDC’s.
  • In the absence of federal action, 20 States with almost half the US population  are either coordinating in making purchases of the necessary equipment, and/or to develop their own “test, trace, and quarantine” plan, but specifics in how to accomplish that have not emerged.
  • Some private companies are developing technologies or equipment to be used in a “test, trace, and quarantine” regimen. Abbott Labs has premiered a test which it says can be administered 1,000,000x/day. 

Thursday, April 16, 2020

Coronavirus dashboard for April 16: if new infections have passed peak, what pace of decline can we expect?


 - by New Deal democrat

Here is the update through yesterday (April 15). Significant new items are in italics

In the US, the only significant development yesterday was that deaths rose to yet another new daily high, while infections continued to be below last week’s peak.

Since I want to look ahead, now that lockdowns appear to have worked and the number of new daily infections appears to have peaked, what should the slope of declines look like? For that, I turned to three countries in Europe all of which have seen their peaks: Spain, Germany, and Italy. Here’s what each of them look like, in order:

Spain - in the 3 weeks since peak, cases have declined by about 50% total from 10,000 per day to 5,000 per day (or 17%/week):


Germany - in the 2 weeks since peak, cases have declined by about 60% total from 8,000 per day to 3,200 per day (or 30%/week):  


Italy - in the nearly 4 weeks since peak, cases have declined by about 55%, also from about 8,000 per day to 3,400 per day (or 14%/week) 

Of the three countries, Germany has been doing an excellent job of testing, tracing, and isolating, so I do not expect the US to follow that trajectory. On the other hand, in the 6 days since its apparent peak, on a three day rolling bases new cases in the US has declined about -19% from peak. So, conservatively we can hope for at least 15% declines weekly from peak, or about a 60% decline to roughly 13,000 cases per day by the first week of May. That will be my next forward-looking marker.

Now, let’s look at yesterday’s numbers.

Number and rate of increase of Reported Infections (from Johns Hopkins via arcgis.com)
  • Number: up +29,979 to 639,664 (vs. 35,219 peak on April 10)

  • ***Rate of increase: day/day: 5% (vs. 6% for the past week, and 5% on April 12)

The number of new infections has declined from a recorded peak last week. Hopefully the increase in the past two days is just temporary noise.
Number of deaths and infections and rate of increase of testing (from COVID Tracking Project)
  • ***Number of deaths: Total 28,160 increase of +2,492 day/day (new daily high)

  • Rate: increase of 10% day/day vs. average of 10% in past week
  • Number of tests: 161,135, up +14,521 day/day (vs. 163,769 peak on April 9)
  • Ratio of positive tests to total: 5.3:1 (vs. 5.8:1 peak on March 28)

US States and population in total lockdown, business lockdown, and partial restrictions - no changes in past 24 hours 
Below are the States that have not gone to lockdown orders:
  • Partial restrictions on business (bars, restaurants): 5 States (IA, ND^, NE, UT*^, WY^) 9.7 million, 2.9%
  • School closure only: 2 States (AR^, SD*) 3.9 million, 1.2%
*some local areas under lockdowns
^restrictions on or quarantine of travelers from out of State
US States with “test, trace, and quarantine” programs
  • East Coast consortium: 7 States: CT, DE, MA, MD, NJ, NY, PA, RI
  • West Coast consortium: 3 States: CA, OR, WA
  • Also under development: 1 State: UT
  • Midwest consortium*: 3 States: MI, MN, WI
*procurement of medical supplies only
Summary for April 15

Here’s how we stand (meaningful new developments in italics): 
  • About 95% of the total US population remains under total lockdown.
  • In States with no lockdowns, a meat-packing plant in South Dakota has emerged as the new national hotspot.
  • The number of daily new infections appears to have plateaued in the past week, and is slightly lower, while deaths made another new high. Per my introductory section above, I am looking for a decline of roughly 15%/week in new infections if the peak has indeed been reached, so long as the lockdowns stay in place.
  • The number of daily tests has improved a little bit from about 140-150,000. We likely are continuing to miss a large percent of new infections. My personal suspicion is that the actual number of total infections in the US is between 2-5x the official number.
  • The Trump Administration has taken no steps - and realistically will never take steps -towards a nationwide “test, trace, and quarantine” plan that will be needed to lift lockdowns, or to assist States to do so, and is using a haphazard, secret, and likely corrupt method of distributing vital medical equipment.
  • In the absence of federal action, 14 States are either coordinating in making purchases of the necessary equipment, and/or to develop their own “test, trace, and quarantine” plan, but specifics in how to accomplish that have not emerged.
  • Some private companies are developing technologies or equipment to be used in a “test, trace, and quarantine” regimen. Abbott Labs has premiered a test which it says can be administered 1,000,000x/day. 

March housing, latest weekly jobless claims slightly less apocalyptic than expected


 - by New Deal democrat

If I were President, the one industry in the economy that I would be actively trying to prop up is housing. As I have repeated constantly over the past 10+ years, housing is a long leading indicator. The permit that is issued today means a house that is built over the next 4 to 12 months, means contractors being employed, mortgages being issued, and furnishings, appliances, and landscaping continuing to be bought for a year or two afterward.

In other words, if I could keep the housing industry going through the coronavirus pandemic, it would lay a solid basis for the return of the consumer thereafter. The bad news is, needless to say, that there is no such organized effort, whether by government or business itself. The less bad news is that permits and starts did not completely fall apart in March, but of course only the second half of March was really impacted by the coronavirus shutdowns.

Let’s take a look.  

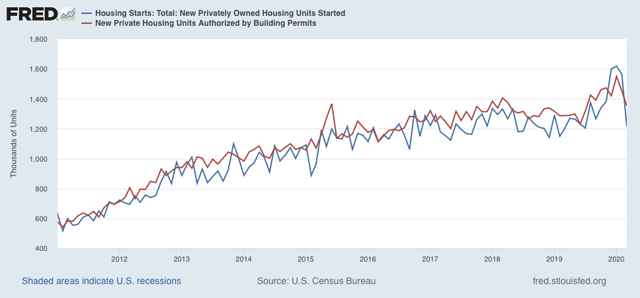
Actual housing starts declined 348,000 on an annualized basis to 1.216 million (blue), while permits (red) declined less: -99,000 to 1.353 million:


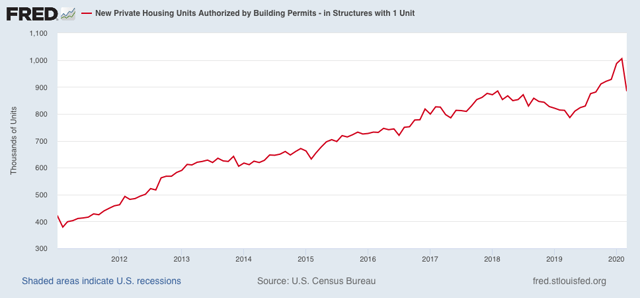
The less volatile single family permits declined -121,000 to 884,000 annualized:


The March declines above only took us back to the levels of last summer, so so far, so not so awful. 

If I were a developer, I would be finding a way to keep my model homes open, with hand sanitizer generously available, a rule of one household at a time in the sales office and model, a sanitizing agent to accompany prospective buyers and clean up after each tour, and an advertising campaign touting those things and advocating people get out of the house to tour my open models, noting record low mortgage rates as well. Maybe some enterprising developer will blaze the trail.

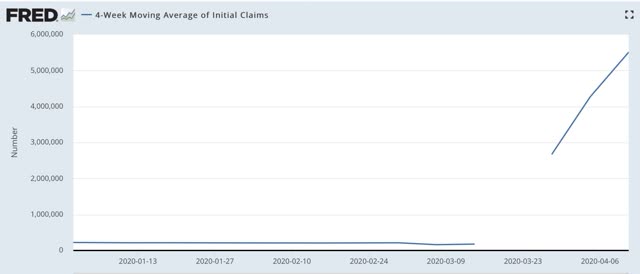
In the meantime, initial jobless claims declined to a less awful 5.245 million last week, bringing the total for the past 4 weeks to over 22 million! And that doesn’t include all the people who apparently have been able to get through to file in some States. Here’s the 4 week moving average:


With one more week to plug into my model, it continues to look like 20 to 25 million jobs will be recorded as lost when the April jobs report comes out: 


Wednesday, April 15, 2020

Coronavirus dashboard for April 15: Infections lower but deaths make new daily high


 - by New Deal democrat

Here is the update through yesterday (April 14) 

Highlights in italics. There were no significant developments yesterday. Deaths rose to a new daily high, but probably reflected the recording of the data after the weekend.

Number and rate of increase of Reported Infections (from Johns Hopkins via arcgis.com)
  • Number: up +27,091 to 609,685 (vs. 35,219 peak on April 10)

  • ***Rate of increase: day/day: 5% (vs. 6% for the past week, and 4% on April 13)

The number of new infections has clearly declined from a recorded peak last week.
Number of deaths and infections and rate of increase of testing (from COVID Tracking Project)
  • ***Number of deaths: Total 25,668, increase of +2,299 day/day (new daily high)

  • Rate: increase of 10% day/day vs. average of 11% in past week
  • Number of tests: 146,614, up +17,500 day/day (vs. 163,769 peak on April 9)
  • Ratio of positive tests to total: 5.7:1

US States and population in total lockdown, business lockdown, and partial restrictions - no changes in past 24 hours 
Below are the States that have not gone to lockdown orders:
  • Partial restrictions on business (bars, restaurants): 5 States (IA, ND^, NE, UT*^, WY^) 9.7 million, 2.9%
  • School closure only: 2 States (AR^, SD*) 3.9 million, 1.2%
*some local areas under lockdowns
^restrictions on or quarantine of travelers from out of State
US States with “test, trace, and quarantine” programs
  • East Coast consortium: 7 States: CT, DE, MA, MD, NJ, NY, PA, RI
  • West Coast consortium: 3 States: CA, OR, WA
  • Also under development: 1 State: UT
  • Midwest consortium*: 3 States: MI, MN, WI
*procurement of medical supplies only
Summary for April 14

Here’s how we stand (meaningful new developments in italics): 
  • About 95% of the total US population remains under total lockdown.
  • In States with no lockdowns, while South Dakota has emerged as a new hotspot, its governor has denied the lack of a lockdown has played a role. Meanwhile, a mall in Nebraska plans to reopen.
  • The number of both daily new infections appears to have plateaued in the past week, while deaths made a new high.
  • The number of daily tests has stalled at about 140-150,000. As a result, we likely have been missing a large percent of new infections. My personal suspicion is that the actual number of total infections in the US is between 2-5x the official number.
  • The Trump Administration has taken no steps towards a nationwide “test, trace, and quarantine” plan that will be needed to lift lockdowns, or to assist States to do so, and is using a haphazard, secret, and likely corrupt method of distributing vital medical equipment.
  • In the absence of federal action, 14 States are either coordinating in making purchases of the necessary equipment, and/or to develop their own “test, trace, and quarantine” plan. Yesterday, Michigan’s governor indicated she was speaking with other Midwestern governors about developing such a consortium similar to the Northeast and West Coast consortiums.
  • Some private companies are developing technologies or equipment to be used in a “test, trace, and quarantine” regimen. For example, Google and Apple have premiered an app under development that will trace coronavirus contacts. 
  • Trump backed off his claims of “total authority” to “open up” States’ lockdowns.

March retail sales and industrial production: not nearly as awful as might have been expected


 - by New Deal democrat

Both March retail sales and industrial production were reported this morning. After employment, these are the two biggest reports I follow each month. 

In particular, normally I spend a lot of time parsing the long and short leading aspects of retail sales - especially as it tends to shortly lead employment. I don’t think that is particularly useful to resume yet. Industrial production, by contrast, is the King of coincident indicators.

Since the economic effects of the coronavirus pandemic only hit in the second half of March, I don’t think we are seeing the full impact in these numbers. But let’s take a look at what they show so far.

Both were objectively awful. But neither one was as awful as could easily have been expected. Both knocked off about the last 2.5 years of growth.

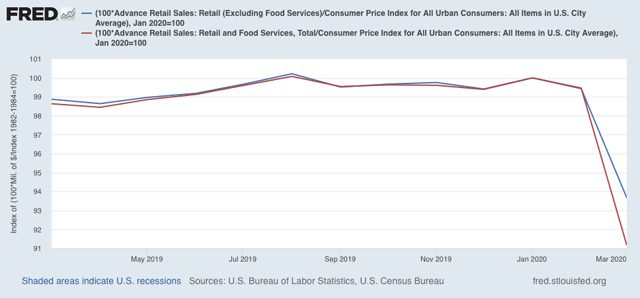
First, here’s real retail sales, both excluding (blue) and including (red) food services. I include the former because, of course, restaurants have been all but obliterated by the lockdowns:


Including food services, real retail sales were down -8.8% from their January peak. Excluding food services, they were down -6.3% from that peak. 

While in normal times that would be awful, that both maintained over 90% of their pre-coronavirus levels is cautiously encouraging news. Partly this is probably because of early March hoarding, partly because some services, like grocery stores, have to remain open, and partly because there is probably a big surge in online shopping.

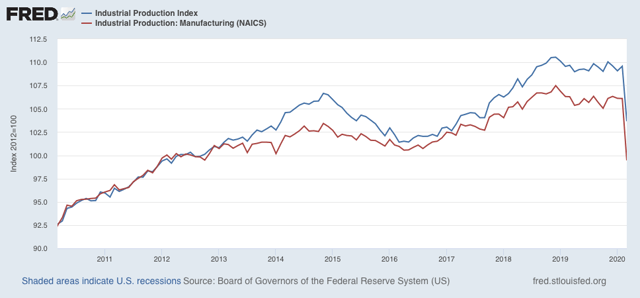
Turning to industrial production, we see a similar story. Total production declined -5.4% from February, and manufacturing declined -6.3%:


Both of these were not nearly so bad as might have been anticipated.

I expect worse to come when this month’s reports are released in May. But for now, the takeaway is “less awful,” and I’ll take it.

Tuesday, April 14, 2020

Huge initial jobless claims numbers point to massive 25,000,000 loss in April jobs report


 - by New Deal democrat

This is something I’ve been meaning to post since the last three weeks of huge, 3- and 6,000,000-plus numbers of initial jobless claims.

There is a general correlation between initial jobless claims and payrolls. Even in the best months, 1,000,000 total claims for initial benefits might be filed. But that is offset by 1,200,000 or more new hires for new jobs - I.e., for example, a net gain of 200,000 jobs during the month.

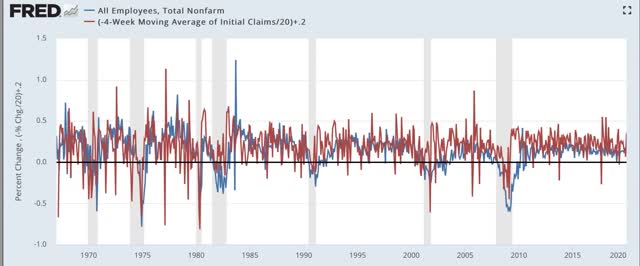
If we take the gain of roughly +.2% monthly in net jobs in a good jobs market, we can create a pretty decent historical correlation between the percent change in new jobless claims (blue, inverted in the graph below) and net jobs in the monthly payrolls report (red):


Noisy, but the correlation generally holds. Of course, the above graph stops before the month of March 2020, when all hell broke loose (and will make future historical graphing of initial claims and jobs a real challenge).

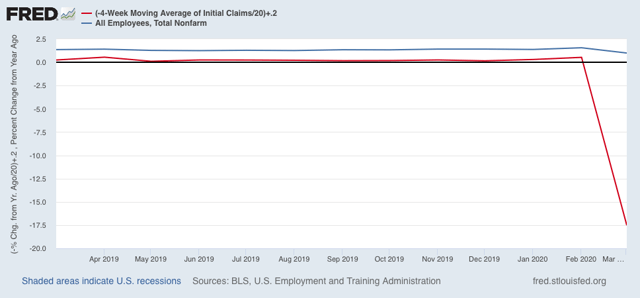
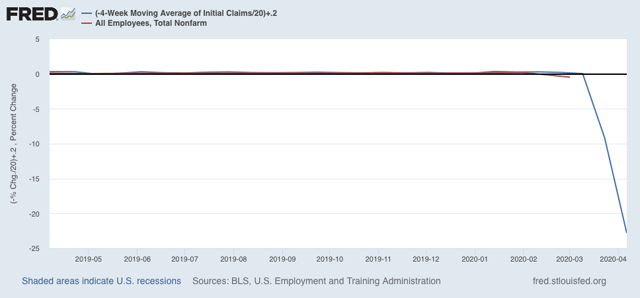
So here is the past year, through last week’s initial claims report:


The 4 week average of initial jobless claims suggests that the April jobs report is going to show something like a 25% loss in the entire jobs market! Since going into the crisis there were about 150,000,000 jobs in the US, a 25% loss equates to about -30,000,000 jobs.

Truly staggering.

P.S.: By the way, under any econometric election model you can find, such a loss if not quickly reversed portends disaster for the presidential candidate of the incumbent party.

Coronavirus dashboard for April 14: two consortiums of States formed


 - by New Deal democrat

Here is the update through yesterday (April 13) 

The big news yesterday was the formation of 2 consortiums of States, on the East and West Coasts (something I have advocated and predicted for a month), to develop and jointly implement plans to “test, trace, and quarantine” as part of detailed plans to reopen their economies, completely sidestepping the inert federal government.

Number and rate of increase of Reported Infections (from Johns Hopkins via arcgis.com)
  • Number: up +25,004 to 582,594 (vs. 35,219 prior peak on April 10)

  • ***Rate of increase: day/day: 4% (vs. 7% for the past week, and 5% on April 12)

Yesterday marked the lowest number of new infections in over a week, and the smallest % increase since early March.
Number of deaths and infections and rate of increase of testing (from COVID Tracking Project)
  • ***Number of deaths: Total 23,369 up +1,450 day/day

  • Rate: increase of 7% day/day vs. average of 12% in past week
  • Number of tests: 129,114, down -11,112 day/day
  • Ratio of positive tests to total: 4.5:1

US States and population in total lockdown, business lockdown, and partial restrictions - no changes in past 24 hours 
Below are the States that have not gone to lockdown orders:
  • Partial restrictions on business (bars, restaurants): 5 States (IA, ND^, NE, UT*^, WY^) 9.7 million, 2.9%
  • School closure only: 2 States (AR^, SD*) 3.9 million, 1.2%
*some local areas under lockdowns
^restrictions on or quarantine of travelers from out of State
US States with “test, trace, and quarantine” programs
  • East Coast consortium: 7 States: CT, DE, MA, MD, NJ, NY, PA, RI
  • West Coast consortium: 3 States: CA, OR, WA
  • Also under development: 1 State: UT
  • Midwest consortium*: 3 States: MI, MN, WI
*procurement of medical supplies only
Summary for April 14

Here’s how we stand (meaningful new developments in italics): 
  • About 95% of the total US population remains under total lockdown.
  • The number of both daily new infections and deaths appear to have plateaued in the past week.
  • The number of daily tests has stalled at about 140-150,000. As a result, we likely have been missing a large percent of new infections. My personal suspicion is that the actual number of total infections in the US is between 2-5x the official number.
  • The Trump Administration has taken no steps towards a nationwide “test, trace, and quarantine” plan that will be needed to lift lockdowns, or to assist States to do so, and is using a haphazard, secret, and likely corrupt method of distributing vital medical equipment.
  • In the absence of federal action, 14 States are either coordinating in making purchases of the necessary equipment, and/or to develop their own “test, trace, and quarantine” plan.
  • Some private companies are developing technologies or equipment to be used in a “test, trace, and quarantine” regimen. For example, Google and Apple have premiered an app under development that will trace coronavirus contacts. 
  • Trump has claimed “total authority” to “open up” States’ lockdowns which if done would likely create a Constitutional crisis, as several States have already indicated that they would refuse to follow a (likely Unconstitutional) federal “order.”

Sent from my iPad

Monday, April 13, 2020

Coronavirus dashboard for April 13: Plateauing and stasis


 - by New Deal democrat

Here is the update through yesterday (April 13). The bottom line is that infections and deaths appear to have plateaued, while there has been no progress towards any “test, trace, and quarantine” regimen that is the necessary next step; and to the contrary Trump appears to be bound and determined to try to reverse lockdowns anyway.

Number and rate of increase of Reported Infections (from Johns Hopkins via arcgis.com)
  • Number: up +27,584 to 557,590 (vs. 35,219 prior peak on April 10

  • ***Rate of increase: day/day: 5% (vs. 8% for the past week, and 6% on April 11)

Yesterday marked the lowest number of new infections in 7 days, and the smallest % increase since early March.
Number of deaths and infections and rate of increase of testing (from COVID Tracking Project)
  • ***Number of deaths: Total 21,919 up +1,564 day/day

  • Rate: increase of 8% day/day vs. average of 13% in past week
  • Number of tests: 140,226, up +28,983 day/day
  • Ratio of positive tests to total: 4.8:1

US States and population in total lockdown, business lockdown, and partial restrictions - no changes in past 24 hours 
Below are the States that have not gone to lockdown orders:
  • Partial restrictions on business (bars, restaurants): 5 States (IA, ND^, NE, UT*^, WY^) 9.7 million, 2.9%
  • School closure only: 2 States (AR^, SD*) 3.9 million, 1.2%
*some local areas under lockdowns
^restrictions on or quarantine of travelers from out of State
US States with “test, trace, and quarantine” programs - no changes
  • Under development: 6 States: CT, MA, MD, NJ, NY, UT

Summary for April 13

Here’s how we stand (meaningful new developments in italics): 
  • About 95% of the total US population remains under total lockdown.
  • The number of both daily new infections and deaths appear to have plateaued in the past week.
  • The number of daily tests has stalled at about 140-150,000. As a result, we likely have been missing a large percent of new infections. My personal suspicion is that the actual number of total infections in the US is between 2-5x the official number.
  • The Trump Administration has taken no steps towards a nationwide “test, trace, and quarantine” plan that will be needed to lift lockdowns, or to assist States to do so, and is using a haphazard, secret, and likely corrupt method of distributing vital medical equipment.
  • In the absence of federal action, various States are either coordinating in making purchases of the necessary equipment, and/or to develop their own “test, trace, and quarantine” plan.
  • Until States or the federal government implement a regimen of “test, trace, and quarantine,” lockdowns cannot be lifted.
  • Some private companies are developing technologies or equipment to be used in a “test, trace, and quarantine” regimen. For example, Google and Apple have premiered an app under development that will trace coronavirus contacts. 
  • Any attempt to “open up” the lockdowns with testing so far behind - aside from creating a Constitutional crisis, assuming the States would refuse to follow a (likely Unconstitutional) federal “order” - would be yet another disaster, as we could expect the disease to rapidly re-accelerate towards its former rate of 35% growth in new infections daily.

Sunday, April 12, 2020

A thought for Sunday: a brief history of Republics anticipates Trump


 - by New Deal democrat

I just finished reading William R. Everdell’s “The End of KIngs: A History of Republics and Republicans,” which was originally published in 1983. It was interesting to read a book that treated Watergate as recent history!

I want to write at more length about this book, but for now, consider the following excerpts and consider how they relate to our current situation.

In his chapter about the Weimar Republic, Everdell writes: 

The “Reichsprasident” of Weimar was nothing but a kaiser in reserve.... Not only was his constituency national and democratic, like that of Louis Napoleon in 1848, his term, at seven years, was longer and he could be reelected indefinitely. He had not need to stage an illegal coup like Napoleion’s in 1851, because by the contittution’s famous Article 48 he was empowered, in times of what he determined to be “public disturbance,” to take “necessary measures.” These included the overruling of state laws, the abrogation of all civil liberties, the making of national laws by decreee, the execution of law by the army, and the establishment of exceptional courts and jurisdictions.
Two thin hedges protected parliamentary republican power from the overwhelming strength of the kaiser in reserve. One was ... impeach[ment].... The other was the provision of a veto, by majority vote of the Reichstag, of all presidential decrees under Article 48.” [but the President could prorogue the parliament, making it imposssible for them to do so]..... 
Adolf Hitler had formed [the Nazi party]... on the three simple principles of ... tyranny. The first was the fuhrerpriinzip, a popular version of the old Kaiser ideal according to which every member obeyed HItler without question and was reciprocally identified with him. The two others were complete unscrupulousness with regard to tactics and complete opportunism with regard to program..... 
Hitler ... had to promise nearly every class and interest precisely what it wanted. The Nazis ... offer[ed] labor peace to businessmen, benefits to workers, uniforms to militarists, and anything to anyone, unless of course he were Jewish.
It’s as if Trump treated Hitler’s campaign, and his use of emergency powers, as a “how to” manual.
——

In his chapter on historic clashes between the US Senate and presidents, he writes,
If presidents ever do succeed in establishing a monarchy in America, the last institution to stand against them will probably be the Senate.
(P. 271) 
Mr. Everdell, meet Mitch McConnell.

Following NIxon’s re-election in 1972,
  

At the Office of Economic Opportunity that January, an unconfirmed Acting Director set about dismantling the agency....
By April, Attorney-General Kleindienst was explaining that executive privilege protected any member of the executive branch from the grim necessity of talking to Congress or a court. ... Nixon ... announc[ed] just after the election and again in March that he would veto any spending bill he thought excessive, and that if Congress overrode him he would simply “impound” or refuse to spend the funds ....
The press, too, was on notice of approve the president. In December 1972, an unconfirmed Nixon appointee named Clay Whitehead had threatened local television stations with Federal Trade Commission action if they continued to broadcast the “elitist gossip” of the network news.

(Pp. 294-5)
Were Trump and William Barr taking notes?