I've been thinking about the market rally, GDP growth and money supply all morning. Here's my line of thought.
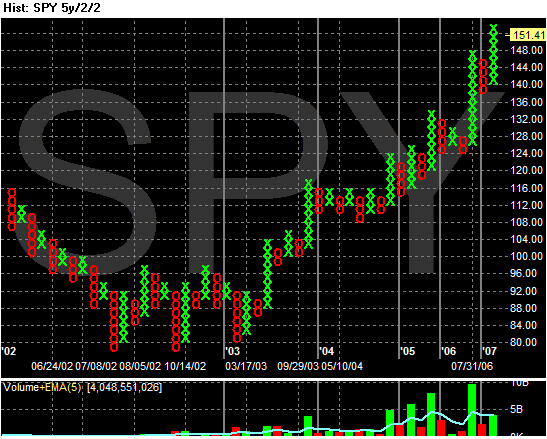
1.) Here's a P&F chart of the SPY rally. Notice it started on 7/31.
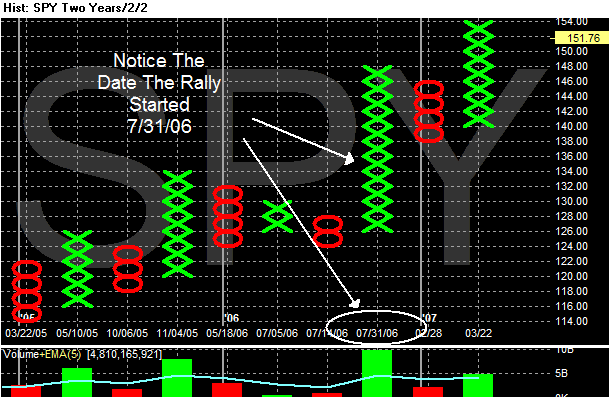
2.) The second quarter ended on 6/31. The BEA releases the GDP information on three dates: the last day of each subsequent month. So, we would have the 2nd quarter releases on the last day of July, August and September. In addition, the third quarter numbers would come out on the last day of October, November and December.
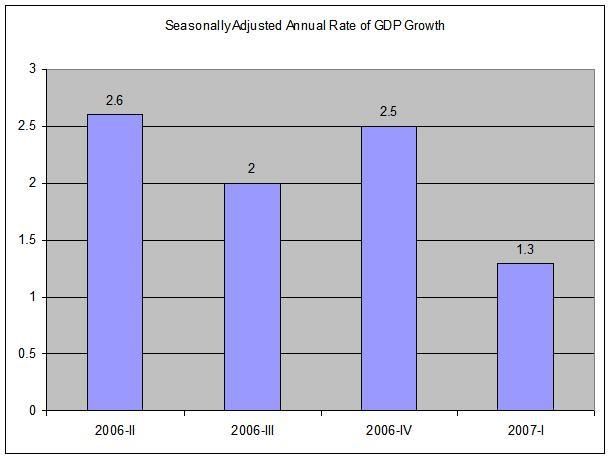
3.) By the end of November 2006 we had the second release of third quarter GDP. By then it was obvious the US economy was slowing down. Here is a chart of the last 4 quarters of the seasonally adjusted annual rate of US GDP growth.
4.) Here's a chart of the YOY change in money supply. Notice it starts to pick-up in roughly late October/early November. Let's assume the Federal Reserve policy makers have advance knowledge of the GDP numbers.
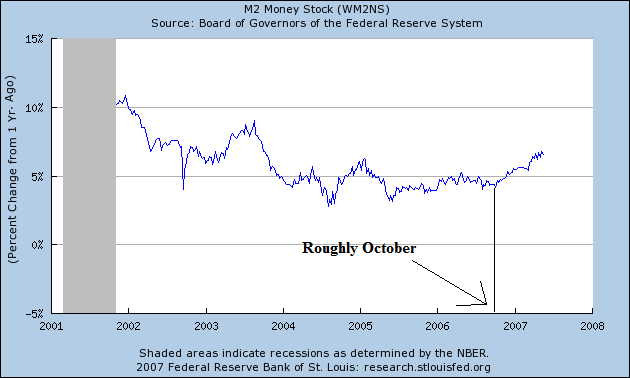
This train of thought leads to the following question.
1.) Is the Federal Reserve "priming the pump" -- keeping the market afloat with more actual dollars when the economy is slowing down?
2.) Why is the Federal Reserve Increasing money supply when they are concerned about inflation? Aren't they contributing to their problem?
Now -- why would the Fed do this?
1.) Increasing the money supply would help to ameliorate the slowdown by giving people more money to spend. This could partially explain why consumer spending has been robust throughout the slowdown -- people simply have more physical dollars in their pocket. This is an entirely legitimate exercise of the Fed's authority.
2.) The US has become an asset dependent economy. As the US savings rate has decreased, it's asset base has increased. And as those assets increase in value, people are more likely to spend. By the end of last year it was obvious one major asset class -- namely housing -- was decreasing in value. Therefore, the Federal Reserve has to stabilize the value of other asset classes -- here, equities.
Saturday, May 26, 2007
The Rise of Government Wealth Funds and Money Supply
From Barron's (subscription required)
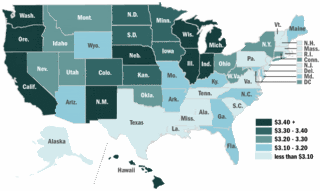
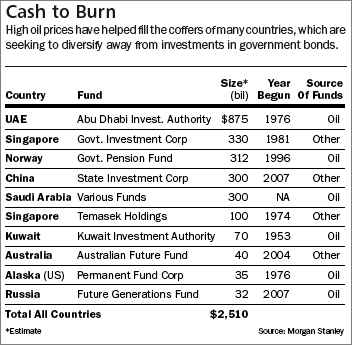
Here is a chart from the article that shows where some of these funds are:
There are several points that come to mind.
1.) Governments are assuming they have sufficient reserves to deal with a currency run. I'm not saying I know they don't. But because governments are looking at increasing wealth through investments, it's possible they are cutting corners to get these investments going.
2.) There's an amusingly socialist/communist angle to this situation. Governments are using capitalist financing to acquire business. So long as the governments remain on the sidelines I don't see any problems. However, if governments start to direct internal business decisions, we'll have the possibility of government run business.
3.) There's a ton of liquidity right now -- I mean a literal flood of currency.
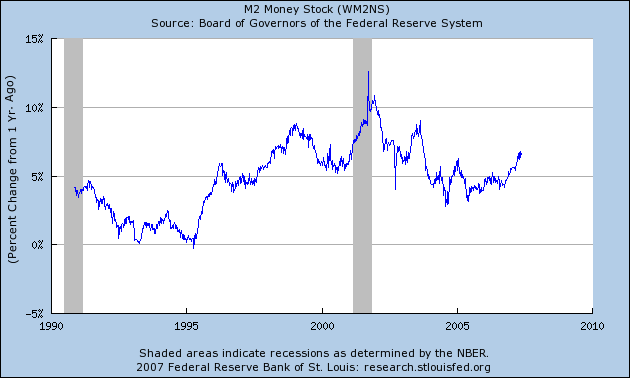
Here's a chart of M2 from the St. Louis Federal Reserve:
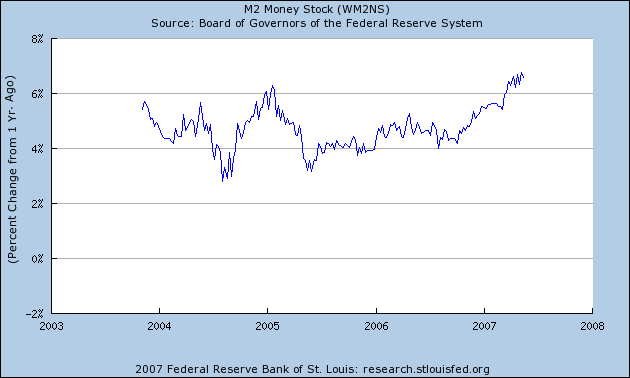
Notice that starting in about 1995, the year-over year change in M2 was about 5%. Notice how there was a flood of liquidity during the recession. Also notice the recent increase in the year-over-year figures that corresponds to the latest stock market rally. Here's a chart of the last few years of growth to give you a better idea.
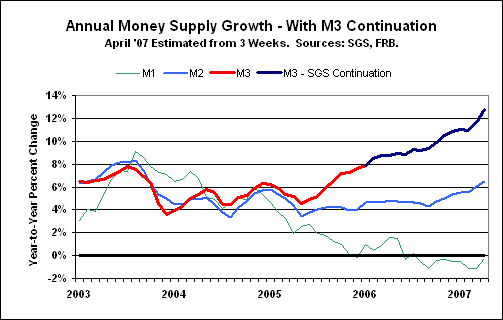
Here is a chart of M3 from the website Shadow Stats. I can't vouch for their methodology, but I present this graph because it's the only source I know of for M3 right now.
So, let's sum up.
1.) Governments are taking some of their excess currency reserves and building investment pools.
2.) Actual money growth is helping to create these pools.
3.) M3 growth -- if the Stadowstats numbers are accurate -- is really helping to build these funds.
This leads to the following questions.
1.) Is the Federal Reserve increasing money supply with the intention of spreading US dollars around the world?
2.) Is the Federal Reserve trying to quietly build these government investment pools with the intention these pools buoy US asset prices? This is especially important as the US economy has become more and more dependent on asset values.
3.) At a time when the Federal Reserve is concerned about inflation, why are they increasing money supply?
Countries like China and Russia think they have sufficient reserves to meet potential runs on their currencies, and have created sovereign wealth funds in a bid to earn higher returns. Increasingly, these and other nations, including the oil-rich United Arab Emirates and Norway, are expected to funnel new money into wealth funds rather than government securities. Jen estimates sovereign wealth funds could match the size of official government reserves by 2
.....
Russia, which was nearly bankrupt a decade ago, is planning to put a chunk of its $357 billion of official reserves into a Future Generations Fund that will invest beyond government securities. That fund could be staked with about $30 billion. South Korea has formed the Korea Investment Corp. with $20 billion, and Australia has launched a $40 billion Australian Future Fund.
There are several reasons for the rapid growth of sovereign wealth funds. High oil prices are filling the coffers of countries like Russia, the Emirates, Saudi Arabia and Norway. Elsewhere, China's enormous trade surplus is producing rapid growth in its dollar reserves as the country seeks to hold down the value of the Chinese currency by purchasing dollars from Chinese exporters.
Here is a chart from the article that shows where some of these funds are:
There are several points that come to mind.
1.) Governments are assuming they have sufficient reserves to deal with a currency run. I'm not saying I know they don't. But because governments are looking at increasing wealth through investments, it's possible they are cutting corners to get these investments going.
2.) There's an amusingly socialist/communist angle to this situation. Governments are using capitalist financing to acquire business. So long as the governments remain on the sidelines I don't see any problems. However, if governments start to direct internal business decisions, we'll have the possibility of government run business.
3.) There's a ton of liquidity right now -- I mean a literal flood of currency.
Here's a chart of M2 from the St. Louis Federal Reserve:
Notice that starting in about 1995, the year-over year change in M2 was about 5%. Notice how there was a flood of liquidity during the recession. Also notice the recent increase in the year-over-year figures that corresponds to the latest stock market rally. Here's a chart of the last few years of growth to give you a better idea.
Here is a chart of M3 from the website Shadow Stats. I can't vouch for their methodology, but I present this graph because it's the only source I know of for M3 right now.
So, let's sum up.
1.) Governments are taking some of their excess currency reserves and building investment pools.
2.) Actual money growth is helping to create these pools.
3.) M3 growth -- if the Stadowstats numbers are accurate -- is really helping to build these funds.
This leads to the following questions.
1.) Is the Federal Reserve increasing money supply with the intention of spreading US dollars around the world?
2.) Is the Federal Reserve trying to quietly build these government investment pools with the intention these pools buoy US asset prices? This is especially important as the US economy has become more and more dependent on asset values.
3.) At a time when the Federal Reserve is concerned about inflation, why are they increasing money supply?
Friday, May 25, 2007
Existing Home Sales Drop
From Bloomberg:
Here's a link to the NAR report.
There are several interesting points in this report, especially compared to yesterday's report.
1.) This report is consistent with all of the earnings releases from the major homebuilders. As I noted yesterday, no homebuilder has issued a positive report. In fact most have refused to give future guidance. Considering the housing market has been dropping for about a year now, you'd think homebuilders would be shouting "reversal" from the rooftops.
2.)According to yesterday's new home sales report, the South saw a jump of 27.8% and the West saw a jump of 8.5%. Yet in today's existing home sales numbers, the south dropped 1.2% and the west dropped 1.7%. The existing home sales market in the west is 5.4 times the size of the new home sales market, while the existing home sales market in the south is 4.24 the new home market.
- Sales of previously owned homes in the U.S. unexpectedly fell in April to the lowest level in almost four years, dimming prospects for a quick recovery in the housing industry.
Purchases fell 2.6 percent to an annual rate of 5.99 million last month from 6.15 million in March, the National Association of Realtors said today in Washington. A measure of the supply of homes for sale rose to the highest since August 1992.
The decline comes a day after a government report showed sales of new homes surged as buyers took advantage of a slide in prices. Today's figures suggest that owners of existing homes may have to cut prices further during the prime spring selling season. The drop also reflects the impact of banks making it tougher to get subprime loans, a response to rising defaults.
``The housing market correction won't be resolved quickly,'' said Kevin Logan, senior market economist at Dresdner Kleinwort in New York. ``Downward pressure on prices will persist and sales will be sluggish for some time.''
Here's a link to the NAR report.
There are several interesting points in this report, especially compared to yesterday's report.
1.) This report is consistent with all of the earnings releases from the major homebuilders. As I noted yesterday, no homebuilder has issued a positive report. In fact most have refused to give future guidance. Considering the housing market has been dropping for about a year now, you'd think homebuilders would be shouting "reversal" from the rooftops.
2.)According to yesterday's new home sales report, the South saw a jump of 27.8% and the West saw a jump of 8.5%. Yet in today's existing home sales numbers, the south dropped 1.2% and the west dropped 1.7%. The existing home sales market in the west is 5.4 times the size of the new home sales market, while the existing home sales market in the south is 4.24 the new home market.
A Map of Gas Prices
Here is a map from the WSJ that shows gas prices around the country. I resized the image to fit on the page. I'm still learning about the whole image thing on he web so the image may be small for some people. So --
1.) Only New Jersey has prices below $3.00/gallon.
2.) The darkest color on the map means prices are over $3.40/gallon.
1.) Only New Jersey has prices below $3.00/gallon.
2.) The darkest color on the map means prices are over $3.40/gallon.
OPEC Won't Increase Production
From the WSJ:
This article highlights an interesting economic situation. The oil market (raw material) and the production market (refining) have "decoupled."
Let's review the US situation.
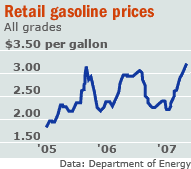
Gas prices have spiked over $3.00/gallon before the beginning of the summer driving season. Prices usually increase during the summer because of increased demand. However, this year we have high prices before the summer begins.
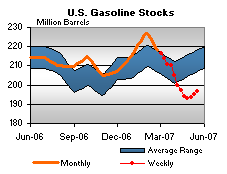
Supplies are down
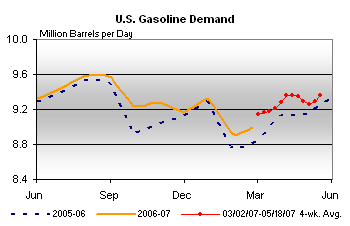
Demand is up:
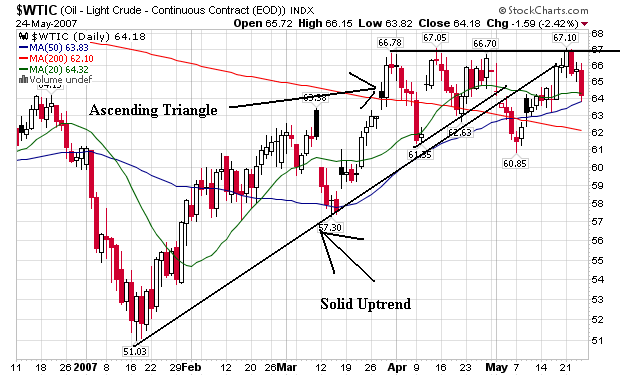
This is a very bullish fundamental scenario. In addition, a few weeks ago we had a very strong technical picture in the oil market. Prices were in a three month long up-trend and prices had formed an ascending triangle formation -- a formation of higher lows indicating upward pressure building on prices.
Yet oil prices dropped a few weeks ago and have again approached $67/barrel only to meet price resistance again.
The raw material of gasoline -- oil -- had two very strong reasons to rally higher yet didn't. Now -- it's possible oil will go higher. That is always a possibility. And prices have not crashed either. However, this statement appears to be very true now.
Two years ago when gasoline prices in the U.S. surged to the then-lofty level of $2 a gallon, the Organization of Petroleum Exporting Countries sprang into action, seeking to provide relief by pledging to boost oil production.
Now, with gasoline topping an average of $3.20 a gallon nationwide, OPEC officials say they see no reason to open the oil spigot wider.
OPEC's new attitude reflects a tug of war in the global oil patch over how the profits from a barrel of oil are divvied up between the world's producers -- which develop oil deposits and pump oil -- and its refiners -- which process it into fuels like gasoline.
In recent years, the balance in the world's oil-supply system has shifted, giving the refining industry more power and more profit.
This time, OPEC says, the world has ample oil supplies. The cartel's members contend gasoline prices have climbed particularly fast in the U.S. because refining capacity is tight, imports from Europe are down, and U.S. inventories have tumbled.
This article highlights an interesting economic situation. The oil market (raw material) and the production market (refining) have "decoupled."
Let's review the US situation.
Gas prices have spiked over $3.00/gallon before the beginning of the summer driving season. Prices usually increase during the summer because of increased demand. However, this year we have high prices before the summer begins.
Supplies are down
Demand is up:
This is a very bullish fundamental scenario. In addition, a few weeks ago we had a very strong technical picture in the oil market. Prices were in a three month long up-trend and prices had formed an ascending triangle formation -- a formation of higher lows indicating upward pressure building on prices.
Yet oil prices dropped a few weeks ago and have again approached $67/barrel only to meet price resistance again.
The raw material of gasoline -- oil -- had two very strong reasons to rally higher yet didn't. Now -- it's possible oil will go higher. That is always a possibility. And prices have not crashed either. However, this statement appears to be very true now.
The cartel's members contend gasoline prices have climbed particularly fast in the U.S. because refining capacity is tight, imports from Europe are down, and U.S. inventories have tumbled.
Thursday, May 24, 2007
Was Today's Market Action A Reversal Day?
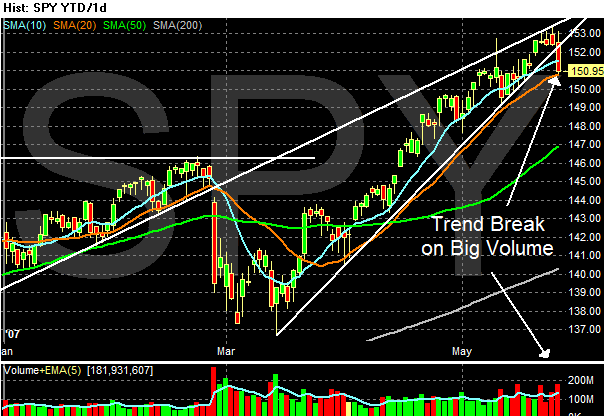
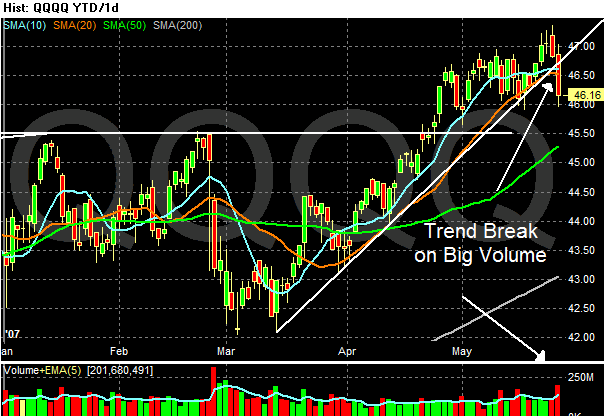
A reversal day occurs when, well, the trend reverses. Key signs are a break of a trend line and high volume. We have both today. The SPYs and the QQQQs broke through their upward trend line on high volume.
The common theme to the market analysis was today's housing and durable goods news implies the Fed may hike rates. I think the markets were simply looking for a reason to sell and found it today.
New Home Sales Increase 16%
From Bloomberg:
Let's add a very important piece of information from the AP:
First -- color me really surprised.
However, let's look a bit deeper at some of the housing news.
Toll brothers reports decline (posted yesterday):
Pulte and Beazer report lower earnings (May 14, 2007):
Hovnanian reports loss (May 7, 2007):
Builders have lower contracts, they call the environment challenging and they refuse to give guidance. There is no mention in any of these reports of a "rebound", or "the worst is over" or similar statements.
In short, today's numbers do not jibe with the latest reports from the industry. In fact, today's report is diametrically opposed to the news we have been hearing from the housing industry
While I am not saying today's report is total bullshit, it does not jibe in any way with the reports the housing companies have consistently reported this earnings season.
Purchases of new homes in the U.S. unexpectedly jumped in April by the most in 14 years, a sign low lending rates and incentives may be reviving demand.
Purchases rose 16 percent to an annual pace of 981,000 last month from an 844,000 rate the prior month that was lower than previously reported, the Commerce Department said in Washington. The supply of unsold homes at the current sales pace dropped.
Lower prices and incentives offered by builders such as Centex Corp. are stirring demand for new homes after two years of falling sales. Still, a glut of unsold properties suggests homebuilding is likely to remain a drag on growth throughout this year and into 2008.
Let's add a very important piece of information from the AP:
However, the median price of a new home sold last month fell to $229,100, a record 11.1 percent decline from the previous month. The big price decline indicated that builders are slashing prices in an effort to move a huge overhang of unsold homes.
First -- color me really surprised.
However, let's look a bit deeper at some of the housing news.
Toll brothers reports decline (posted yesterday):
Second-quarter revenue fell 19 percent to $1.17 billion.
Net contracts were down 25 percent to $1.17 billion. Net of cancellations, contracts totaled 1,647 units, down 24 percent.
The second-quarter cancellation rate was 18.9 percent, down from the prior quarter's rate of 29.8 percent, but still higher than the company's historical average of about 7 percent, Toll said.
"Given the uncertainty surrounding sales paces, and market direction and, thus, the potential for and size of future impairments, we are not comfortable giving full earnings guidance," Chief Financial Officer Joel Rassman said in a statement.
Pulte and Beazer report lower earnings (May 14, 2007):
It became more of the same this week when two more large builders -- Pulte Homes (NYSE: PHM) and Beazer Homes (NYSE: BZH) -- reported first-quarter losses and refused to issue earnings guidance for the current year.
For the quarter, Pulte recorded a net loss of $85.7 million, or $0.33 per share, compared with earnings of $262.6 million, or $1.01 a share, a year ago. With the nation's depressed housing circumstances worsening steadily, the company's revenues declined 37%. All of Pulte's seven regions experienced declining revenues, and all but the Southwest saw net new orders decline.
For its part, Atlanta-based Beazer reported a loss of $1.12 a share, versus $2.35 a share a year ago. The company's closings fell 36% for the quarter to 2,743 units, while its revenues slid 35% to $826.3 million.
"Overall, the homebuilding environment remained challenging during the first quarter of 2007, as elevated inventory levels, combined with weak consumer confidence for housing, continue to place pressure on results," said Richard J. Dugas Jr., Pulte's president and CEO, when he released his company's results.
"Challenging" -- that's a word that builders have been invoking more frequently than Aaron Burr and Alexander Hamilton ever thought to do before their famous duel. Beazer CEO Ian McCarthy took his turn when he described the climate for his company: "We continued to experience extremely challenging operating conditions during our second quarter of fiscal 2007. Most housing markets across the country continue to experience lower levels of demand, coupled with higher levels of inventory, resulting in increased competition and continued significant discounting."
Hovnanian reports loss (May 7, 2007):
On Friday, Hovnanian Enterprises (NYSE: HOV) joined several of its peers in painting a bleak picture of its markets. The homebuilder expects a total loss for the second quarter in the range of $0.45 to $0.50 per share. Of that amount, about $0.30 is expected to occur before land charges, with the remainder related to land impairments and write-offs of predevelopment costs and land deposits.
The company's net contracts for the quarter dipped about 21% to 3,116, but without the especially hard-hit Fort Myers-Cape Coral market, net contract additions would have declined just 17%.
Hovnanian's prerelease follows recent reports from other major builders, including Beazer (NYSE: BZH), Centex (NYSE: CTX), and Pulte (NYSE: PHM), all of which have declined to provide guidance on the rest of the year's results, given the climate for continued soft housing conditions. On Friday, however, Hovnanian said that when it formally releases second-quarter results, "the company expects to update its 2007 guidance to reflect the charges and operating results for the first half of the year and its expectations for the remaining quarters of the year."
Builders have lower contracts, they call the environment challenging and they refuse to give guidance. There is no mention in any of these reports of a "rebound", or "the worst is over" or similar statements.
In short, today's numbers do not jibe with the latest reports from the industry. In fact, today's report is diametrically opposed to the news we have been hearing from the housing industry
While I am not saying today's report is total bullshit, it does not jibe in any way with the reports the housing companies have consistently reported this earnings season.
Durable Goods Orders Surprise On the Upside
From CBS Marketwatch:
Here's a link to the actual report.
There are some really interesting points in the report that should be highlighted.
First, the Census Bureau has a spreadsheet download that has unadjusted totals for 2006 and 2007. This means the Bureau has a "year to date" running total on all the different categories.
Year to date, total new orders including transportation are up .4%, but excluding transportation are down .4%.
Here's where things start to get really interesting. Let's use total new orders of $844,523 million as the denominator in the following calculations.
Primary metals are up 6.8% than the same time last year and they make up 9.67% of all new orders.
Electronic equipment and appliances are up 8.6% from the same time last year and they make 5.26% of total new orders.
Fabricated metal parts are up 1% from their total at this time last year and they comprise 12.40% of total new orders.
Transportation is up 2.2%, but that's because non-defense aircraft and parts are up 26.9%. Auto new orders are down 6.1%.
Computer and electronics parts are down 3% compared to the same totals last year and they make up 11.97% of all new orders.
So what does all of this mean? It's largely a commodities driven durable goods market. My guess is foreign demand is responsible for more than a small share of all these orders -- especially orders from China/India and any other country that is manufacturing goods.
New orders for U.S.-made durable goods increased 0.6% in April, boosted by strong demand for metals, the Commerce Department reported Thursday.
Orders in March rose a revised 5%, a six-month high, compared with a 4.3% estimate previously.
Demand in April was held back by a 10.7% drop in orders for civilian airplanes, where new orders had doubled in the previous two months. Excluding the extremely volatile transportation category, orders were up 1.5% in April, identical to the increase in March.
Orders for core capital equipment goods - the best monthly gauge of business investment - rose 1.2% after a 4.4% gain in March.
Here's a link to the actual report.
There are some really interesting points in the report that should be highlighted.
First, the Census Bureau has a spreadsheet download that has unadjusted totals for 2006 and 2007. This means the Bureau has a "year to date" running total on all the different categories.
Year to date, total new orders including transportation are up .4%, but excluding transportation are down .4%.
Here's where things start to get really interesting. Let's use total new orders of $844,523 million as the denominator in the following calculations.
Primary metals are up 6.8% than the same time last year and they make up 9.67% of all new orders.
Electronic equipment and appliances are up 8.6% from the same time last year and they make 5.26% of total new orders.
Fabricated metal parts are up 1% from their total at this time last year and they comprise 12.40% of total new orders.
Transportation is up 2.2%, but that's because non-defense aircraft and parts are up 26.9%. Auto new orders are down 6.1%.
Computer and electronics parts are down 3% compared to the same totals last year and they make up 11.97% of all new orders.
So what does all of this mean? It's largely a commodities driven durable goods market. My guess is foreign demand is responsible for more than a small share of all these orders -- especially orders from China/India and any other country that is manufacturing goods.
Problems With the Employment Numbers?
From the WSJ:
Let me caution here: the primary reason for the disparity is based on statistical sampling which is not my strong suit. I'm good at explaining final numbers, not generating the numbers used in analysis. Now that we have that caveat out of the way:
There has been a lot of discussion about the employment reports this economic cycle. The discussions have centered on a few problems:
1.) The birth/death model. The BLS uses a model (called the birth/death model) that attempts to account for new businesses that aren't in their employment sample and businesses that go out of business whose closing is not reflected in the final employment numbers. I can't speak for the veracity of this analysis, but it has come under fire from several commentators.
2.) The continual revisions of the jobs numbers. The BLS has continually recalculated the monthly figures, making the initial release an almost moot points. In addition, the BLS magically found about 800,000 jobs in an annual revision last year. The point is there appears to be a pretty big problem with the way BLS is conducting business. There is always a certain amount of lee-way with economic numbers and analysis. However, the size of the revisions have led some people (myself included) to question the way BLS does business.
There have been several articles lately which noted the divergence between the overall growth rate (1.3%) and the continued low unemployment rate. These two numbers just don't add up from an analysis perspective. Usually every economic cycle creates analytical problems because (surprise) reality does not add up like economic models say they should. This cycles are not more pronounced than other cycles. But the divergence between theory and reality has emerged again.
• The News: Recent signs indicate the job market may be weaker than monthly data show, particularly in construction.
• The Background: The economy has slowed, but job growth has remained robust.
• The Upshot: The cause of the statistical disparity remains something of a puzzle.
Let me caution here: the primary reason for the disparity is based on statistical sampling which is not my strong suit. I'm good at explaining final numbers, not generating the numbers used in analysis. Now that we have that caveat out of the way:
Those signs are particularly stark in the home-building industry, which has been hurt by the slump in the housing market. Housing starts in April fell 33% from their recent peak in January 2006. Yet, the number of residential-construction jobs has dropped by only about 3% over the same period.
Economists cite several possible explanations for the disparity. One is that layoffs have lagged behind the housing slump and will weaken further.
In addition, some economists say the monthly figures from the Labor Department's Bureau of Labor Statistics may be overestimating employment, perhaps by misclassifying construction workers or by failing to count large numbers of laid-off illegal immigrants.
The bureau releases two monthly employment figures: the unemployment rate, which is based on a household survey, and a tally of nonfarm payrolls, based on a survey of employers. Both are conducted through sampling and depend on voluntary responses.
A lesser-known employment snapshot, based on a quarterly census of state unemployment insurance records, shows the economy created about 19,000 private-sector jobs in the third quarter of 2006, the most recent data available. That contrasts with the 500,000 indicated in the monthly figures for that period. It also shows the number of construction jobs dropped by 77,000, in contrast with the increase of 19,000 jobs shown in the monthly surveys.
The data suggest that "maybe the labor market behaved a little more like we thought it should in times of a slowing economy," said Michael Feroli, an economist at J.P. Morgan Chase & Co.
There has been a lot of discussion about the employment reports this economic cycle. The discussions have centered on a few problems:
1.) The birth/death model. The BLS uses a model (called the birth/death model) that attempts to account for new businesses that aren't in their employment sample and businesses that go out of business whose closing is not reflected in the final employment numbers. I can't speak for the veracity of this analysis, but it has come under fire from several commentators.
2.) The continual revisions of the jobs numbers. The BLS has continually recalculated the monthly figures, making the initial release an almost moot points. In addition, the BLS magically found about 800,000 jobs in an annual revision last year. The point is there appears to be a pretty big problem with the way BLS is conducting business. There is always a certain amount of lee-way with economic numbers and analysis. However, the size of the revisions have led some people (myself included) to question the way BLS does business.
There have been several articles lately which noted the divergence between the overall growth rate (1.3%) and the continued low unemployment rate. These two numbers just don't add up from an analysis perspective. Usually every economic cycle creates analytical problems because (surprise) reality does not add up like economic models say they should. This cycles are not more pronounced than other cycles. But the divergence between theory and reality has emerged again.
Toll Brother's Net Drops
From the WSJ:
Some of this loss is accounting -- lowering the value of assets on the balance sheet. My guess is Toll brothers is reporting as much bad news as possible to "get it out of the way."
However, the drop in revenue and contracts signed indicates one glaring fact: the housing market is still very weak.
The luxury-home builder's earnings fell to $36.7 million, or 22 cents a share, from $174.9 million, or $1.06 a share, a year earlier. Analysts polled by Thomson Financial expected, on average, earnings of 25 cents a share.
The company said earlier this month it expected a second-quarter profit, but said it wouldn't meet its prior outlook of 43 cents to 57 cents a share. Write-downs lowered earnings by 44 cents a share, compared with just four cents a share a year earlier.
Revenue for the quarter ended April 30 fell 23% to $1.17 billion from $1.44 billion a year earlier. Analysts were looking for $1.12 billion.
Fiscal second-quarter net signed contracts fell 25% to $1.17 billion from $1.56 billion a year earlier. The company signed 2,031 contracts before cancellations in the period, down 14%. Toll Brothers reported earlier in May that second-quarter net orders fell 24% to 1,647.
Some of this loss is accounting -- lowering the value of assets on the balance sheet. My guess is Toll brothers is reporting as much bad news as possible to "get it out of the way."
However, the drop in revenue and contracts signed indicates one glaring fact: the housing market is still very weak.
Wednesday, May 23, 2007
Gas Prices Up Nearly 50% Since January
From CBS Marketwatch:
Here is a chart from the same article. Notice that prices usually spike mid-year. However, this year year prices are spiking significantly earlier.
This Week in Petroleum also noticed this trend in the latest report:
The main reason for increased prices is a drop in inventories:
Coupled with increased demand:
Notice that demand this year is higher than last year.
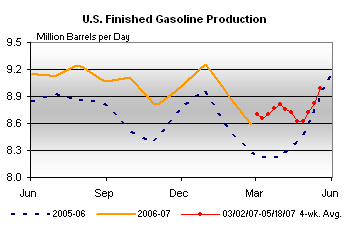
The good news is gas production has increased over the last few weeks.
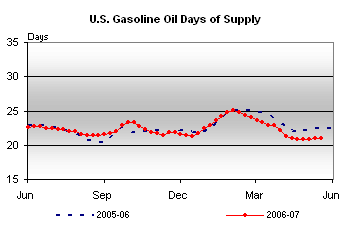
However, the days of supply are lower than last years.
Putting all of these factors together -- decreased supply + increased demand -- and you get higher prices.
Now the question becomes will production increase sufficiently to lower prices?
Average retail gas prices jumped by 12 cents to a record $3.26 a gallon last week, the Energy Department reported Monday. Gas prices are up nearly 50% since late January, one of the largest sustained increases ever recorded by the government.
Here is a chart from the same article. Notice that prices usually spike mid-year. However, this year year prices are spiking significantly earlier.
This Week in Petroleum also noticed this trend in the latest report:
:For the fourth consecutive week, gasoline prices were up, increasing 11.5 cents to 321.8 cents per gallon as of May 21, 2007. Prices are 32.6 cents per gallon higher than this time last year and have now reached an all-time nominal high for the second week in a row. All regions, except for the West Coast, reported price increases. East Coast prices were up 11.6 cents to 309.7 cents per gallon. In the Midwest, prices jumped 15.4 cents to 332.6 cents per gallon, while prices for the Gulf Coast rose 17.7 cents to 309.2 cents per gallon. The Rocky Mountains saw prices increase 7.2 cents to 326.5 cents per gallon. West Coast prices were down 0.6 cent to 337.2 cents per gallon. The average price for regular grade in California was down 1.4 cents to 343.6 cents per gallon, but remains 11.3 cents per gallon above last year's price.
The main reason for increased prices is a drop in inventories:
Coupled with increased demand:
Notice that demand this year is higher than last year.
The good news is gas production has increased over the last few weeks.
However, the days of supply are lower than last years.
Putting all of these factors together -- decreased supply + increased demand -- and you get higher prices.
Now the question becomes will production increase sufficiently to lower prices?
More Retail News
From Yesterday's retail sector market brief at CBS Marketwatch:
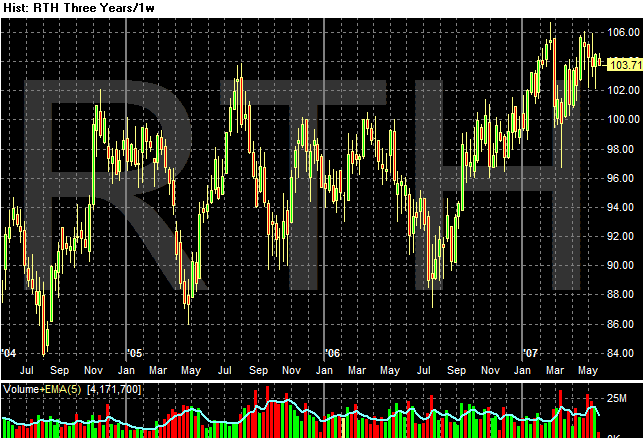
Here's a three year chart of the Retail Holders Trust -- the retail ETF. It's trading at the top of its three year range, indicating traders are still bullish on the retail sector.
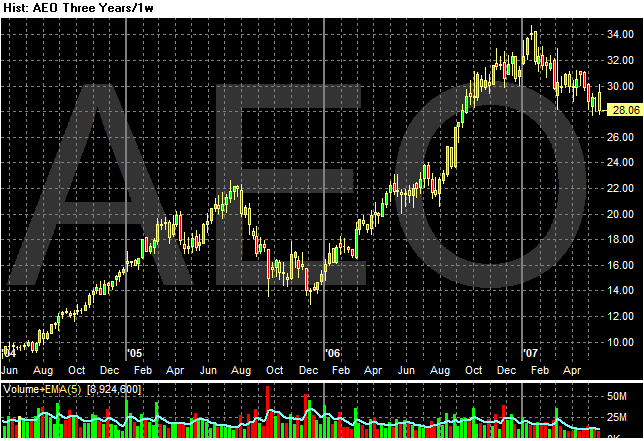
American Eagle Outfitter is trading off its highs, but is still doing well.
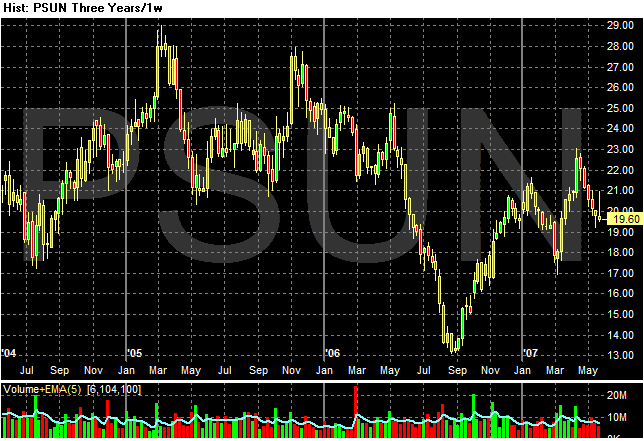
Pacific Sunwear has bounced off its recent lows.
Short version: the general retail sector still looks strong from a market perspective, although traders are willing to sell stocks they think will under perform in the sector.
Elsewhere, shares of American Eagle Outfitters (fell 4.3% to $28.06. American Eagle offered a second-quarter forecast that fell short of Wall Street's expectations, sending the shares lower. The teen-wear retailer is looking at second-quarter per-share profit of 34 cents to 36 cents, compared with the 37 cents per share average estimate reached by analysts reporting to Thomson Financial.
Shares of Pacific Sunwear of California also fell, closing at $19.60, off 2.2%. Late Monday, the retailer reported a first-quarter loss and said its second quarter should produce a profit in a range of 18 cents per share to 20 cents per share.
Here's a three year chart of the Retail Holders Trust -- the retail ETF. It's trading at the top of its three year range, indicating traders are still bullish on the retail sector.
American Eagle Outfitter is trading off its highs, but is still doing well.
Pacific Sunwear has bounced off its recent lows.
Short version: the general retail sector still looks strong from a market perspective, although traders are willing to sell stocks they think will under perform in the sector.
Would a Yuan Devaluation Really Help the Trade Deficit?
From IBD:
I've seen various opinions on this matter, but I tend to agree with the above statement. The real issue is the US consumes more than it produces. That is what the trade deficit really represents. I wrote an article dealing with outsourcing that came to the same conclusion: so long as the US buys cheap stuff, we're going to outsource manufacturing to places where it's cheaper to make stuff.
However, I think it's important to realize where this might lead. To quote Paul Volcker from an article he wrote two years ago (and which is still very relevant):
But most economists say a big yuan revaluation wouldn't have a major impact on trade.
As long as Americans spend more than they save and the Chinese continue to save at high rates, the trade deficit will endure.
"To achieve any meaningful change in trade flows, you need a reduction in (spending) by countries that spend more than their income and expenditure increases in countries that spend less than their income," said Nouriel Roubini of Roubini Global Economics. "Changes in relative prices are not by themselves sufficient."
America's trade gap with China hit $235 billion last year.
I've seen various opinions on this matter, but I tend to agree with the above statement. The real issue is the US consumes more than it produces. That is what the trade deficit really represents. I wrote an article dealing with outsourcing that came to the same conclusion: so long as the US buys cheap stuff, we're going to outsource manufacturing to places where it's cheaper to make stuff.
However, I think it's important to realize where this might lead. To quote Paul Volcker from an article he wrote two years ago (and which is still very relevant):
The difficulty is that this seemingly comfortable pattern can't go on indefinitely. I don't know of any country that has managed to consume and invest 6 percent more than it produces for long. The United States is absorbing about 80 percent of the net flow of international capital. And at some point, both central banks and private institutions will have their fill of dollars.
Tuesday, May 22, 2007
Gas Hits A New Record
From CNN
Need I say anything more?
Gasoline prices broke a record Tuesday for the 10th day in a row as every state except for New Jersey now has an average price above the $3 a gallon mark in AAA's daily survey.
The latest reading from the motorist group Tuesday showed the nationwide average for a gallon of regular unleaded hit $3.209 a gallon, up from $3.196 on Monday. The group's survey of 85,000 gas stations, by far the broadest sampling of gas prices, has been showing a series of record high prices starting May 13.
Need I say anything more?
Fed's Lacker Is Concerned About Inflation
From CNBC:
I have to admit, the following statement made me laugh.
Obviously, Lacker wasn't aware that Wal-Mart had a big sales decline recently, which they attributed in part to higher gas prices.
In addition, the average consumer probably isn't thinking relative prices when they fill up at the pump. What they are thinking about is "this is getting pretty expensive."
Any questions? I've been adamant in my stance that the Fed won't lower interest rates anytime soon. While the economy is growing below it's full potential, the inflation rate is still higher than the Fed wants it to be. As a result, don't expect a rate cut anytime soon.
However, Lacker, one of the Fed's toughest inflation hawks, said he'd like to see the inflation rate come down a bit more. Although he is not a voting member of the Fed this year, Lacker dissented four times last year from the majority at the Fed who wanted to keep interest rates unchanged instead of raising them.
“I don’t think the moderation we’ve seen is statistically significant,” he said. “The core inflation has been fluctuating between 2% and 2.5% for two years now and before that from 1996 through 2003, core inflation was between 1% and 2%. We need to get back to containing core inflation between 1% and 2%.”
I have to admit, the following statement made me laugh.
Still, the Fed official believes the economy and consumers can handle higher gasoline prices. He said his major concern is that the public has become “conditioned” to the idea that higher oil and gasoline prices equal higher inflation.
“That does not have to be true," he said. "It is a matter of relative price changes that go on all the time in a healthy economy. Lacker said he was worried that rising gasoline prices will prompt an uptick in inflation expectations.
Obviously, Lacker wasn't aware that Wal-Mart had a big sales decline recently, which they attributed in part to higher gas prices.
In addition, the average consumer probably isn't thinking relative prices when they fill up at the pump. What they are thinking about is "this is getting pretty expensive."
Any questions? I've been adamant in my stance that the Fed won't lower interest rates anytime soon. While the economy is growing below it's full potential, the inflation rate is still higher than the Fed wants it to be. As a result, don't expect a rate cut anytime soon.
Retail Snapshot
With gas prices hitting a record and the housing market still in a slump, it's important to keep an eye on some of the areas that may be negatively impacted such as retail. Wal-Mart is the largest retailer in the US by a wide margin, so keeping as eye on the daily news is very important. But there are other retailers to watch as well.
Lowe's reports lower earnings.
The central issue here is housing. The other points are pure noise and deflection. Home Depot had the same market and the same set of problems.
Target sales drop
Target has been successful at taking customers away from Wal-Mart. However, Target's performance this month is not that impressive and falls in line with Wal-Mart's results.
JC Penney surprises on the upside.
JC Penney has completely turned themselves around and are doing a great overall job. Now -- can they keep it up in the current environment? We'll have to see.
Lowe's reports lower earnings.
Lowe's Cos. reported a 12% fall in first-quarter profit Monday as the housing slump and tough comparisons sawed into the home-improvement retailer's bottom line.
Multiple factors, including a difficult housing market in many areas, tough comparisons to hurricane rebuilding efforts and significant lumber and plywood-price deflation continued to create a challenging sales environment in the first quarter," said Robert Niblock, Lowe's chief executive, in the earnings report. "Those anticipated factors were compounded by mixed weather during the quarter."
The central issue here is housing. The other points are pure noise and deflection. Home Depot had the same market and the same set of problems.
Target sales drop
Target's same-store sales fell 6.1% in April. The average estimate of analysts polled by Thomson Financial called for a decrease of 6.2% for the month. Net retail sales fell 1.8% in the period to $3.9 billion from $3.97 billion a year earlier.
The Minneapolis-based general-merchandise retailer cited a sales shortfall in the first two weeks of April for the lackluster results. It forecast May same-store-sales growth in a range of 5% to 7%. In the May period a year earlier, Target's same-store sales increased 5.7%.
Target has been successful at taking customers away from Wal-Mart. However, Target's performance this month is not that impressive and falls in line with Wal-Mart's results.
JC Penney surprises on the upside.
The moderate-priced department-store chain has been on a tear in recent months, introducing new private-label and designer lines found only at Penney stores. It has brought out Ambrielle lingerie, the largest private-brand launch in its history, as well as Liz & Co. and Concepts by Claiborne. It is on track to launch the American Living collection of apparel and home goods by Polo Ralph Lauren and is stepping up its rollout of Sephora cosmetics counters on its sales floors.
All that helped boost Penney's (profit to $238 million, or $1.04 a share, compared with last year's income of $210 million or 89 cents a share.
JC Penney has completely turned themselves around and are doing a great overall job. Now -- can they keep it up in the current environment? We'll have to see.
Credit Is Still Cheap
From CNBC:
So this year's pace is on track to tie a record year in buyouts -- which occurred at the end of a stock market bubble.
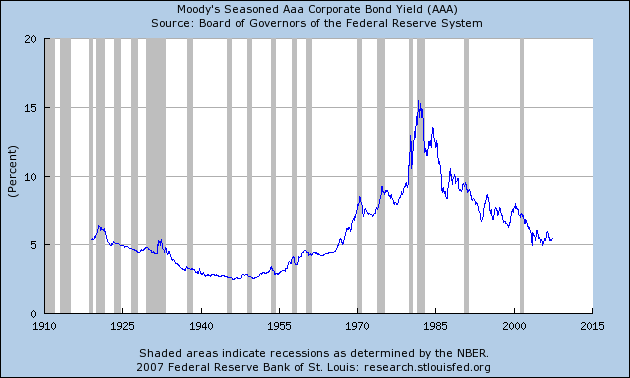
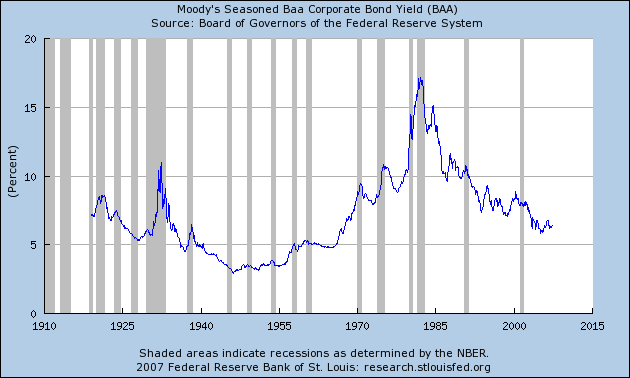
Right now credit is cheap. Below are charts of AAA and Baa credit from the St. Louis Federal Reserve. Notice that interest rates are still low by historical standards.
As of mid-May, total M&A activity world-wide totaled about $2.19 trillion, compared with the record $3.87 trillion for all of 2006, according to Dealogic. In the U.S. M&A activity totaled $717.37 billion through May 16, on pace with last year’s $1.49 trillion. Both are shy of 1999 and 2000, when activity topped $1.5 trillion in each year.
Private-equity buyouts have totaled $218.7 billion so far this year, compared with $421.56 billion last year and $53.9 billion in 2000.
So far this year, buyouts represent 30% of the the total value of all U.S. deals, slightly ahead of last year's pace, and about 14% of all mergers.
So this year's pace is on track to tie a record year in buyouts -- which occurred at the end of a stock market bubble.
“It will end,” Steve Rattner, managing principal of Quadrangle Group, told CNBC’s “Power Lunch” recently. “We are in a credit bubble. Credit is an over-valued commodity at the moment. The lenders are not getting compensated relative to the risks they are taking and at some point that will change. Right now, the default rates are at historic lows and that will also change. When it all changes, we’ll get back to some kind of norm."
Right now credit is cheap. Below are charts of AAA and Baa credit from the St. Louis Federal Reserve. Notice that interest rates are still low by historical standards.
Fed's Moscow Wants Lower Inflation
From Reuters:
This was brought to you by the guy who has been saying for the last 6-9 months the Fed isn't going to lower rates anytime soon.
Moskow noted that core inflation is still running above the 1 percent to 2 percent range that some policy-makers, including himself, see as an informal comfort zone.
"I'd like to see inflation rates running lower at this point and more toward the center of that zone," he said.
This was brought to you by the guy who has been saying for the last 6-9 months the Fed isn't going to lower rates anytime soon.
Monday, May 21, 2007
Gas Hits A New Record
From the Atlanta Journal Constitution
How long until this starts to impact consumer spending? I don't have a clear answer, but when gas prices hit records in May the picture isn't that good.
As a rough rule, every penny increase in gas prices lowers consumer spending by $1.3 billion.
The average price of self-serve regular gasoline hit a record high of $3.18, rising more than 11 cents over the past two weeks, according to a nationwide survey released Sunday.
The latest figure topped the record of $3.07 set two weeks ago, which had been the highest price since the average cost of a gallon of gas hit $3.03 on Aug. 11, 2006, according to the Lundberg Survey of 7,000 gas stations across the country.
How long until this starts to impact consumer spending? I don't have a clear answer, but when gas prices hit records in May the picture isn't that good.
As a rough rule, every penny increase in gas prices lowers consumer spending by $1.3 billion.
When Will the Buy-Out Splurge End?
There was an article in the print version of Barron's this week. I can't find it online, but wanted to give credit where it is due. The author was discussing when the buy-out mania currently gripping the markets would end. He made the following points.
1.) When the sheer size of the deals becomes astronomical. So far the size of the deals has been pretty contained, especially considering the strength of corporate balance sheets. There are two recent deals that do raise flags. The first was Newscorp's bid for Dow Jones. The thinking here is Newscorp was making a bid so large it would fend off all possible competition. However, the bid was way over the asking price as expressed by the share price of Dow Jones. The second was the recent Microsoft deal when they bid an 80%+ premium for an online ad company. Microsoft is a cash rich company, so they have the money to throw around. But, they could have bid a 50% premium at most and probably gotten the deal. My guess is they were using the same logic as New Corp was in the Dow Jones deal -- putting a bid in play that was so large it would fend of rivals. In addition, several competitors successfully purchased other online ad companies, so Microsoft may have simply wanted to get in while the getting was good. However, the premium does raise a bit of a flag.
2.) When diversification starts to really stretch the imagination. So far the announced deals pretty much make sense. For example, the web companies are clearly moving into the ad area, aluminum companies are buying other aluminum companies etc... When we start to see mergers that strain business sense -- an aluminum company with a newspaper -- then we'll start to think the merger boom has gone too far.
Will Business Investment Pull the US From the Brink of Recession?
An article in today's Wall Street Journal makes this case, based on the following points.
As the economy has become more technologically sophisticated the inventory to sales ratio has become less important. In other words, companies don't have to have as much product on hand to be successful. That means low inventory levels are the norm. While the inventory draw-down is good, I don't think it has the same predictive power as before.
However, the recent industrial production figures showed a marked increase from the previous month's levels giving this point more credence.
The problem with this point is business was cash rich through the last two quarters. According to the Flow of Funds report corporations are the only economic sector that has contributed to national savings over the last 5 years. In other words, business already had the money to invest and didn't.
This is the strongest point in the article. A look at the earnings reports from the latest quarter show that companies with strong international exposure did well. The continued projected weakness of the dollar will most likely continue this scenario for the foreseeable future.
As with all matters economic, we'll have to wait and see how this plays out. However, the author does make some good points that provide excellent food for thought.
As the economy cooled last year, many companies found themselves with excess stock, particularly home builders, car makers and the suppliers that depend on them. The result was a sharp pullback in inventory accumulation that now appears to be over, a development that portends production increases. Business inventories declined in March. Although still 4.8% above year-earlier levels, they were 7.7% above year-earlier levels in August. Inventories in the languishing auto industry are running 2.7% below year-earlier levels, the U.S. Commerce Department says.
As the economy has become more technologically sophisticated the inventory to sales ratio has become less important. In other words, companies don't have to have as much product on hand to be successful. That means low inventory levels are the norm. While the inventory draw-down is good, I don't think it has the same predictive power as before.
However, the recent industrial production figures showed a marked increase from the previous month's levels giving this point more credence.
But so far this year, profit growth hasn't sagged quite as much as some anticipated, leaving many businesses with hoards of cash they can steer to capital purchases if the mood strikes. Noting plans by cable companies and telecommunications firms to increase capital spending, Federal Reserve governor Frederic Mishkin last month predicted a rebound in business investment this year. "Business balance sheets are strong, and although profits have slowed, profit margins remain elevated," Mr. Mishkin said. "The continuation of a moderate economic expansion is likely over time to restore confidence and lead to a firming in business investment."
The problem with this point is business was cash rich through the last two quarters. According to the Flow of Funds report corporations are the only economic sector that has contributed to national savings over the last 5 years. In other words, business already had the money to invest and didn't.
Strong global growth together with the recent weakness of the dollar have created what should be an excellent climate for U.S. exporters. Most economists chalk up the decline in exports in the first quarter to a statistical fluke that will soon be undone.
This is the strongest point in the article. A look at the earnings reports from the latest quarter show that companies with strong international exposure did well. The continued projected weakness of the dollar will most likely continue this scenario for the foreseeable future.
As with all matters economic, we'll have to wait and see how this plays out. However, the author does make some good points that provide excellent food for thought.
An Ugly Chart
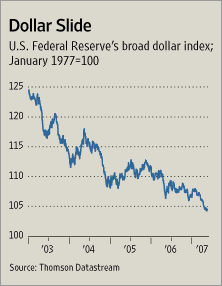
Here is a long-term dollar chart from the Wall Street Journal. The article dealt with a different topic. I simply wanted to put up this chart to show what the dollar chart looks like right now. It's not a pretty picture.
Sunday, May 20, 2007
The Markets Through a P&F Lense
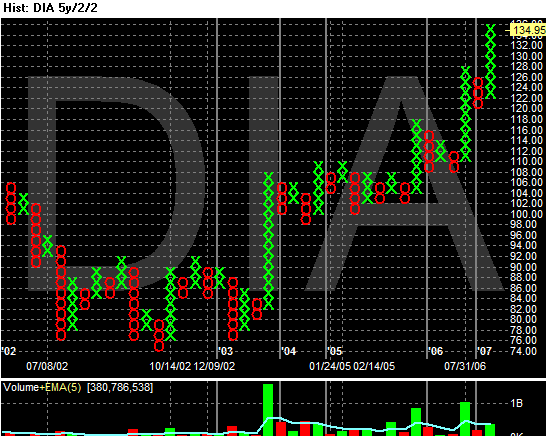
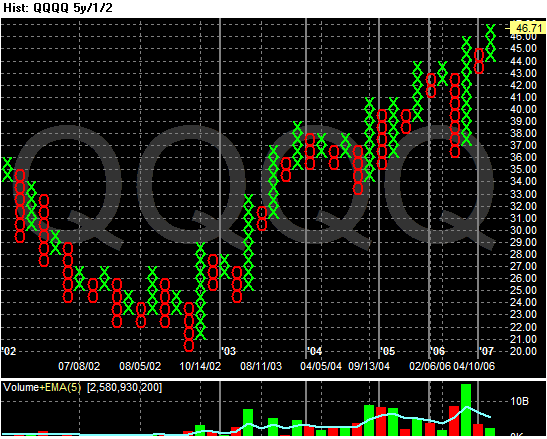
For those of you who are unfamiliar with P&F charts, I would highly recommend you start to get acquainted. These charts allow you to filter out a great deal of extraneous market noise and focus solely on the big price movement. This helps to get a solid picture of the market's general trend.
All three of these charts say the same thing: the market is in a bull phase. Also notice the cumulative volume on the up moves (market with the green x's) is higher than the volume of the price declines.
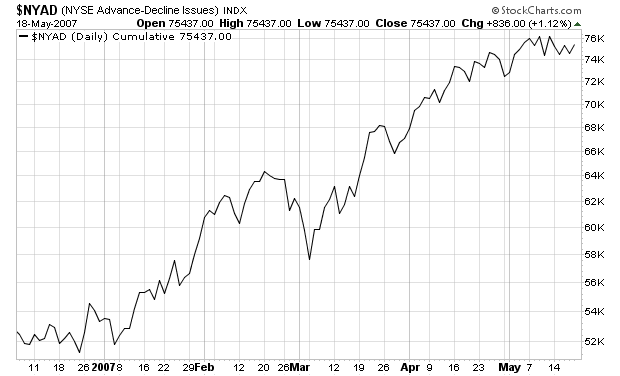
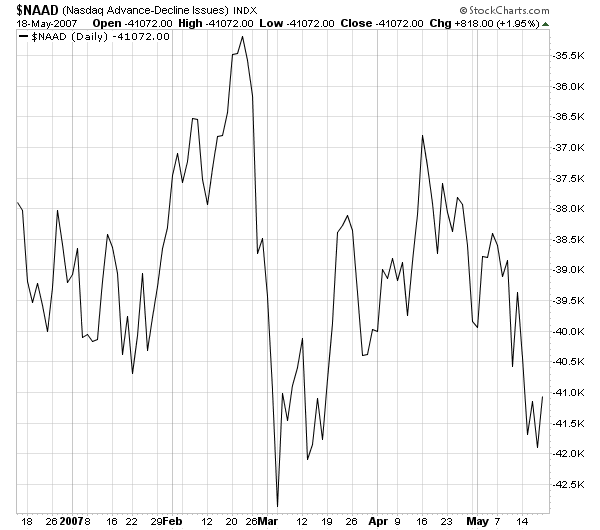
However, the NY and NASDAQ advance/decline lines aren't looking that strong right now.
Despite the new highs on the Dow for what seems like forever, the Advance decline line is in a range for most of May. The NASDAQ advance decline line is declining. Both of these charts indicate the market's recent advance is on shaky ground and a pullback should be surprising.
Bonddad's Back
I'm back from a wonderful three days in San Diego. I would like to thank the Britt Scripps Inn for their wonderful accommodations, the San Diego Zoo, the Museum of Photographic Arts, Old Town San Diego and the Sicilian Festival for a wonderful time.
Bonddad's amazing girlfriend found the Britt Scripps Inn, and she gets many kudos and much praise for the find.
I feel rested and rejuvenated and ready to tackle the market and my law practice. It's amazing what a few days can do.
Bonddad's amazing girlfriend found the Britt Scripps Inn, and she gets many kudos and much praise for the find.
I feel rested and rejuvenated and ready to tackle the market and my law practice. It's amazing what a few days can do.
Subscribe to:
Posts (Atom)