It's that time of the week. It's time to stop thinking about the markets and the economy. Here are some pictures of the kids.
Also -- starting next week there will be some different thing here, so keep you eyes open.
Friday, April 25, 2008
If Tech Companies Are Beating Earnings, Why Isn't NASDAQ Breadth Improving?
Now, consider these points which I posted yesterday:
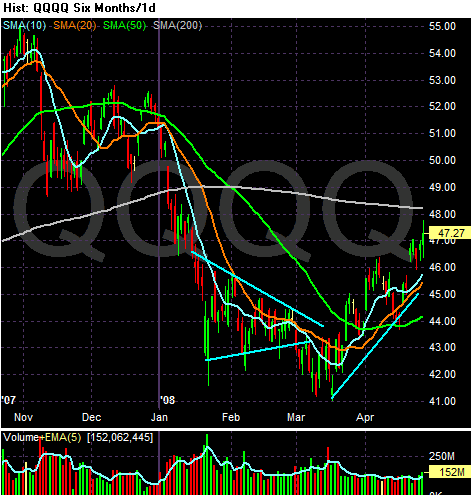
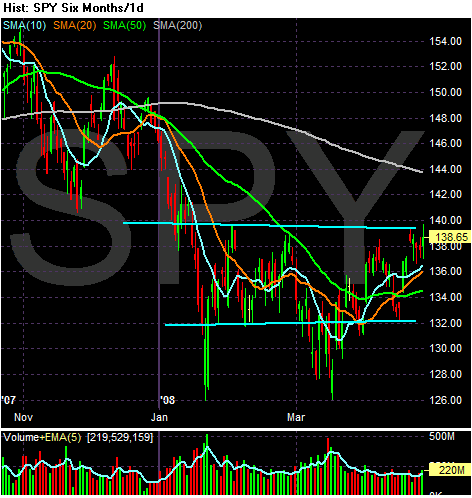
This is the chart that originally caught my attention a few weeks ago. It led me to believe we may be in the middle of a turnaround. Notice the following:
-- Prices have increased almost 10% since mid-March
-- Prices are above the shorter SMAs
-- The shorter SMAs are above the longer SMAs
-- All the shorter SMAs (10, 20 and 50) are moving higher.
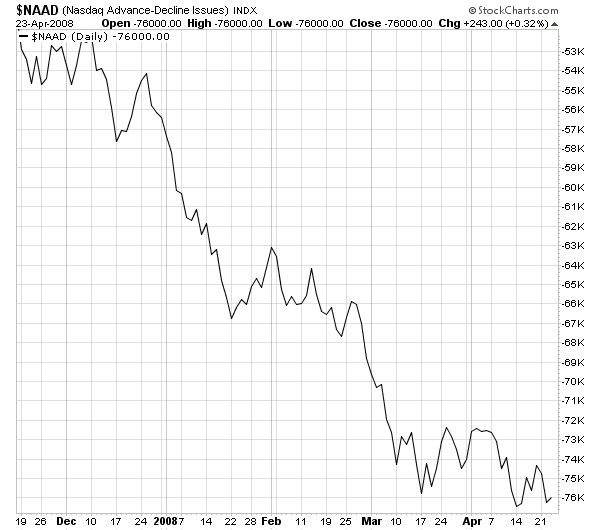
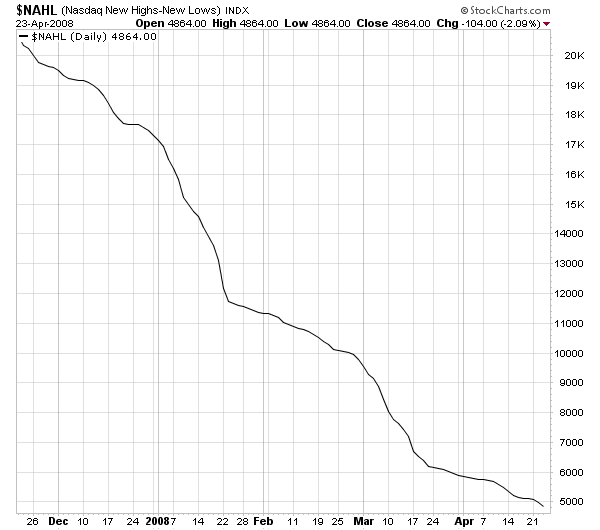
There is one problem with the rally theory. Market breadth on the NASDAQ stinks:
Market breadth hasn't moved higher with the market, and
The new highs/new low number has been decreasing as well.
Why isn't NASDAQ breadth improving? Fundamentally it should be.
All You Need to Know About New Home Sales
From the WSJ:
Short version: supply and demand are still horribly mismatched. That means prices:
Are coming down further.
Consider this quote from the same article:
We're nowhere near the end of the mess in housing.
The bottom of the market doesn't appear in sight, given that the supply of homes for sale soared to 11 months, the highest in almost three decades. The average price and median price for a new home fell at double-digit rates from a year ago.
Short version: supply and demand are still horribly mismatched. That means prices:
Are coming down further.
Consider this quote from the same article:
While the sales data are subject to monthly volatility, "this is just gruesome and leaves no other conclusion than that the downturn in the U.S. housing market is still in full swing," ING Bank economist Dimitry Fleming wrote in a research note.
We're nowhere near the end of the mess in housing.
Consumers Looking to Cut Their Spending
From the AP:
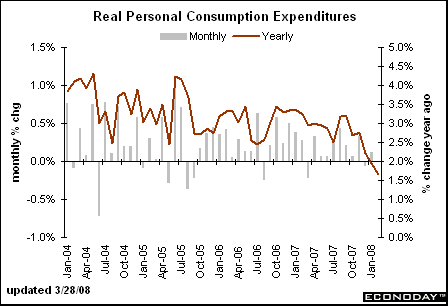
This should come as no surprise to anyone, given the current economic environment. However, let's look at the chain of events that led to this situation.
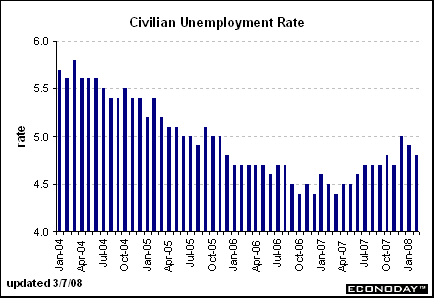
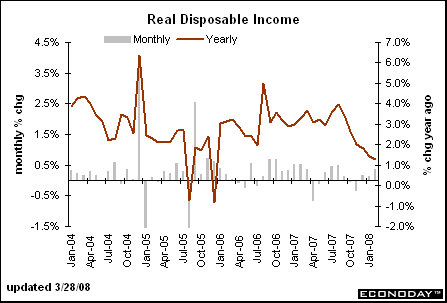
job growth has been dropping for awhile,
unemployment has been ticking up (although it is still at low levels), which leads to
declining personal income, which leads to
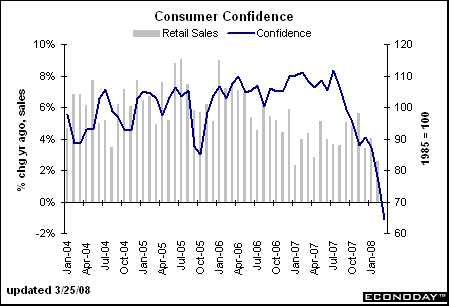
Declining consumer confidence
Let's not forget that gas and diesel prices at the pump are really high
All of this leads to
Declining personal consumption expenditures
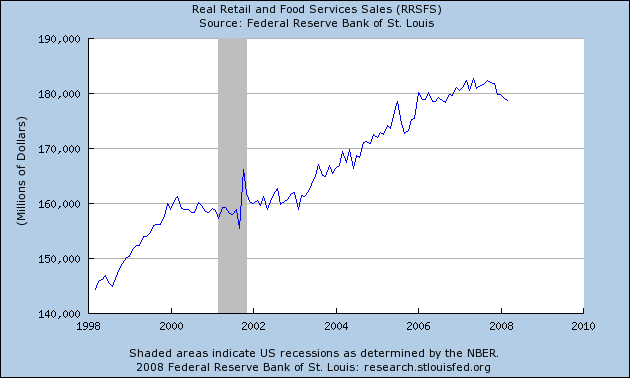
But also note that retail sales have not been rising strongly for about he last year and a half
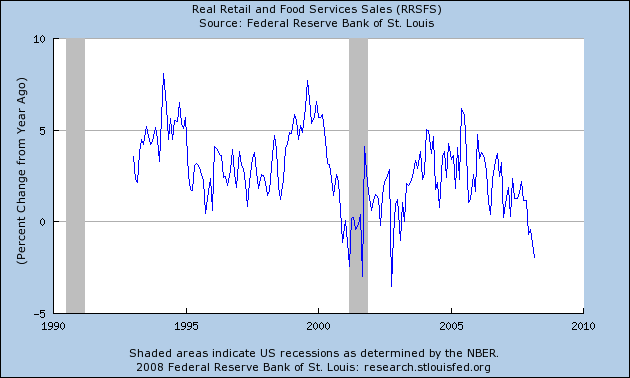
And the real year-over-year change is in fact negative now.
ixty percent of the public say they are now less comfortable about making a a big-ticket financial commitment, such as buying a home or a car, than they were just six months ago, underscoring their more circumspect behavior, according to the RBC Cash poll conducted by Ipsos, an international polling firm, in early April. A year ago, 48 percent said they were less comfortable about making a major purchase.
"I'm feeling more cautious about buying a house. We were thinking about that, but we'll be waiting a little bit longer than we otherwise would have," says Rockwell, 53, a homemaker in Baltimore, Md. She described the current economic climate as being fraught with insecurity. "A larger number of people are really hurting and even people fairly well off are feeling insecure," she says.
BIGresearch, a firm that tracks consumer behavior, said 53.6 percent of people they polled focused more on what they needed, rather than what they wanted, during their shopping trips over the last six months.
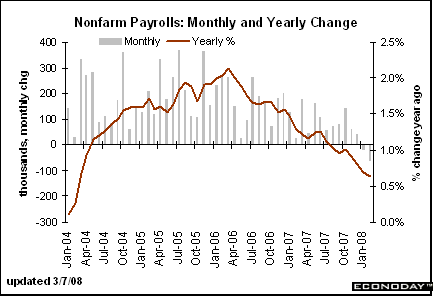
This should come as no surprise to anyone, given the current economic environment. However, let's look at the chain of events that led to this situation.
job growth has been dropping for awhile,
unemployment has been ticking up (although it is still at low levels), which leads to
declining personal income, which leads to
Declining consumer confidence
Let's not forget that gas and diesel prices at the pump are really high
All of this leads to
Declining personal consumption expenditures
But also note that retail sales have not been rising strongly for about he last year and a half
And the real year-over-year change is in fact negative now.
Thursday, April 24, 2008
Today's Markets
This is the chart that originally caught my attention a few weeks ago. It led me to believe we may be in the middle of a turnaround. Notice the following:
-- Prices have increased almost 10% since mid-March
-- Prices are above the shorter SMAs
-- The shorter SMAs are above the longer SMAs
-- All the shorter SMAs (10, 20 and 50) are moving higher.
There is one problem with the rally theory. Market breadth on the NASDAQ stinks:
Market breadth hasn't moved higher with the market, and
The new highs/new low number has been decreasing as well.
On the SPYs, notice the average could be building a base to rally from right now. But also notice the SPYs have not been able to move the 138 - 140 area since earlier this year.
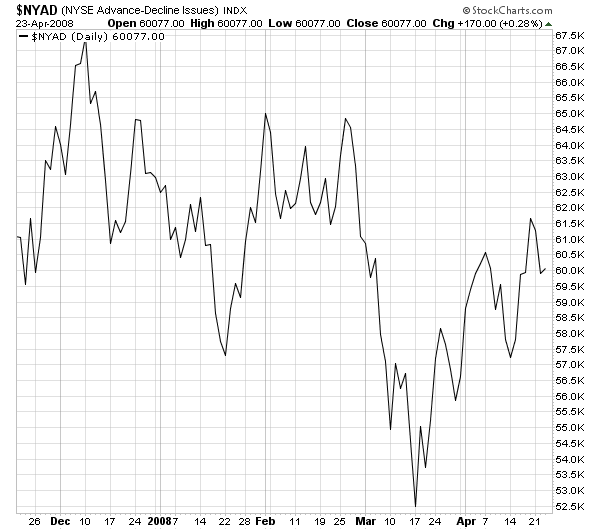
However, the SPYs have seen much better market breadth numbers.
The advance/decline line is actually increasing,
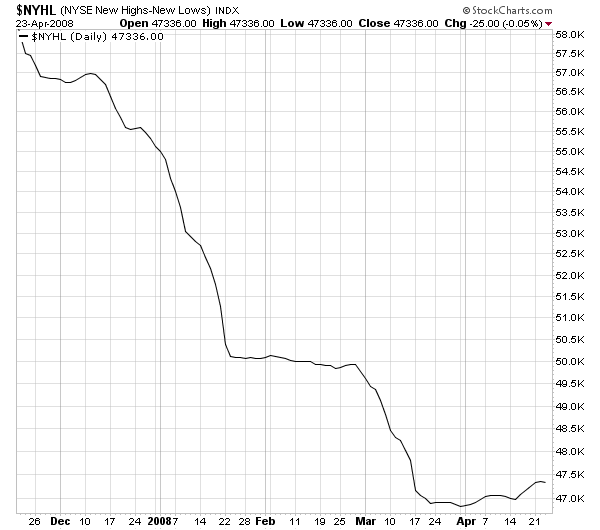
And the new highs/new lows number is moving up a bit.
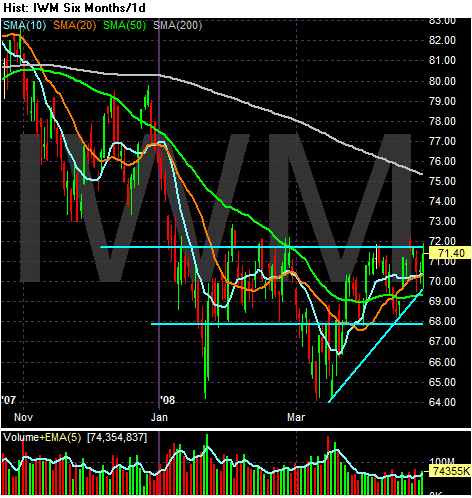
And despite a rally from the IWMs from 64 to about 71, they have not been able to move beyond 72.
The lack of breadth on the NASDAQ -- especially the declining new highs/new lows numbers -- takes a lot of strength away from the bulls case. However, the SPYs advance/decline line is good. If we see the SPYs or the IWMs break out of their respective areas of resistance, then I think we can say that we're in a rally.
We're Nowhere Near the Bottom In Housing
From Marketwatch:
Let's take this in a bit of a reverse order.
1.) These figures are likely overstated. That means we can probably expect downward revisions -- like we saw in February.
2.) Dealers are slashing prices (which probably doesn't include incentives) and yet sales are still down big. That means we have a massive inventory overhang.
For those of you who want a more in-depth explanation of why I think housing will be a wreck for the foreseeable future, go to this link. Here's the short version.
-- There's a boat load of inventory
-- All of the foreclosures we are seeing will simply add to that inventory.
-- Starting in 2010 and going through 2011 we have a second wave of resets
-- The US consumer is already in debt up to his eyeballs,
-- The US consumer hasn't seen an increase in real median home income since 2001, and
-- job growth id decreasing.
U.S. home builders have slashed their prices by a record amount, but sales still plunged by 8.5% to a 17-year low in March, the Commerce Department estimated Thursday.
The decline in new-home sales to a seasonally adjusted annual rate of 526,000 was much weaker than the 577,000 pace expected by economists surveyed by MarketWatch. See Economic Calendar.
The report gives little hope that the housing market is near a bottom. February's sales pace was revised lower to 575,000 from 590,000.
New-home sales are down 36.6% compared with a year ago and are down 62% from the peak in July 2007.
The figures likely overstate the number of sales because they don't account for canceled sales, which have ballooned. The report is based on contracts signed, not sales closed.
Let's take this in a bit of a reverse order.
1.) These figures are likely overstated. That means we can probably expect downward revisions -- like we saw in February.
2.) Dealers are slashing prices (which probably doesn't include incentives) and yet sales are still down big. That means we have a massive inventory overhang.
For those of you who want a more in-depth explanation of why I think housing will be a wreck for the foreseeable future, go to this link. Here's the short version.
-- There's a boat load of inventory
-- All of the foreclosures we are seeing will simply add to that inventory.
-- Starting in 2010 and going through 2011 we have a second wave of resets
-- The US consumer is already in debt up to his eyeballs,
-- The US consumer hasn't seen an increase in real median home income since 2001, and
-- job growth id decreasing.
Read This Now
Over at Afraid to Trade Corey does a great job of showing the dollar/gold relationship.
Rice Price Spikes Leading to Hoarding and Other Fun Problems
From the WSJ's Marketebeat Blog:
When was the last time you heard of a food product not being available in he US? Anyone? I don't think it's ever happened in my lifetime for the reasons outlined above.
From CNBC:
Here's the problem. To bring the price down, what the world needs is a massive increase in supply to literally flood the market. However, we're dealing with food -- a basic human necessity. Governments will always do what Brazil is doing -- cutting exports -- in order to protect their citizens from starvation. While that is politically an astute move, economically it's the worst move possible because it limits an already dwindling supply. It leads to charts that look like this:
Notice the following:
-- Prices have continually broken through resistance to make new highs
-- All of the SMAs are moving higher
-- The shorter SMAs are higher than the longer SMAs
-- Prices have continually used the SMAs as support levels for the rally.
Bottom line -- this is a bullish chart that will bring more traders into the market.
Oh yeah -- this won't help the inflationary picture at all.
Food-related protests have been occurring worldwide, and in the U.S. now major discounters are seeing runs on products, particularly rice, as both Sam’s Club, the Wal-Mart Stores Inc. operated discounter, and Costco Wholesale Corp. have seen shelves cleaned out of rice as consumers worry about higher prices. “It is just unreal what can happen when we get fear being spread as it is now, and when the general populace goes out and starts doing idiotic things like lining up at the Sam’s Club and the Costco and not buying one bag but buying 10 bags just because they might run out,” says Neauman Coleman, introducing broker at Neauman Coleman & Co. in Brinkley, Ark. Sam’s Club has decided to put limits (or rations, if you will) on the amount of 20-pound bags customers can purchase every week, and Costco earlier this week said it was considering such limits as well, which in a way is just as panicky a response.
When was the last time you heard of a food product not being available in he US? Anyone? I don't think it's ever happened in my lifetime for the reasons outlined above.
From CNBC:
Benchmark Thai rice prices leapt more than 5% to a record high above $1,000 a ton Thursday. Meanwhile, Brazil has temporarily halted rice exports to ensure domestic supply amid rising world prices for the grain.
Brazil grows more rice than it consumes and has a reserve that will safeguard the country's supply, Agriculture Minister Reinhold Stephanes said in a statement. Sales abroad will nevertheless be blocked to make sure the country has enough of the grain for the next six to eight months.
.....
Brazil follows on the steps of India and Vietnam, the world's second- and third-largest rice exporters in 2007, in imposing export curbs of rice in a bid to keep prices of the grain under control. Brazil, which is not a major global rice supplier, exported 313,000 tons of rice last year.
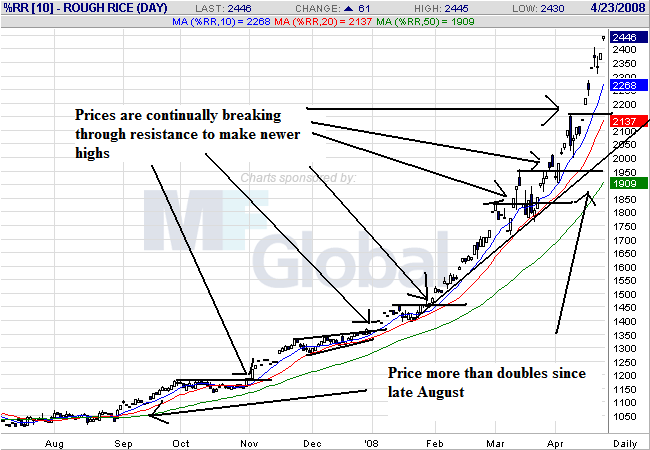
Here's the problem. To bring the price down, what the world needs is a massive increase in supply to literally flood the market. However, we're dealing with food -- a basic human necessity. Governments will always do what Brazil is doing -- cutting exports -- in order to protect their citizens from starvation. While that is politically an astute move, economically it's the worst move possible because it limits an already dwindling supply. It leads to charts that look like this:
Notice the following:
-- Prices have continually broken through resistance to make new highs
-- All of the SMAs are moving higher
-- The shorter SMAs are higher than the longer SMAs
-- Prices have continually used the SMAs as support levels for the rally.
Bottom line -- this is a bullish chart that will bring more traders into the market.
Oh yeah -- this won't help the inflationary picture at all.
The Spin Is Getting Worse
From the AP:
But consider the following:
Let's see -- the company you're buying is being investigated by the FBI for possible fraud, Congress is getting involved and the possibility of civil suits is incredibly high.
Does anyone have any idea as to why Bank of America is still considering this deal? I realize that what they are thinking is "when we get through all of the rough stuff, we'll own the largest percentage of he US mortgage market." But that assumes they'll get through the rough patch. Countrywide is beginning to look like the latest Enron.
Lewis [Bank of America's President] acknowledged the housing crisis wasn't over but said Bank of America paid a fair price for Countrywide and continues to perform deep due-diligence.
"There is a great long-term value embedded in Countrywide's business," he said.
But consider the following:
Mueller did not identify any of the companies under scrutiny. The Justice Department reportedly is looking into whether the nation's largest mortgage lender, Countrywide Financial Corp., misrepresented its financial position and the quality of its mortgage loans.
Congress is considering legislation to help half a million or more struggling homeowners get into lower-cost mortgages amid a darkening economic outlook that seems to be sinking into a recession.
Let's see -- the company you're buying is being investigated by the FBI for possible fraud, Congress is getting involved and the possibility of civil suits is incredibly high.
Does anyone have any idea as to why Bank of America is still considering this deal? I realize that what they are thinking is "when we get through all of the rough stuff, we'll own the largest percentage of he US mortgage market." But that assumes they'll get through the rough patch. Countrywide is beginning to look like the latest Enron.
Wednesday, April 23, 2008
Today's Markets
There was some good earnings news today. Boeing announced a 38% increase in profits, and Amazon announced a 30% increase. However, Delta and Northwest announced a big drop largely because they didn't hedge their fuel costs. Oil pulled back a bit, but it's still at high levels. And an analyst thinks regional banks are juest starting to feel the pain.
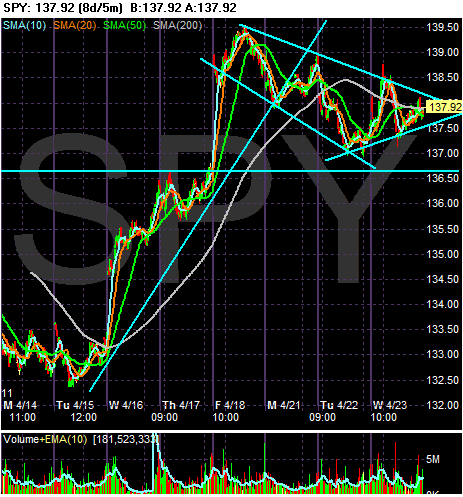
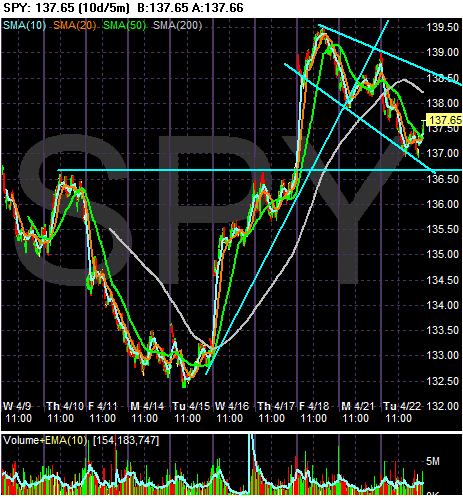
From 4/15 to 4/18, the SPYs were rallying. As the chart above shows, the SPYs have been in a standard pennant pattern for the last three days. However, it shoul dbe raising some concern that the SPYs rose big time early this morning and couldn't hold their momentum.
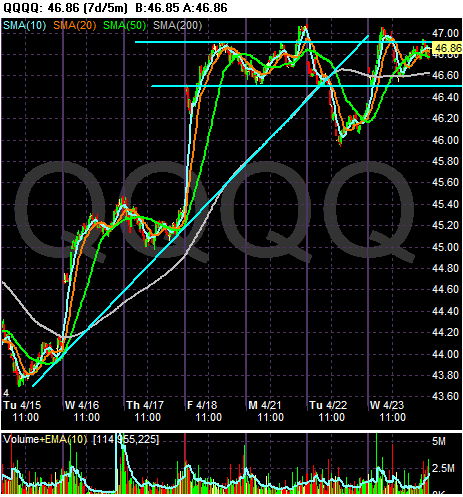
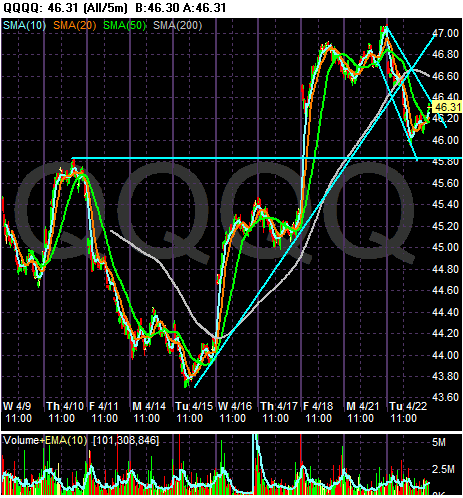
Save for their big drop yesterday, the QQQQs have been in a pretty tight range for the last 4 days, fluctuating between 46.50 and 47.
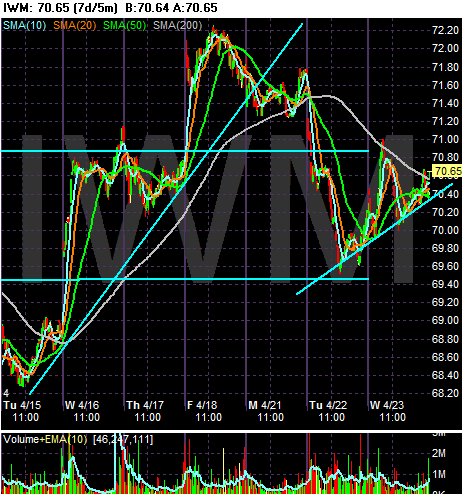
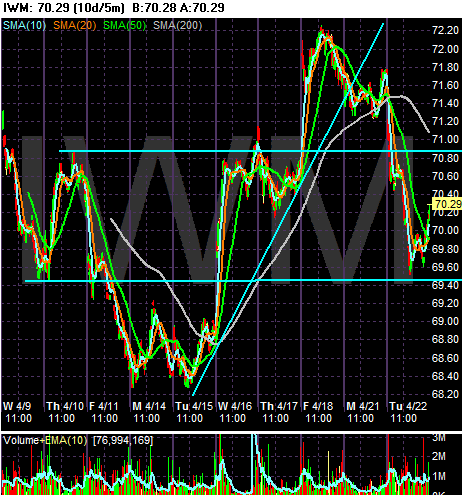
The IWMs are clearly off their rally right now. For anyone looking for a further market rally, this chart should raise a few eyebrows. The IWMs are a good indicator of risk capital. Lack of rallying in this area of the market tells us that risk may not be on everybody's mind right now.
Problems in the Financial Sector Aren't Over
From Bloomberg:
Please --- a "small group of traders" is responsible for this? That's pure spin, nothing more. The company -- like everybody else on Wall Street -- owns a lot of crap paper. That crap paper's underlying value is dropping fast because it's backed by crap mortgages. There's nothing more complicated about it than that.
From Bloomberg:
Translation: if you trade out stock, there's a big speed bump coming up....
On Monday, I wrote about last week's financial company earnings which showed widening losses, more writedowns and increasing loan-loss provisions.
Bottom line: this isn't over by a long shot.
Credit Suisse Group, Switzerland's second-biggest bank, may report the first quarterly loss in almost five years on writedowns linked to deteriorating credit markets and securities that had been intentionally mispriced.
Credit Suisse will probably post a first-quarter net loss of 594 million Swiss francs ($593 million) tomorrow, compared with a 2.73 billion-franc profit a year earlier, according to the median estimate of 14 analysts surveyed by Bloomberg. Markdowns by the Zurich-based bank may amount to 5 billion francs, analysts said.
Chief Executive Officer Brady Dougan announced on March 20 that the bank would probably have a loss after ``a small group'' of traders mispriced securities and credit markets worsened. The company's losses have been dwarfed by UBS AG, its larger Swiss rival, which said on April 1 it probably lost about 12 billion francs in the first three months of the year.
``The bank hasn't covered itself in glory but it's certainly not the worst performer,'' said Matthew Clark, an analyst at Keefe Bruyette & Woods in London with a ``market perform'' rating on Credit Suisse. ``They're facing revenue headwinds but the franchise shouldn't be too much damaged by writedowns.''
Please --- a "small group of traders" is responsible for this? That's pure spin, nothing more. The company -- like everybody else on Wall Street -- owns a lot of crap paper. That crap paper's underlying value is dropping fast because it's backed by crap mortgages. There's nothing more complicated about it than that.
From Bloomberg:
HVB Group, UniCredit SpA's German banking unit, said it expects ``significant'' losses related to the credit crisis in the first quarter.
``We expect significant valuation adjustments on our securities portfolio in the first quarter as credit spreads clearly worsened since the beginning of the year,'' Chief Executive Officer Wolfgang Sprissler said at a press briefing in Munich late yesterday. He declined to be more specific. His comments were confirmed by HVB spokeswoman Claudia Bresgen.
Translation: if you trade out stock, there's a big speed bump coming up....
On Monday, I wrote about last week's financial company earnings which showed widening losses, more writedowns and increasing loan-loss provisions.
Bottom line: this isn't over by a long shot.
If This Company Can Get a AAA Rating.....
From Bloomberg:
Let me get this straight.
-- Ambac loses over $11 per share.
-- They have an operating loss of over $6/share
-- They have to raise capital
-- Their new business dropped 87%
To say this company has had a reversal of fortune is too kind. And they still have a AAA rating? What in God's name are the rating agencies smoking?
Ambac Financial Group Inc., the world's second-largest bond insurer, posted a wider loss than analysts estimated after being crippled by writedowns for guarantees on subprime-mortgage securities.
The first-quarter net loss was $1.66 billion, or $11.69 a share, compared with $213.3 million, or $2.04, a year earlier, the New York-based company said today in a statement. The company's operating loss of $6.93 a share was larger than the $1.82 estimated by six analysts surveyed by Bloomberg.
Ambac, which was stripped of one of its three AAA ratings this year, was ``severely impacted'' by the plunging value of mortgage- related guarantees, interim Chief Executive Officer Michael Callen said in the statement. Ambac's new business slumped 87 percent and the company took a $1.04 billion provision for losses on mortgage securities. Ambac insured 1 percent of municipal bonds sold in the quarter, according to Thomson Financial.
Let me get this straight.
-- Ambac loses over $11 per share.
-- They have an operating loss of over $6/share
-- They have to raise capital
-- Their new business dropped 87%
To say this company has had a reversal of fortune is too kind. And they still have a AAA rating? What in God's name are the rating agencies smoking?
All You Need to Know About Existing Home Sales
From the WSJ:
The absolute number is high as well:
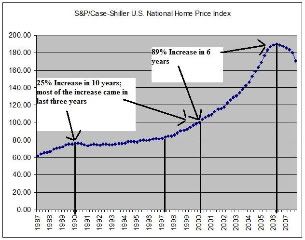
Let's combine that with the Case Shiller home price index:
The bottom line is we're nowhere near the end of this; prices have a lot more to fall. And anyone who is calling a housing bottom is playing the spin game, nothing more. There are still way too many homes on the market for this to be anywhere near over.
But at least not all analysts are political hacks:
The languid sales pace has pushed inventories of unsold homes to a 9.9 months' supply at current sales rates. That large overhang has put downward pressure on prices for months, especially in areas hit hardest by the housing crisis.
The absolute number is high as well:
The number of homes for sale at the end of March increased by 40,000 to 4.06 million. At the current sales pace, that represented 9.9 months' worth, up from 9.6 months' worth at the end of the prior month.
Let's combine that with the Case Shiller home price index:
The bottom line is we're nowhere near the end of this; prices have a lot more to fall. And anyone who is calling a housing bottom is playing the spin game, nothing more. There are still way too many homes on the market for this to be anywhere near over.
But at least not all analysts are political hacks:
``There still is an imbalance in the existing housing market that needs to be corrected through lower inventories and higher sales,'' said Michelle Meyer, an economist at Lehman Brothers Holdings Inc. in New York, which correctly forecast the sales level. ``The market will remain out of balance this year and most of next. As long as the housing market remains weak we think the economy will remain weak as well.''
Tuesday, April 22, 2008
Today's Markets
As the chart shows, the SPYs were rallying all of last week, rising from 132.50 to 139.50. So a sell-off is to be expected. Notice that action for the last two days is a straightforward pennant formation. Also that when you pull the lens back, the selling is pretty disciplined -- a drop followed by a rally (although to a lower level) and then a drop. Bottom line, the last two days looks like a standard sell-off.
Notice the QQQQs action is pretty much just like the SPYs with the exception that the pennant formation occurs over a day rather than 2. Notice the QQQQs have an important support level at 45.80.
Notice the depth of the sell-off in the IWMs. This is not a standard correction where traders are simply taking profits; this is a hard-core big time sell-off. The reason is the IWMS are considered riskier, so people will leave this area of the market.
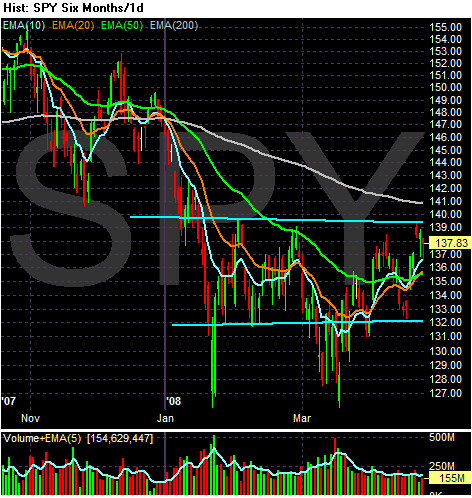
Let's look at a six month SPY chart and ask an important question: is this a base for a rally? There are plenty of indications it is. Notice the possible double bottom with the first occurring in late January and the second occurring mid-March. Also notice that with the exception of the two double bottom points prices are been in a fairly tight range from 132 - 139. While there has been plenty of bearish news, prices have found incredibly strong support at 127 and again at 132. The latter level has seen three support rallies since February, although prices did move below that level once. However, no chart is perfect.
US Gasoline Consumption Down
From the Kansas City Star:
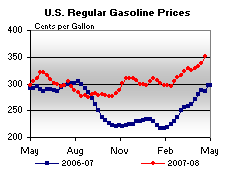
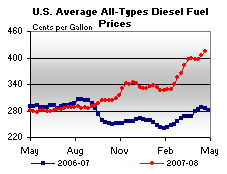
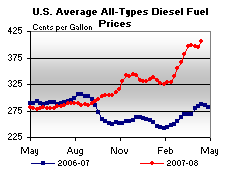
Here are two charts from This Week in Petroleum to show where retail prices are:
Notice that instead of falling in the winter, both gas and diesel prices remained at high levels. I think this is an important contributing factor to the slowdown that occurred in the fourth quarter.
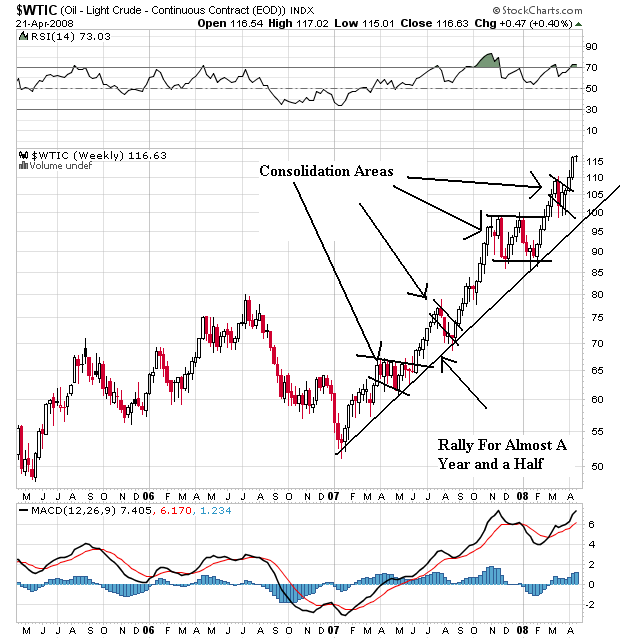
Also consider the following graph of oil prices:
Oil has been in a rally for almost a year and a half. Notice the market has continually advanced through previous resistance levels, consolidated gains and then moved higher.
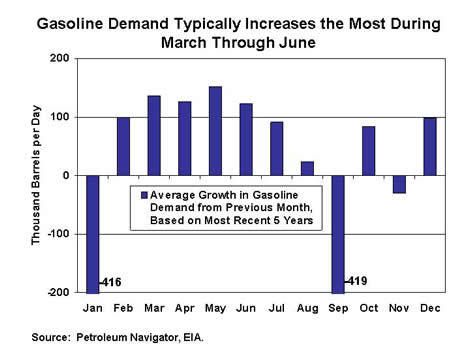
However, we're moving into the summer driving season when demand typically increases:
Finally, I have two words: India and China. Simply put, US demand is no longer the only driving force of the oil market. There are now over 2 billion more people who've seen their standard of living increase.
U.S. drivers are doing something they haven’t done for nearly two decades — consume less gasoline.
Gas consumption so far this year is down about 0.2 percent compared to last year, according to the Energy Information Administration. The federal agency is predicting that gasoline demand will be down 0.4 percent this summer and 0.3 percent for the year.
That may not sound like much, but it would be the first time since 1991 that there’s been a decline in annual gas consumption. And it would be only the eighth year since 1951 in which demand for gasoline has declined.
The federal agency noted that the decline was occurring in part because of a slowing economy. But it also said that higher gas prices were having an effect on demand.
“Sustained higher gasoline prices are beginning to show up in lower gasoline consumption,” said Tancred Lidderdale, an analyst for the Energy Information Administration.
Both gasoline and diesel prices are now at record levels.
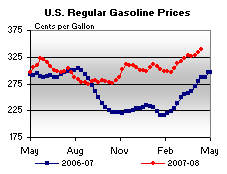
Here are two charts from This Week in Petroleum to show where retail prices are:
Notice that instead of falling in the winter, both gas and diesel prices remained at high levels. I think this is an important contributing factor to the slowdown that occurred in the fourth quarter.
Also consider the following graph of oil prices:
Oil has been in a rally for almost a year and a half. Notice the market has continually advanced through previous resistance levels, consolidated gains and then moved higher.
However, we're moving into the summer driving season when demand typically increases:
Since last fall, the average U.S. retail price for regular gasoline has been close to or above $3 per gallon in large part due to high crude oil prices. High crude oil prices are expected to remain an important reason why retail gasoline prices are projected to stay above $3 per gallon for some time to come. As the chart below indicates, we are now in the “time of the season” when gasoline demand begins to increase. As seasonal demand increases, prices tend to rise as well, all else equal. Even though U.S. gasoline demand has been lower than year-ago levels so far this year, EIA still expects that rising gasoline demand over the next few months will drive retail prices higher. So, while gasoline prices have risen above $3 per gallon mostly due to high crude oil prices, increasing gasoline demand will likely take retail gasoline prices to $3.50 per gallon and above, even if year-over-year gasoline demand is negative. The simple fact that more and more gasoline will be used over the next few months will probably be enough to cause retail gasoline prices to increase, even if crude oil prices begin declining, as EIA is currently projecting. Additionally, the cost of making “summer-grade” gasoline (“summer-grade” gasoline produces less smog) is significantly more than making “winter-grade” gasoline, helping to raise retail prices even further during the summer months, all else equal.
Finally, I have two words: India and China. Simply put, US demand is no longer the only driving force of the oil market. There are now over 2 billion more people who've seen their standard of living increase.
Sun Trust Jacks-Up Loan Loss Provision
From Bloomberg:
Let's combine that with some other happy news in the financial sector:
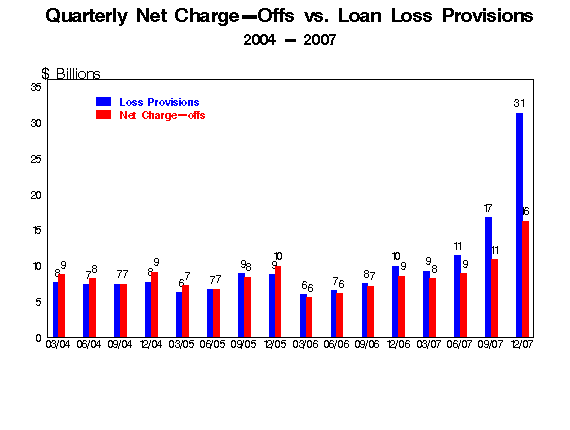
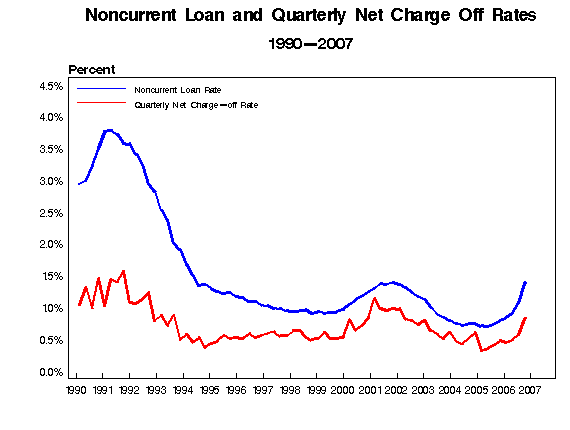
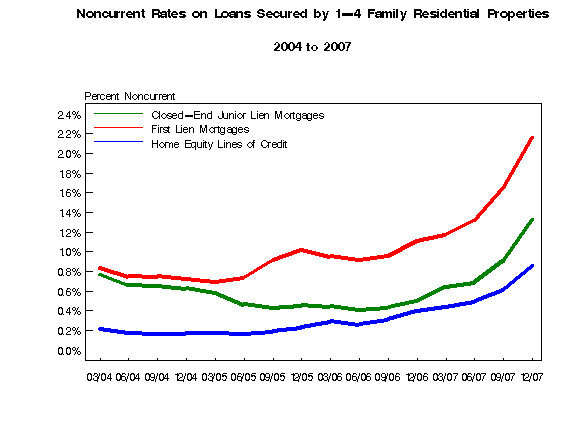
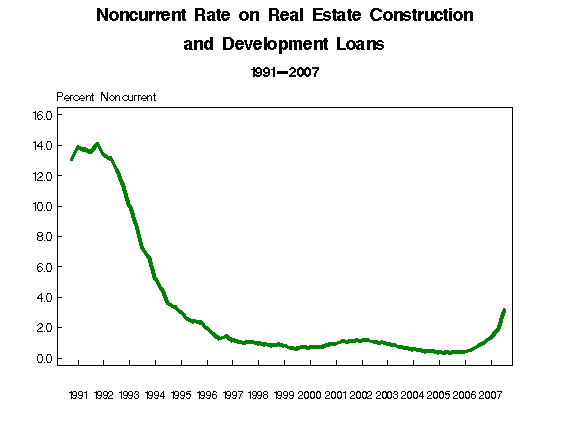
Also consider the following graphs from the latest Quarterly Banking Profile from the FDIC:
Non-current loans and charge-offs are increasing
As are loss provisions for deal with the increasing charge-offs
Non-current loans and charge-offs are now at levels last seen during the last recession.
Residential mortgage loans losses have been increasing for almost two years
And non-current rates on commercial and industrial loans are are their highest rates in 11 years.
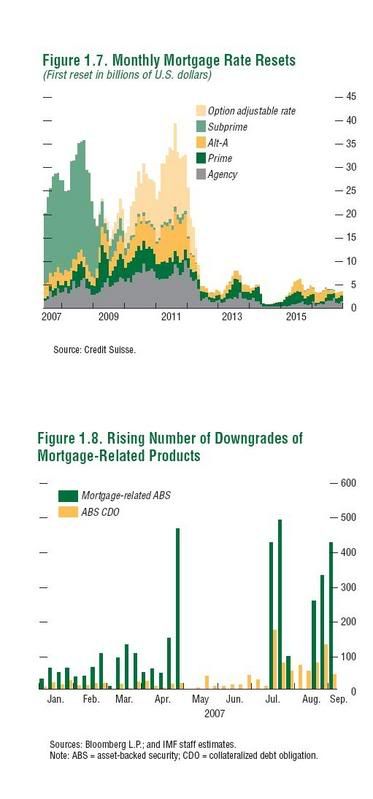
These charts tell me problems in the financial sector are just getting started. And just in case you think everything is all hunky-dory, consider we get to go through another two years of resets starting in about a year and a half
The company raised its provisions for loan losses 10-fold to $560 million on expected losses on mortgages, home equity credit lines and residential construction, it said.
Let's combine that with some other happy news in the financial sector:
Federal banking regulators will hire 140 new employees in an effort to reassure the public they are well-positioned to deal with a possible increase in bank failures over the next year, the Federal Deposit Insurance Corp. said Tuesday.
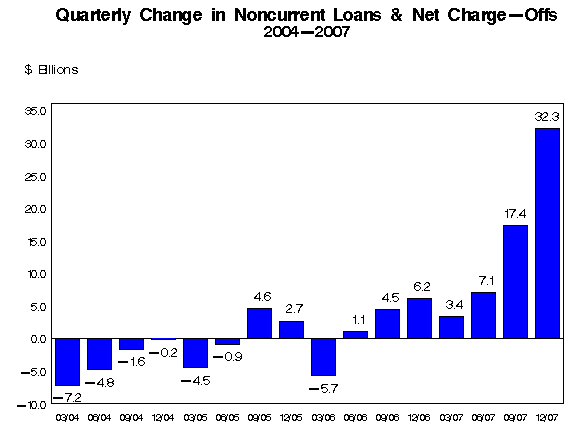
Also consider the following graphs from the latest Quarterly Banking Profile from the FDIC:
Non-current loans and charge-offs are increasing
As are loss provisions for deal with the increasing charge-offs
Non-current loans and charge-offs are now at levels last seen during the last recession.
Residential mortgage loans losses have been increasing for almost two years
And non-current rates on commercial and industrial loans are are their highest rates in 11 years.
These charts tell me problems in the financial sector are just getting started. And just in case you think everything is all hunky-dory, consider we get to go through another two years of resets starting in about a year and a half
A Closer Look At the Currency Markets
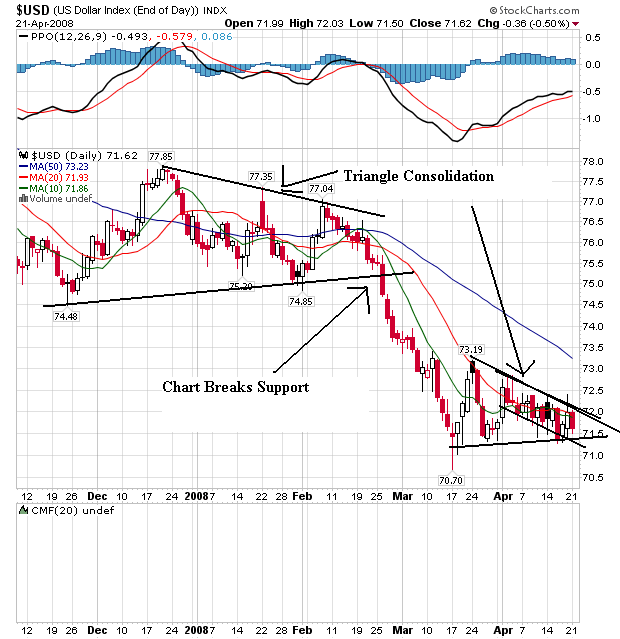
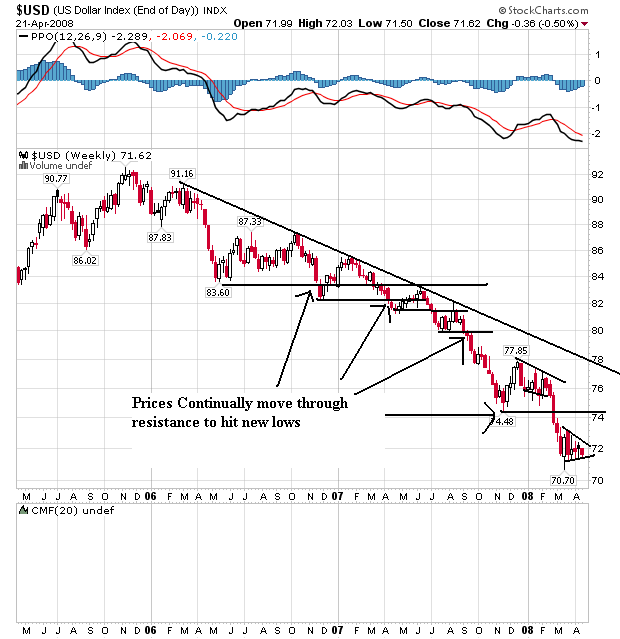
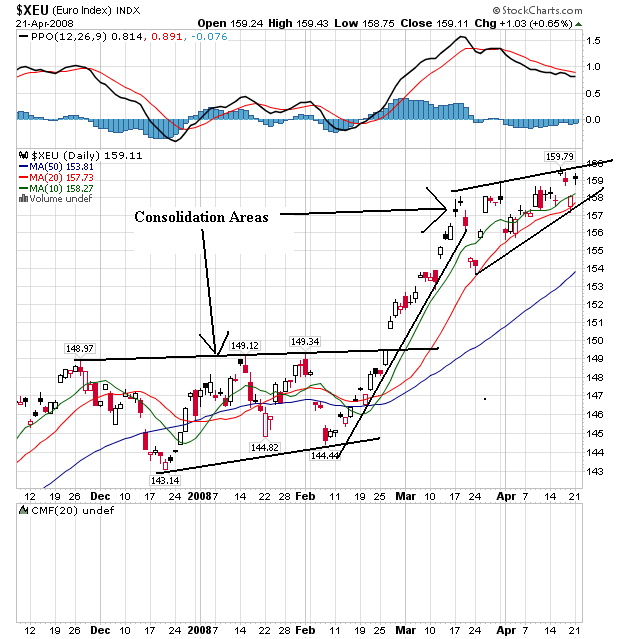
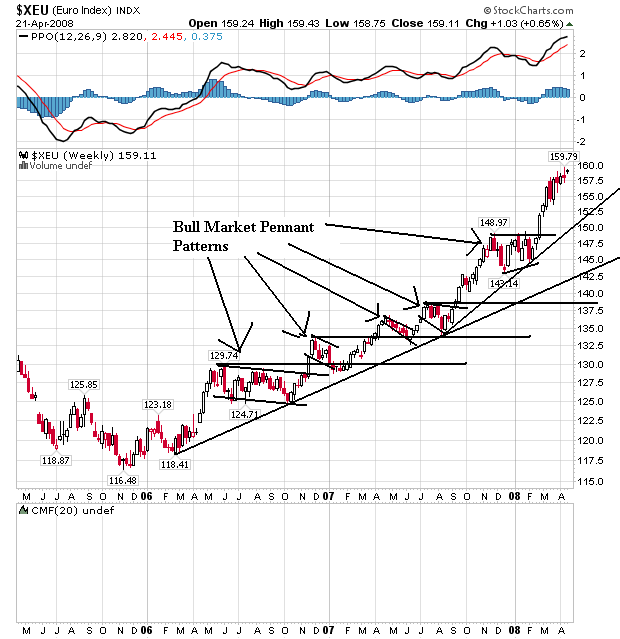
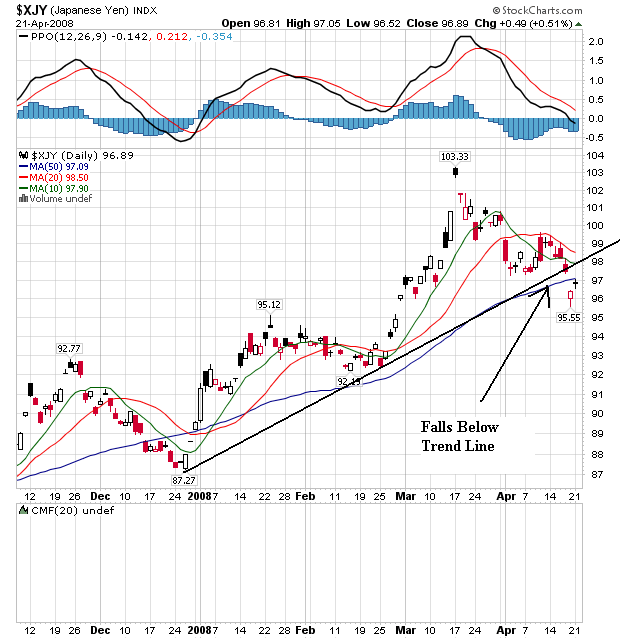
Let's take a look at the daily and weekly charts of the three big currencies -- the dollar, the euro and the yen.
Notice the dollar was in the middle of consolidation pattern from late November 2007 to late February 2008. The dollar fell through support at this time and has since been in the middle of another consolidation pattern between 71 and 73. Prices and the 10 and 20 day SMA are bunched up at this level, indicating traders don't have a firm idea about where they want to send the dollar.
On the weekly chart, notice a clear bear market. Prices are clearly moving lower and have been for the last two years. Prices have continually moved through support to make new lows. Currently the market is forming a triangle consolidation pattern.
On the euro's daily chart, notice how it is nearly a mirror image of the dollar's chart. The euro consolidated from late November to late February, broke through upside resistance and has formed a consolidation triangle pattern over the last month or so. Prices and SMAs are both moving higher, although they are also a bit bunched indicating a lack of direction.
Here we also have a near exact opposite of the dollar. Prices have continually moved higher. There are pennant consolidation patterns along the way and prices have continually moved through upside resistance.
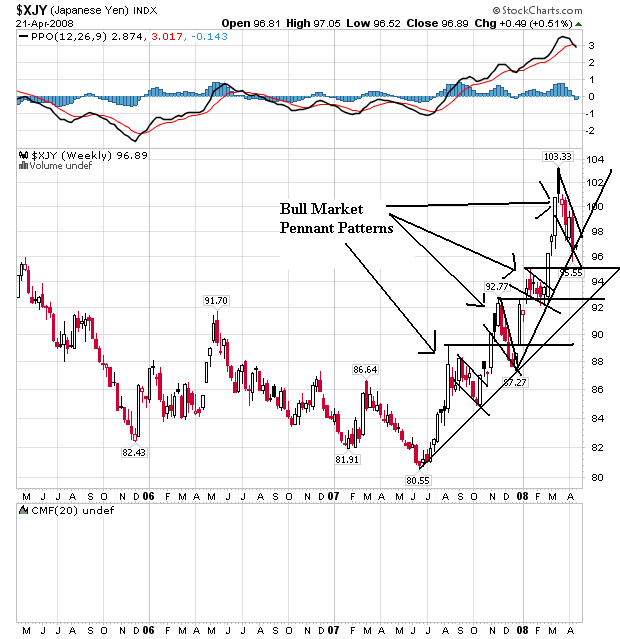
On the daily yen chart, notice that prices have broken through support. However, they still are around the 50 day SMA level where they were at the end of December. However, this is the last area of support for the yen, so if it wants to keep in it's rally it has to, well, start rallying from this level sometime soon.
On the weekly chart, notice that prices have been rallying hard for nearly a year. They have continually moved through price resistance levels and formed bull market pennant consolidation patterns. However, compare the slope of the yen and euro rally. The yen rally is incredibly sharp whereas the euro's is more gentle. Gentle rallies are better over the long run.
Monday, April 21, 2008
Today's Markets
I'm going to use the daily charts to give a better idea of what is happening.
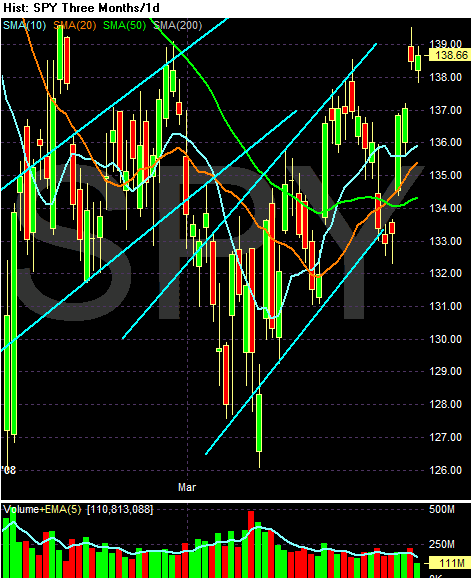
On the daily chart, notice the following:
-- From the bigger picture perspective, we are still in the middle of two bear market pennant patterns.
-- Prices are still below the 200 day SMA
-- The 10 and 20 day SMA are both increasing
-- The 10 and 20 have crossed above the 50 day SMA
-- Prices are higher than the shorter SMAs (10, 20 and 50), which will pull these averages higher.
-- Volume is still low
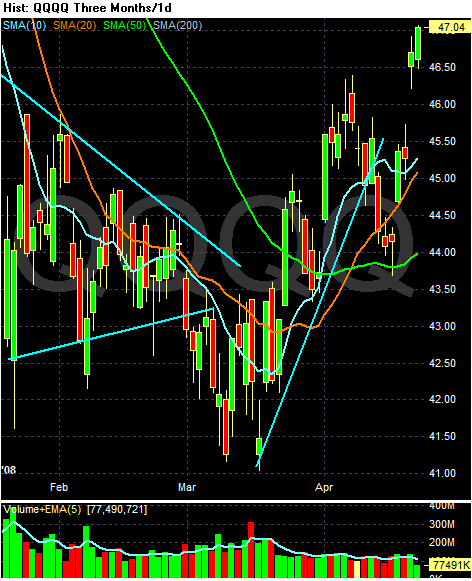
On the QQQQs chart, notice the following:
-- Prices are still below the 200 day SMA
-- Prices are higher than the shorter SMAs
-- The 10 and 20 SMA crossed over the 50 day SMA
-- The 10, 20 and 50 day SMA are all headed higher
-- Volume is still weak
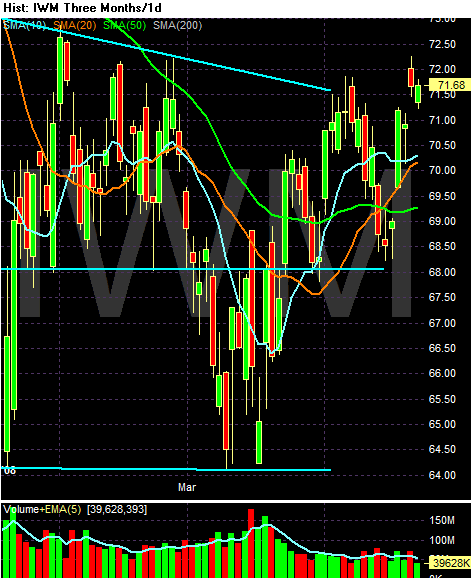
In the IWM, notice the following:
-- Prices are still below the 200 day SMA
-- Prices are above the shorter SMAs
-- The 10 and 20 SMA are headed higher
-- The 10 and 20 SMAs crossed over the 50 SMA
-- Volume is still weak
Regarding volume, an astute reader commented that this might be because only smart money is going into the market right now -- waves of people are still backing off from committing funds. This is a distinct possibility and can't be overlooked.
The QQQQs are offering the strongest case for a rally right now. But the other averages are also pointing in that direction as well.
Subscribe to:
Posts (Atom)