Saturday, September 8, 2007

Where The Market Stands

I have been working on the theory that the market was consolidating in a head and shoulders formation and was going to make a short rally as the rate cut expectations grew. Everything was about where I expected it to be through Friday morning. The market was still uneasy, but was consolidating gains and staying above the H&S neckline. The daily action wasn't great, but wasn't horrible

Then came the employment report. It wasn't just bad. It stunk. Mish completely takes it apart. He and I are in complete agreement on what this report said: This jobs report was nothing short of a disaster. In short, this wasn't just weak enough to add credence to a rate cut scenario. It increased talk of an outright recession. That is a development I wasn't expecting and that is the reason for the heavy action yesterday.

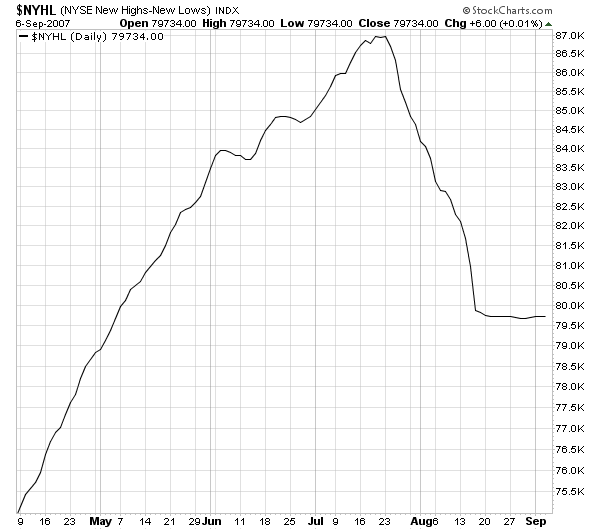
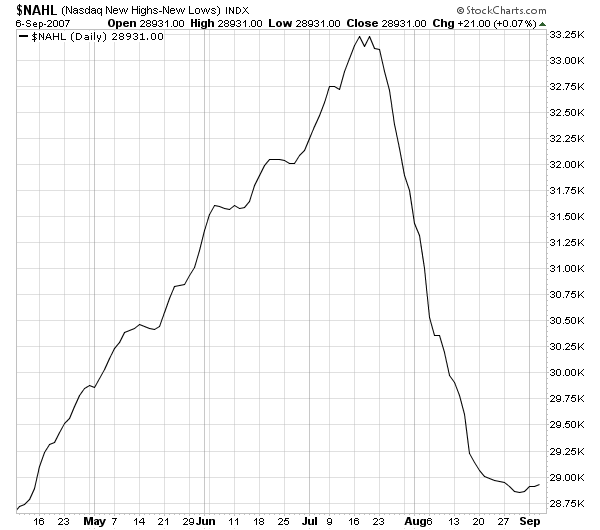
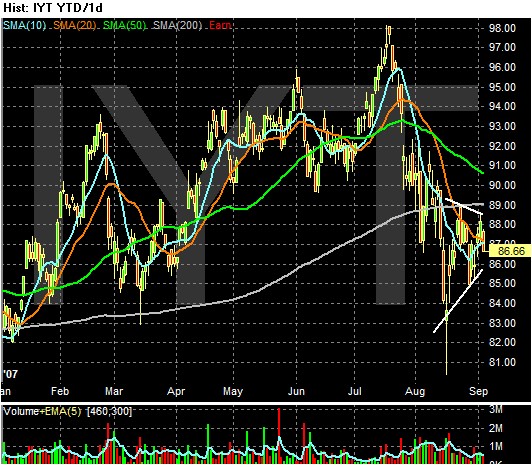
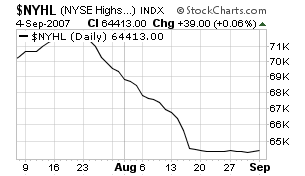
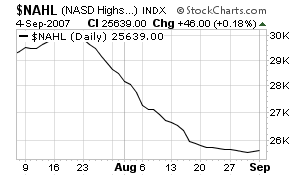
I will add in my own defense that I have consistently put up the NYSE and NASDAQ new highs/new lows chart from stockcharts.com and mentioned they indicate the uptrend isn't that strong (see this post). And I also mentioned the transportation average was not confirming the rally along with another mention of the weak high/low average here. This demonstrates that while I was short-term bullish I was still not completely sold on my own idea.

However, let's look at a broader idea I mentioned in this article -- that the idea of a rate cut has put a floor under the market.

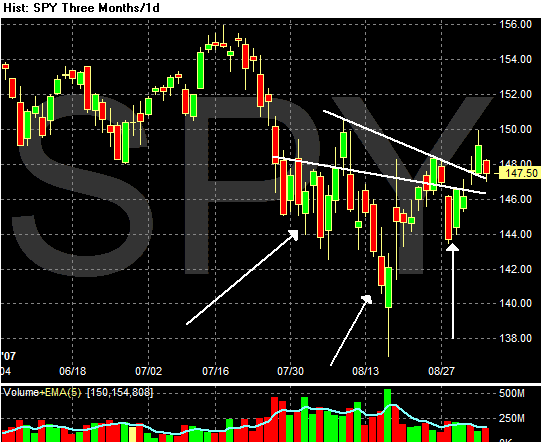
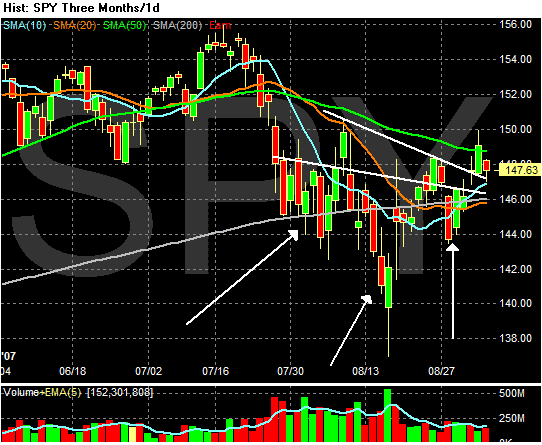
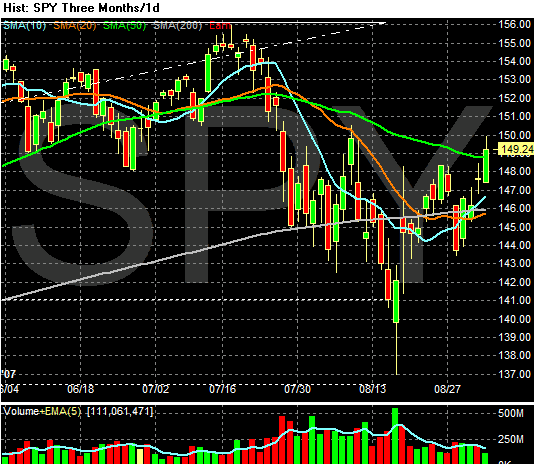
Here's a daily chart of the SPYs:
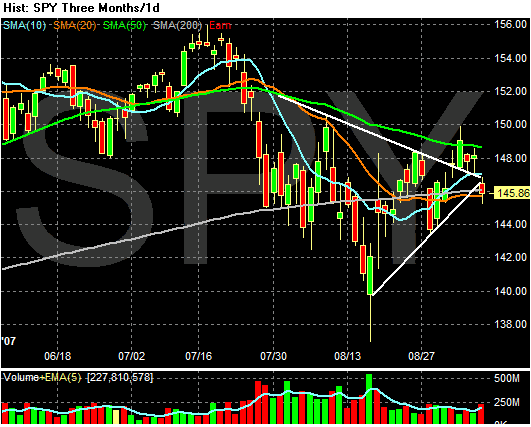


As I mentioned below, yesterday's action did a great deal of technical damage. First, it broke the uptrend the market started in late July. Trends are very important in the market. Traders will follow them irrespective of the underlying market conditions. If the market is moving in one direction, traders will simply stare at their screens, block out any contrary information, and keep making bets in the trends direction. That's how market work. Yesterday's action ruined a few weeks long trend.

In addition, it took out the theory of the market consolidating in a head and shoulders formation and rallying on rate cut events. With yesterday's close breaking the neck line the possibility of a higher move are greatly diminished.

All that being said -- what is the downside risk right now? First, there is a ton of technical traffic in the $144-$148 area. The market has to move through this area convincingly before another serious downside move. There is also the issue of the 200 day SMA, which has acted like a center of gravity for the market for the last month. While the market hasn't moved convincingly higher over the 200 day SMA, it has not moved convincingly lower either. That tells me the jury is definitely still out regrading the downside risk. Then there is the issue of overall valuation. According to Barron's The Dow's PE is 15.73 and the S&P's is 17.08. While these aren't cheap, they certainly aren't expensive either. In other words, traders aren't going to sell based on the theory the market is really expensive.

Then there is the Fed. The market is expecting a rate cut in September, and the jobs report adds a great deal of credence to that expectation. I would add a word of caution that last week four Fed governors gave speeches that did not telegraph a 100% possibility of a rate cut. I work on the assumption that Fed officials have advanced economic information, meaning they probably knew about the jobs report when they gave their speeches. However, despite these speeches, I would not be surprised to see the Fed cut rates later this month.

However, I think the market is now moving into a different thought pattern. The jobs report increased talk of a recession. And the market may now be really on edge as it awaits more data that either confirms or denies that possibility. Until there is a firm idea as to which way the underlying economy is going I would expect the market to remain very weak, but not weak enough to send the market into a complete meltdown. Therefore, I think the market is going to move back into a very neutral stance where the 200 day SMA is the big trendline to watch.

Now that I've said that, I'm sure the market will again make an ass out og me within the next few weeks.
Friday, September 7, 2007

Today's Markets

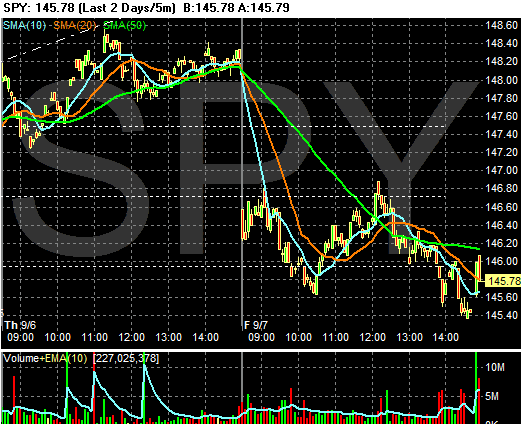
The employment report sent the market down today. However, once the market dropped it stayed within a range. This is encouraging. However, the market did sell-off 1.44% as of this writing. Also note there was buying interest later in the day which is encouraging.


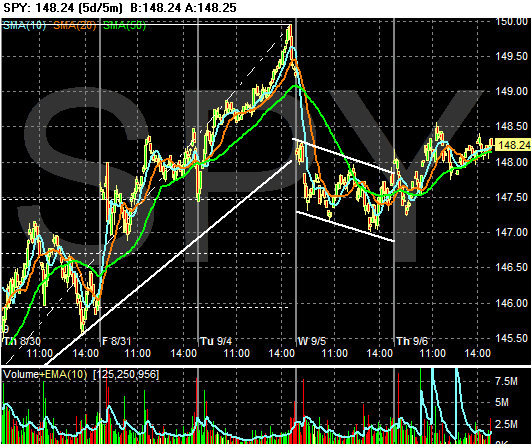
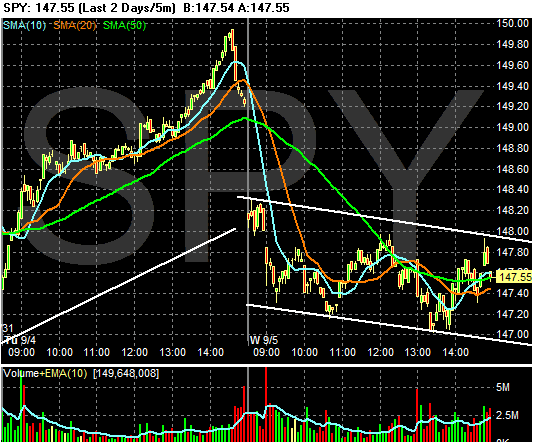
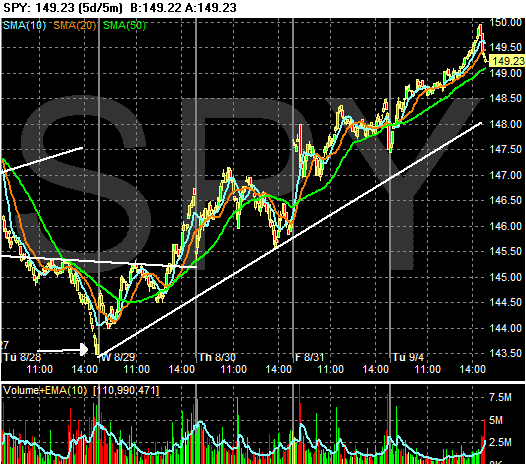
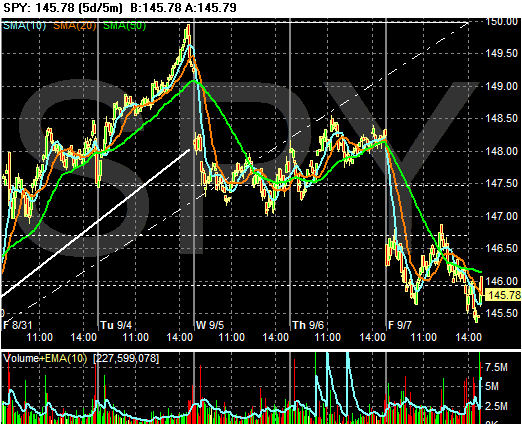
Here's a 5-day chart. The market broke trend on Wednesday, traded in a range for two days waiting for the employment report, then sold-off today.


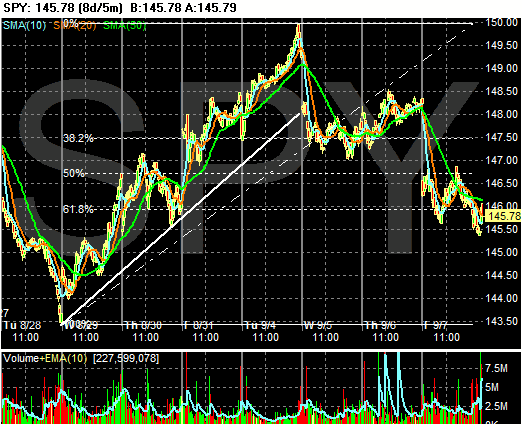
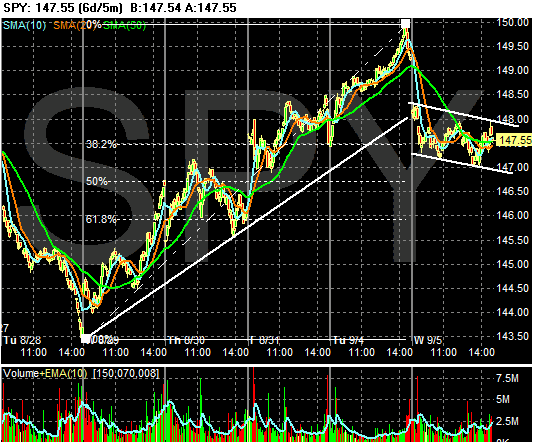
Here's an 8-day chart. Notice that even though the market has broken the uptrend and sold-off, we're now at the 61.8% Fibonacci retracement level from the rally.


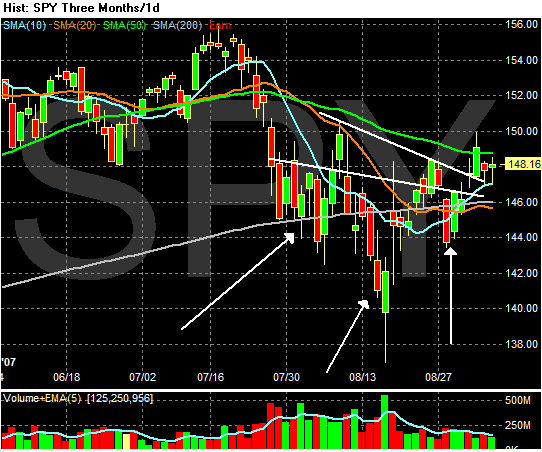
Here's the daily chart. Notice the following:

1.) The SPYs have broken the neck line of the head and shoulders formation.

2.) The SPYs are back at the 200 day SMA.

3.) The SPYs broke the uptrend stared in mid-August.

Employment Report Stinks

From the BLS:

Nonfarm payroll employment was essentially unchanged (-4,000) in August, and the unemployment rate remained at 4.6 percent, the Bureau of Labor Statistics of the U.S. Department of Labor reported today. Over the last 3 months, total payroll employment changes have averaged 44,000 per month and private sector employment changes have averaged 72,000 per month (as revised). In August, employment in manufacturing, construction, and local government education declined, while job growth continued in health care and food services.


The details aren't very good.

First,

Manufacturing employment declined by 46,000 in August. This industry has lost 215,000 jobs over the past year. In August, declines were widespread among component industries. Within durable goods, there were job losses in motor vehicles and parts (-11,000), machinery (-7,000), wood products (-7,000),furniture and related products (-4,000), and semiconductors and electroniccomponents (-4,000). In nondurable goods manufacturing, job losses continued in apparel (-4,000) and in textile mills (-2,000).


In addition,

Construction employment declined in August (-22,000), with most of the loss occurring among residential specialty trade contractors. Since its most recent peak in September 2006, construction employment has fallen by 96,000.


"Blue collar" employment isn't doing very well. Manufacturing has been shedding jobs for the last year, and the decline in construction employment indicates the housing slowdown is finally translating into job losses.

In addition, gains were in low-paying sectors. Education and health services added 63,000 jobs, and "leisure and hospitality" (read, "do you want fries with that?") added 12,000. These lower paying sectors are where job growth was strongest.

Yesterday, Bob Pisani wrote the following on his blog:

The jobs report. This leaves tomorrow jobs data as the key economic report before the Fed meeting September 18th. There have been some signs of weakness in the employment trends recently. Very strong data will clearly reduce the chances of a cut; very weak data will revive the belief a cut is imminent. The worst case scenario for the stock market is a jobs report that is in line or just slightly below expectations; this will leave traders confused about the Fed's intentions and put more weight on the weekly jobless claim numbers.


I think Pisani is correct in his analysis here. This number is clearly negative and all really ups the probability of a rate cut at the next Fed meeting.

T-Bill and Yen Update

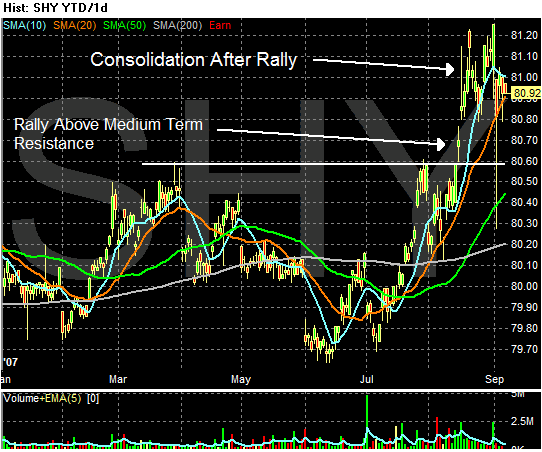
T-Bills and the yen index are very important right now. I'm going to add a third chart to this, which is the SHY. This is the ETF for the 1-3 year Treasury market. It's a bit broader than simply looking at T-Bills.

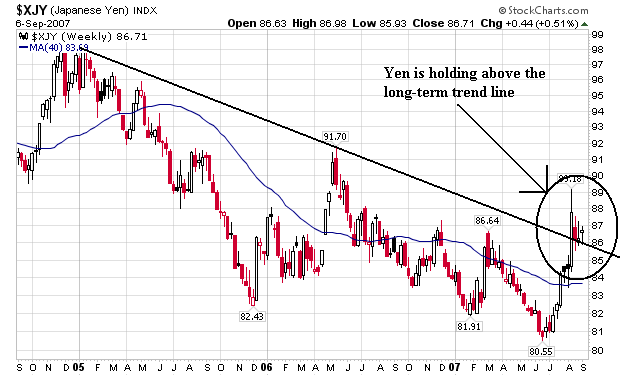
Here's the yen, which is an obvious proxy for the carry-trade (borrowing where rates are cheap and lending where returns are higher). Notice the yen is consolidating above long-term resistance. While we haven't seen a move above this consolidation, we also haven't seen a move below this area either. A move over this area of consolidation will probably spell some real trouble for the market because it will indicate traders are probably moving away from the carry trade.


T-Bills

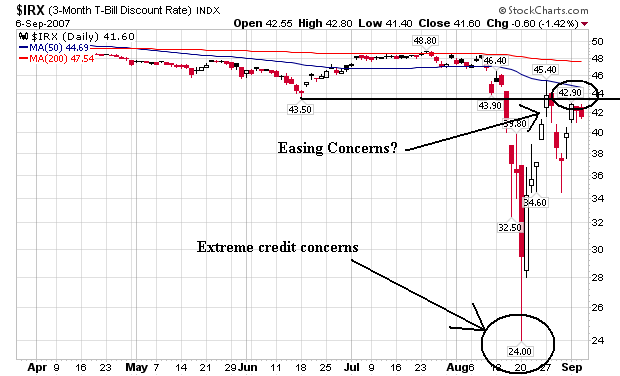
T-Bills -- the extreme short-end of the Treasury market -- have moved back to near post-run-up levels. This is a good sign overall.


However, the short-end of the Treasury curve is still consolidating advances after it broke through resistance. This indicates traders are still concerned about the credit markets and are simply parking money in short-term conservative debt for now.

New High/New Low Index Stil Bearish

Here is the chart for the New York and NASDAQ New High/New Lows, respectively. Notice they are still moving sideways. Until these indicators start to make upward advances this is a skeptical rally.


Thursday, September 6, 2007

Fed Officials Upbeat

From Marketwatch

Federal Reserve officials said Thursday that current economic conditions are good and the financial turmoil hasn't hurt Main Street.

In a luncheon speech to the Atlanta Press Club, Atlanta Federal Reserve President Dennis Lockhart said there are no signs of spillover from the housing and mortgage market woes into other sectors of the economy such as consumer spending.

Lockhart said his comment relied on real-time information from business contacts around the South because much of the new government indicators are "backward looking."

"So far, I have not seen hard or soft data that provide conclusive signs that housing problems are spilling over into the broad economy," Lockhart said.

His remarks echo the sentiment in the Fed's Beige Book report on current economic conditions that found that growth continued across the country at a moderate pace through August with little sign that the credit crunch and financial turmoil have slowed activity. See full story.

But in an earlier statement to reporters following a speech in London, St. Louis Fed President William Poole said the risks of recession have risen as a result of the market turmoil. But Poole said, "I don't think we should take for granted that the economy is going to nosedive."

Later in the afternoon, Dallas Fed President Richard Fisher was upbeat about current conditions.

In answer to a question after a speech in El Paso, Fisher said recent economic data has been "rather positive," and pointed specifically to the August ISM services index, which was unchanged at 55.8%.


Let's make an assumption that Fed governors are in regular contact with one another. In addition, let's also assume they loosely coordinate their public statements. That would make sense at a time like this with everybody looking to the Fed to cut rates later this month. If all of those points are true then a rate cut is not a definite possibility.

So, let's assume the Fed doesn't act. What happens to the market? My guess is a day or two of selling but nothing drastic. After the initial sell-off, my guess is traders would come to the opinion there was no reason for the Fed to cut, meaning things aren't as bad as perceived. I have no idea if that is what will actually happen, but it makes sense. Non-action means the economy is doing fairly well.

Here's how Bloomberg reported the speeches:

Four regional Federal Reserve bank presidents declined to endorse a cut in the benchmark interest rate this month, as policy makers gauge the impact of the credit- market rout on the U.S. economy.


The markets are probably not happy about this development.

Foreclosures Still Increasing

From the Mortgage Banker's Association

The delinquency rate for mortgage loans on one-to-four-unit residential properties stood at 5.12 percent of all loans outstanding in the second quarter of 2007 on a seasonally adjusted (SA) basis, up 28 basis points from the first quarter of 2007, and up 73 basis points from one year ago, according to MBA’s National Delinquency Survey.

The delinquency rate does not include loans in the process of foreclosure. The percentage of loans in the foreclosure process was 1.40 percent of all loans outstanding at the end of the second quarter, an increase of 12 basis points from the first quarter of 2007 and 41 basis points from one year ago.

The rate of loans entering the foreclosure process was 0.65 percent on a seasonally adjusted basis, seven basis points higher than the previous quarter and up 22 basis points from one year ago. This quarter’s foreclosure starts rate is the highest in the history of the survey, with the previous high being last quarter’s rate.


The main problem here is not the current news, but the future news. We have a ton of resets coming in the first half of next year. That means this number is only going to get worse at this point.

Today's Markets

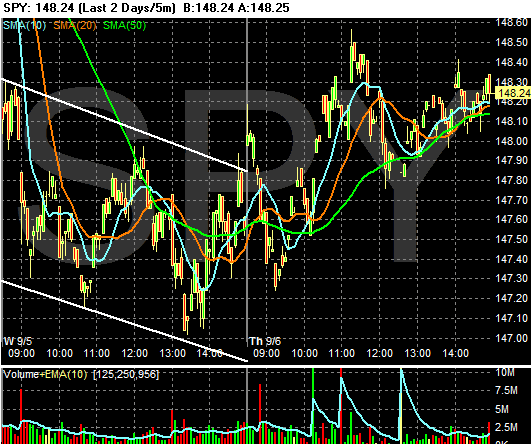
Today was pretty much a holding patterns day since most traders are waiting for tomorrow's employment report. After 11 the market traded sideways until the close.


Here's today's action at the 5-day level. It's simply more of the same sideways action.


And here's the action on the daily chart. About the only thing to notice here is the second inside day after Tuesday's move up. This is nothing more than consolidation.

About The Unemployment Number

Barry at the Big Picture nails it. Go read this now.

Food Inflation is Here To Stay

From the WSJ:

"The genie's out of the bottle when it comes to food inflation," said Michael Swanson, an agricultural economist at Wells Fargo & Co.

.....

Corn prices over the past year have reached near-record highs thanks to growing production of ethanol, which is made from the grain, as well as rising demand. Corn futures closed at $3.29 a bushel yesterday on the Chicago Board of Trade, up from about $2.89 a bushel last year.

Prices have softened some because of this year's bumper crop. U.S. farmers are in the process of harvesting 13.1 billion bushels of corn, up 24% since last year and the largest crop since 1933, says the Agriculture Department. But it's unlikely that the crop will send prices down to levels seen a year ago.

The higher grain costs have trickled down throughout production lines. Mr. Bond cited the price of corn, the predominant feed for cattle, as a problem for Tyson's beef business. Prices for live fed cattle averaged about $93 per hundred-weight through August, versus about $85 last year, said Kevin Good, senior analyst at Cattle-Fax, a cattle marketing information firm based in Englewood, Colo.

Consumers can expect to pay as high as 4.5% more for groceries and restaurant meals this year over last, according to the Agriculture Department. That means shoppers who spent $100 on groceries during an average shopping trip last year can expect to pay as much as $104.50 this year for the same groceries.


But remember -- all that matters is core inflation.

Beige Book

Yesterday, the Federal Reserve released the Beige Book.

Here are some highlights.

Most Banks reported that the recent developments in financial markets had led to tighter lending standards for residential mortgages, which was having a noticeable effect on housing activity, and several noted that the reduction in credit availability added to uncertainty about when the housing market might turn around. While several Banks noted that commercial real estate markets had also experienced somewhat tighter credit conditions, a number commented that credit availability and credit quality remained good for most consumer and business borrowers. Outside of real estate, reports that the turmoil in financial markets had affected economic activity during the survey period were limited.


The emboldened sentence is very important. In Bernanke's last big policy speech, he said he was looking for any signs the housing market was spreading beyond the housing market. Here is the hey sentence from his speech:

It is not the responsibility of the Federal Reserve--nor would it be appropriate--to protect lenders and investors from the consequences of their financial decisions. But developments in financial markets can have broad economic effects felt by many outside the markets, and the Federal Reserve must take those effects into account when determining policy.


Putting these two sentences together and the possibility of a Fed rate cut diminishes.

Here's the summary paragraph from the beginning of the document:

Retail sales were generally positive, with increases characterized as modest to moderate. However, several Districts described motor vehicle and furniture sales as slow. Manufacturing activity expanded across most Districts, with reports of softening demand for building materials and autos. The weakness in the housing market deepened across most Districts, with sales weak or declining and prices reported to be falling or flat. Most Districts reported a continuing contraction in the residential mortgage market. Commercial real estate activity was generally stable to expanding. Demand for business loans held steady or weakened, while consumer lending was mixed. Agricultural conditions varied widely across Districts, with several reporting damage to crops and pastures as a result of excessive heat and drought conditions. Activity in the energy and mining sectors remained positive in all of the Districts reporting on these sectors. Nearly every District reported at least modest increases in employment during the recent survey period. Most Districts characterized their wage increases as moderate or steady. Wage pressures were intense only in isolated professions in short supply. And most Districts reported little change in overall price pressures.


Let's take these one at a time:

Retail sales were generally positive, with increases characterized as modest to moderate. However, several Districts described motor vehicle and furniture sales as slow.


According to the latest GDP report personal consumption expenditures increased 1.4% in the second quarter. This figure was revised .1% lower. However, the latest monthly income statistics from the BEA showed a fairly good increase. In other words, a new trend of expanding personal consumption expenditures may be emerging but we need more data.

Although this month's auto sales were a decent surprise, overall auto sales have been declining for most of the year. This is a big cause for concern. As for furniture sales, the decrease shouldn't be a surprise considering the housing market is a mess and will be for sometime.

Manufacturing activity expanded across most Districts, with reports of softening demand for building materials and autos.


This has been a bright spot in the economy. Exports are doing well thanks to an expanding global economy and cheap dollar.

The weakness in the housing market deepened across most Districts, with sales weak or declining and prices reported to be falling or flat. Most Districts reported a continuing contraction in the residential mortgage market. Commercial real estate activity was generally stable to expanding. Demand for business loans held steady or weakened, while consumer lending was mixed.


Residential housing has the following problem: massive supply + constricting loan situation = falling prices. Don't expect this to change anytime soon. As for commercial, the growth in spending has been solid for the last few quarters, although I have to wonder when the problems in the residential market start to bleed over into the commercial market (or if they will).

Nearly every District reported at least modest increases in employment during the recent survey period. Most Districts characterized their wage increases as moderate or steady. Wage pressures were intense only in isolated professions in short supply. And most Districts reported little change in overall price pressures.


Employment is a huge wild card right now. First, although the official employment numbers show a very low unemployment rate, that does not jibe with "moderate to steady" wage increases. In addition, the labor participation rate is still low for this part in the economic cycle. The fed noted this situation in passing later in the report:

Though some Districts described employment condition as tight, most reported that wage increases were moderate or steady. Wage pressures were intense only in isolated professions in short supply.


I'm expect employment to get weaker. I've written about this before. The short version is construction, financial services and retail employment are all vulnerable right now.

As for prices,

Most Districts reported little change in overall price pressures.


This may give the Fed some wiggle room. Remember, the Fed has consistently stated inflation was their number one priority for the last 6 months or so. Yet that concern is completely absent from their general overview of the economy in this report.

Short version, this report shows an economy that is in fair shape. There are strengths (manufacturing) but some glaring weaknesses (auto sales and housing). The employment situation is a conundrum.

Wednesday, September 5, 2007

BCA Projects Subprime Losses at $200 Billion

From BCA Research:

About 60% of subprime mortgages carry an adjustable rate, and $650 billion will reset at a higher interest rate in the next 16 months. Even without factoring in a recession, we estimate that the losses on bad subprime and alt-A paper could amount to about $200 billion over the 2007-2011 period (1.5% of today’s GDP). This compares with $153 billion (2.5% of 1990 GDP) in losses associated with the S&L meltdown in the late 1980s. Spread out over several years, such losses do not seem overwhelming on their own. However, it is the knock-on effects that are the larger risk to the economy, including a hit to consumer confidence and wealth, a curtailment of credit availability, and increased selling pressure in the housing market. Bottom Line: Fed rate cuts cannot solve the subprime mess, but can limit the negative impact on the economy.


I can't comment on the veracity of this analysis. Consider it merely food for thought.

Today's Markets

The market sold-off today. There are plenty of reasons. The ADP employment report didn't help, nor did the 12% drop in pending home sales. However, once the market dropped at the open, it traded in a range for the rest of the day. In addition, it didn't close on a low point.


Here's the 5-day chart. This helps to place today's sell-off in a bit more context. First, note the average broke the 5-day uptrend. However, also note the market sold-off to about the 38.2% Fibonacci level. Finally, note the average had support right at the $147 level. My guess is there were some buy programs activated at that level.


Finally, here's the daily chart, which really puts today's action in a better perspective. Notice we have a pretty clear inverted head and shoulder formation with two possible necklines. Also note today's price action was an inside day. The short version is today's sell-off was hardly fatal to the markets recent upward move. My guess is traders were simply using today's negative news as a reason to sell.


Finally, here's the same chart with the SMAs. Notice we are still above the 200 day SMA.


However, it's important to note the problems with the market listed in the post below. The transports aren't confirming this upward move and the new highs/new lows are not encouraging. While the market can still move up in this environment, the lack of confirming action means there isn't as much support for the move in the broader market. That means the market is probably still susceptible to sudden downward moves.

Transports Aren't Confirming Rally; New Highs/New Lows Not Advancing

There are two big warning signs with the current market.

1.) The transportation average is not confirming the recent run-up.


The new highs/new lows are still neutral at best.

NY New High/New Lows


NASDAQ New Highs/New Lows

ADP Employment Report Shows Weak Job Growth

From CBS.Marketwatch

Employment in the U.S. private sector grew by 38,000 in August, the weakest in four years, according to the ADP employment report released Wednesday.

The ADP report suggests nonfarm payrolls may have grown much slower than the 120,000 anticipated by economists. See Economic Calendar.

It was the second straight weak reading in the ADP index; July's reading was revised lower to 41,000 from 48,000 initially reported.

"A deceleration of employment may be under way," ADP said in a release.


First, there is some debate about the accuracy of both the BLS data and ADP data. The BLS data has to deal with the birth/death model adjustments, and the ADP data is a fairly new statistic that is still getting the kinks out.

That being said, this is not the news the economy wants to hear. However, it does play into the bad news = good news because it adds to the possibility of a Fed rate cut at the September meeting.

We'll know more with the Beige Book's release later today.

I've looked at several employment areas that will probably be the first to show weakness here

Commercial Real Estate Also Taking A Hit

From Bloomberg:

U.S. commercial real estate prices may fall as much as 15 percent over the next year in the broadest decline since the 2001 recession as rising borrowing costs force property owners to accept less or postpone sales.

``People aren't willing to do deals right now,'' said Howard Michaels, the New York-based chairman of Carlton Advisory Services Inc., which has arranged financing for real estate purchases including the Lipstick Building in midtown Manhattan. ``The expectation is that prices will come down.''

Investors in July bought the fewest commercial properties since August 2006 and apartment building acquisitions were down 50 percent from June, data compiled by industry consultants at New York-based Real Capital Analytics Inc. show. Archstone-Smith Trust in August postponed its $13.5 billion sale to a group led by Tishman Speyer Properties LP until October. Mission West Properties Inc., the owner of commercial buildings in Silicon Valley, said on Aug. 13 that the company's $1.8 billion sale may fail after a bank withdrew funding.

Assuming A Market Rebound, Where Will We See Movement?

I have been speculating the Fed's announcement last Friday essentially placed a floor under stock prices (at least for now). So the question now becomes where will the money go?

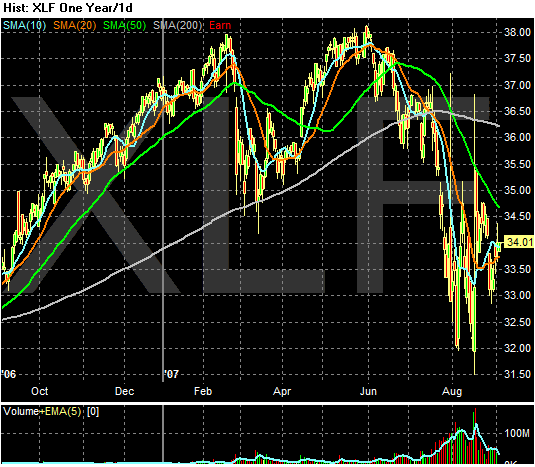
It won't be financials. The market has sold-this sector off and there is no reason to think this trend won't continue. Analysts are lowering their earnings estimates for a variety of industry players, there is concern about the commercial paper market, and the mortgage market is in turmoil. Traders have been selling this area of the market for the last few months and there is no reason to think this trend won't continue.


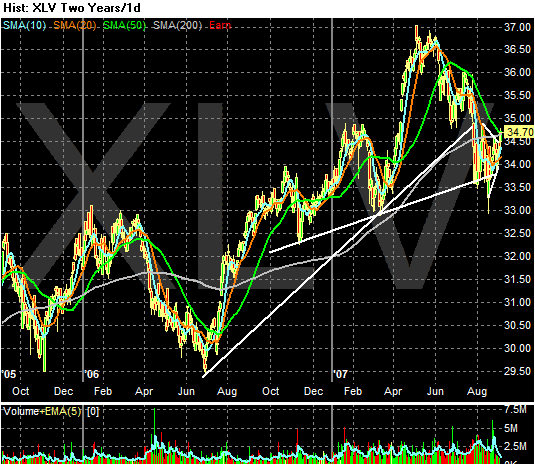
Health Care is a possibility. While this sector broke a two year uptrend in the last market sell-off --


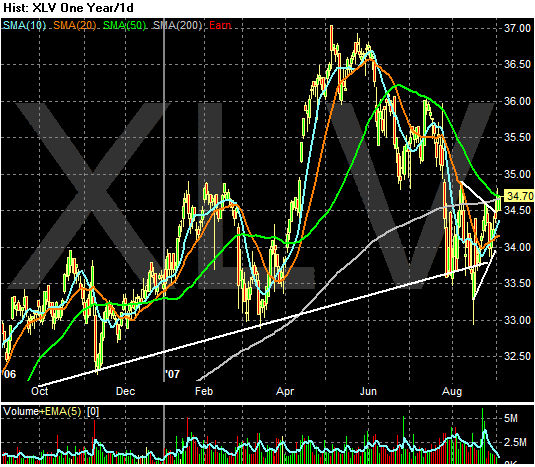
It is currently sitting on a a shorter trend line. In addition, this is considered a safer market area to invest in. People are always getting sick. While this area isn't as sexy as the latest IPO, that's the point. As market participants start to look for possible safe havens this sector may benefit.


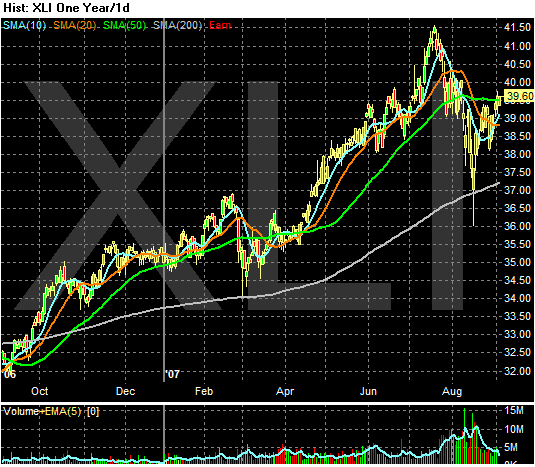
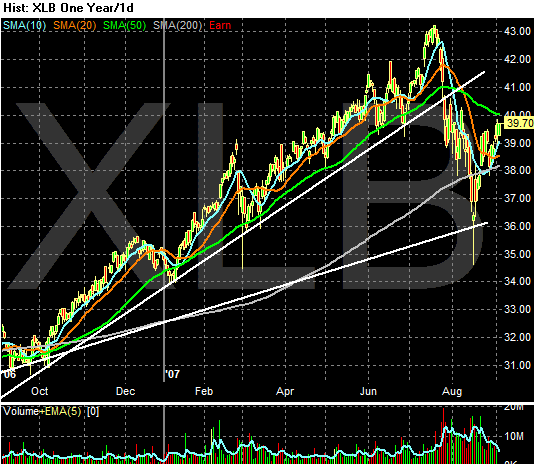
There are two other areas that look interesting. The first is the industrials/basic materials play. India and China are still growing. Other regions are as well. The dollar is cheap. Take all of these factors together and you have a recipe for higher earnings. Both the Industrials (XLI) and basic materials (XLB) sectors have sold-off to technically meaningful levels. Price action over the last few months may have formed a cup and handle formation, possibly signaling more upward movement. My guess is the latest sell-off is simple profit taking in a choppy market. It's important to look for companies that have international exposure here.

Industrials


Basic Materials.


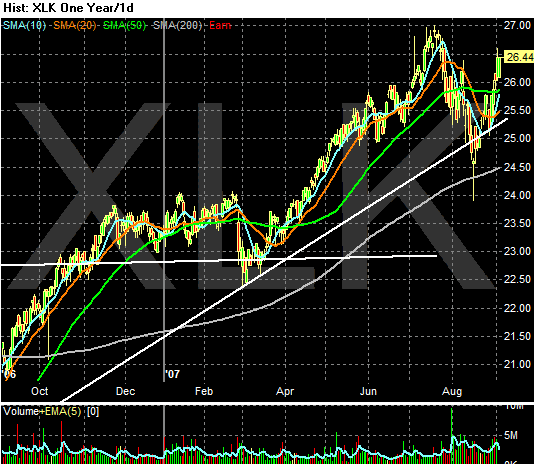
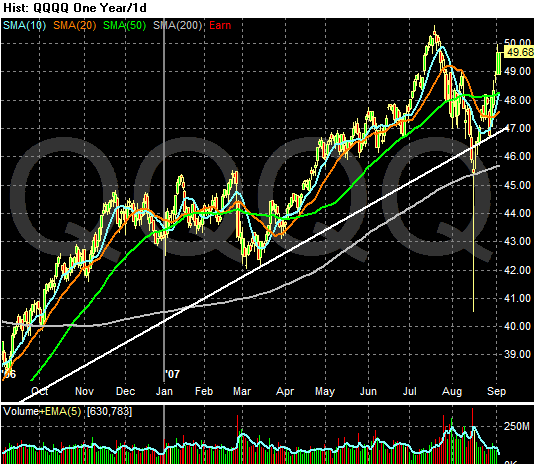
Finally, there is tech. It has been forever since I have said tech looks good. But the charts are showing these sectors are starting to see some action. In addition, there isn't any mortgage exposure. Assuming the rest of the world continues to grow, this sector may benefit.

Tech ETF


QQQQs

Tuesday, September 4, 2007

Wheat Prices Surge

One of the main problems I have with Fed policy is their annoying reliance on core inflation as a primary inflation indicator. This is fine when food and energy prices are rising on a regular basis. But with India and China growing at high levels, it's not too off-the-wall to think basic commodities like food and energy will have continuing price increases.

Here is the latest from the wheat market:

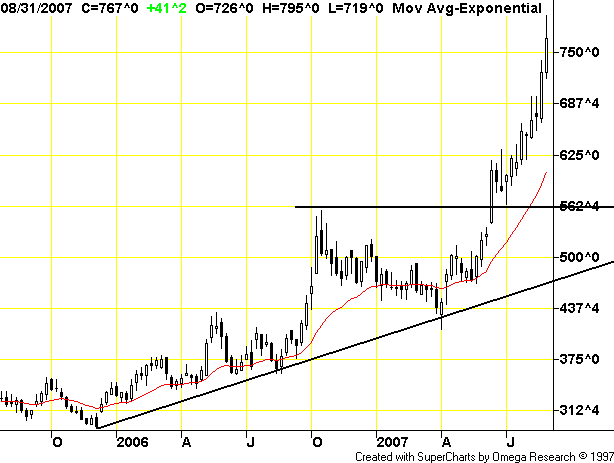
Wheat prices piled on 30 cents a bushel within the first minutes of trading -- the maximum limit permitted by the Chicago Board of Trade -- and rose to an all-time high of $8.055 a bushel. Wheat has been trading in record territory for weeks amid worsening supply concerns. Poor weather ravaged crops in the U.S., Europe and the Black Sea region this year, and now conditions in the Southern Hemisphere as it enters the growing season don't seem much better. At the same time, high market prices haven't deterred global demand.


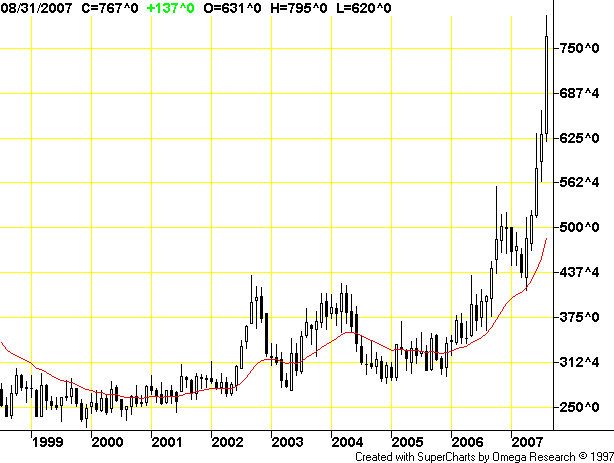
Here's a weekly chart of wheat which goes back a few years. Notice how prices are increasing at a fairly consistent rate.


Here's a monthly chart. Notice how we're clearly in new pricing territory.


Most importantly, here's a chart of the Goldman Sachs Agricultural price index. Notice that wheat prices aren't the only prices increasing -- it's happening across the agricultural price spectrum.

Today's Markets

Today's market action illustrated a point I made over the weekend. The market is clearly anticipating a Fed rate cut in September. As such, there is little downside in the market right now. Bad news simply adds to the perception the Fed will cut rates while good news means the economy is in fact doing well.

While the market started lower today it rallied throughout the day. While the market sold-off on high volume at the end, this shouldn't be too surprising. The market made a strong advance today and my guess is traders were taking profits off the table.


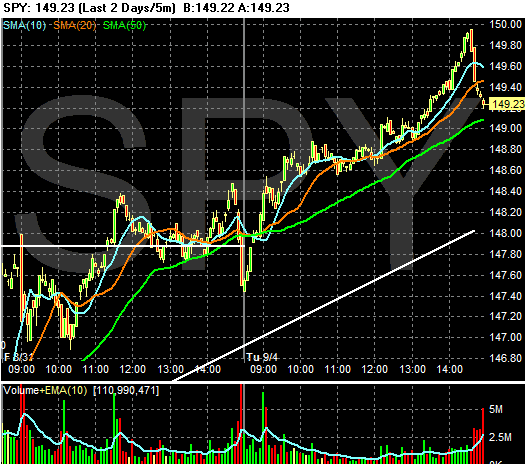
Here's the 5-day, 5-minute chart. Notice the uptrend we started mid-last week is still firmly intact.


Here's the 3-month daily chart. Notice we are starting to move away from the cluster of activity around the 200 day SMA and are going into rally mode.

More On Employment

From Mish:

Now that housing is dead I keep asking "what is the next big source of jobs?" No one has yet come up with an answer.

It clearly is not Wall Street, financials, credit card growth, consumer spending, retail, commercial loans, leveraged buyouts, or capital spending. Whatever it is (if it is indeed anything at all) can it possibly make up for expected declines in housing, financials, credit card growth, consumer spending, retail, commercial loans, and capital spending?

Health care has been strong. But can it make up for declines in all the other areas? It does not take a genius to figure out the answer to that question is no. We all can't get rich off Medicaid and Medicare can we?


I agree. There is no segment of the economy that has clearly demonstrated it can be the next big wave of jobs growth. And that should concern a lot of people.

About the Commercial Paper Market

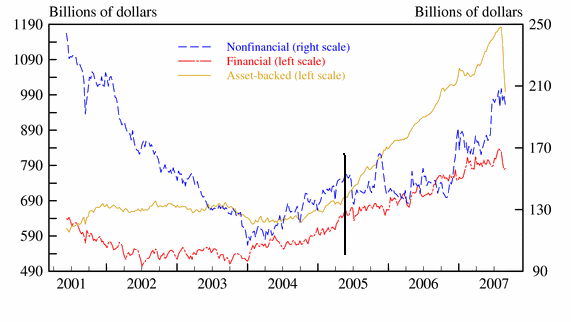
This is a chart from the Federal Reserve's Commercial Paper page. Notice the asset-backed commercial paper market has two periods on this chart. I delineated the different periods with a solid black line which I basically eyeballed.

Here is the point: is it possible the asset-backed commercial paper market is simply reverting to a mean? I don't have an answer for this. But notice the incredibly large increase in paper over the last few years.

Construction Spending Decreases .4%

Link to the report from the Census Bureau.

Overall construction spending decreased (-.4%) from June 2007 and (-2%) from July 2006.

Residential spending decreased (-1.4%) from June 2007 and (-15.6%) from July 2006.

Non-residential increased .6% from June 2007 and 13.9% from July 2006.

Non-residential construction has increased from 46% of all construction spending in July 2006 to 53% in July 2007.

The bottom line is non-residential construction continues to grow at a rate to absorb residential losses. This is good news for the construction employment sector which is an area that we should be watching for signs of weakness.

Car Sales Aren't Doing Well

From Bloomberg:

The pace of car and truck sales in the U.S. has dropped for seven consecutive months, the biggest string of declines in at least 31 years, according to data compiled by Bloomberg. Economists forecast little change for August when car makers report sales figures today.

Is the Possibility of a Recession Increasing?

From Bloomberg:

The pain from higher borrowing costs may be spreading as consumers and businesses follow investors in shying away from risk, increasing the odds of a recession.

``While there is no basis for predicting a recession right now, the risks have surely gone up,'' says former Treasury Secretary Lawrence Summers, now a professor at Harvard University in Cambridge, Massachusetts. ``The combination of softness in the housing sector, contractions in credit, increased uncertainty and volatility, and losses in wealth make the chances significantly greater now.''

Economists at JPMorgan Chase & Co., Lehman Brothers Holdings Inc. and Merrill Lynch & Co. are among those lowering economic forecasts as the rising cost of credit prolongs the worst housing recession in 16 years. Now, two areas of the economy that have held up well so far, jobs and consumer spending, no longer appear immune to the fallout.


This prediction has been making the rounds on the internet.

Because of the problems in the credit market, many economists have lowered their overall predictions for economic growth. This shouldn't surprise anyone.

In addition, the two emboldened areas above have shown some weakness.

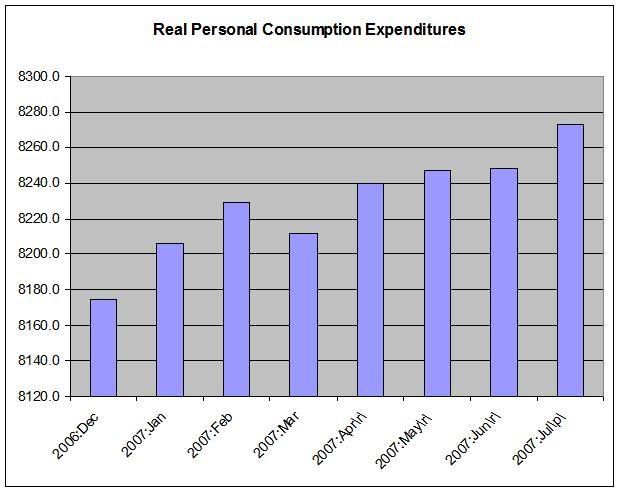
Here's a chart of personal consumption expenditures. The chart uses seasonally-adjusted annual rates in chained 2000 dollars. Notice we don't have a nice consistently upward sloping pattern. Instead, spending appears to have slowed over February to June of 2007. During this period gasoline prices were abnormally high. While gas prices have decreased since then, the consumer has faced two other issues that would crimp spending: a drop in stock prices which lower household net worth and the continued-fallout from the housing slowdown. Both of these have negatively impacted consumer confidence. Finally, the BEA lowered personal consumption expenditures to 1.4% growth in the latest GDP report. In summation, consumer spending as represented by the PCE expenditures from the BEA is an area of concern going forward.


Employment is a second area of concern. There are three areas to keep an eye on.

Construction Employment

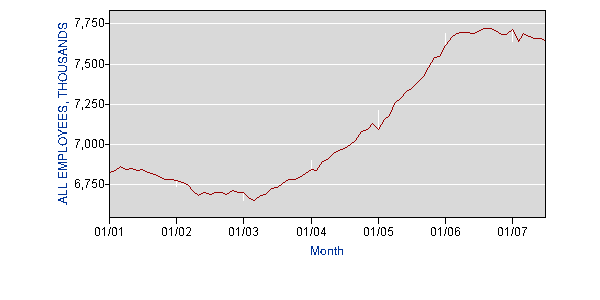
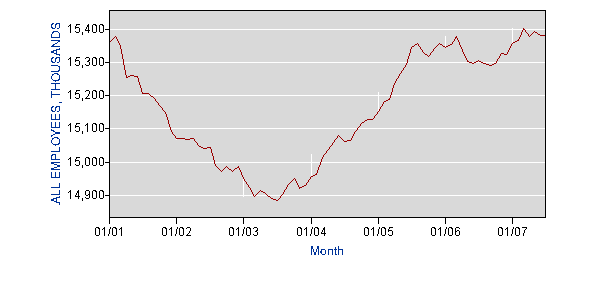
Here is a chart from the BEA which shows construction employment since January 2001. Despite the drop in residential construction construction employment has barely dropped. There are two probable reasons for this.

1.) Non-residential construction has increased over the last year, absorbing lost residential jobs.

2.) Illegal labor's role in the construction area.


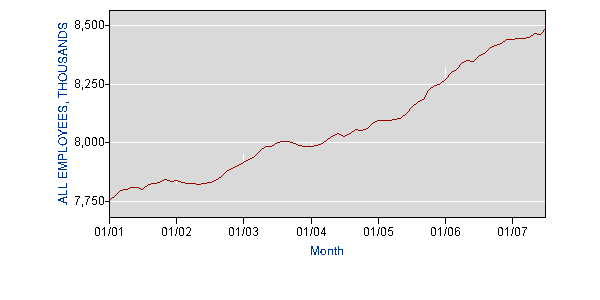
Financial services employment has shown continued advances over the last year. However, mortgage market problems started at the end of last year and show no sign of stopping. I wouldn't expect this employment sector to maintain the growth it has shown.


With the slowdown in consumer spending, retail employment has been stagnant for the last few months. A continued slowdown in consumer spending would obviously negatively impact this area of employment.


The short version is none of these areas is at a recessionary level yet. But both areas are clearly slowing in their rate of overall growth. In other words, we need to keep an eye on these levels going forward.

Monday, September 3, 2007

Fed Retreat Has Negative Tone

From Bloomberg:

Federal Reserve Chairman Ben S. Bernanke's pledge to stop the credit-market rout from wrecking the economy failed to quell concern at the Fed's Wyoming summer retreat that the U.S. is heading for recession.

``I came to Jackson Hole thinking there would be no recession, but I'm leaving thinking we could well have one,'' said Susan Wachter, a professor at the University of Pennsylvania's Wharton School, who co-wrote the first academic paper presented at the conference.

``There are no optimists in the crowd here,'' said Ethan Harris, chief U.S. economist at Lehman Brothers Holdings Inc. in New York and a former head of domestic research at the New York Fed. ``There's a pretty strong consensus that this has gotten a lot more serious.''


My guess is Ben is getting an earful about what he should have done rather than what he has done. As to whether or not he will listen is a different story. In addition, there is no guarantee all of the negativity is correct. Remember, the market has been tainted by 18 years of "easy Al, and his liquidity flooding band". In other words, people are use to rate cuts whenever there is a problem in the market.

Sunday, September 2, 2007

Has the Fed Removed Downside Risk?

I have been thinking about his paragraph from Bernanke's Friday speech.

It is not the responsibility of the Federal Reserve--nor would it be appropriate--to protect lenders and investors from the consequences of their financial decisions. But developments in financial markets can have broad economic effects felt by many outside the markets, and the Federal Reserve must take those effects into account when determining policy. In a statement issued simultaneously with the discount window announcement, the FOMC indicated that the deterioration in financial market conditions and the tightening of credit since its August 7 meeting had appreciably increased the downside risks to growth. In particular, the further tightening of credit conditions, if sustained, would increase the risk that the current weakness in housing could be deeper or more prolonged than previously expected, with possible adverse effects on consumer spending and the economy more generally.


I should add at this point that I am a lawyer by training, so I have a tendency (perhaps an annoying tendency) to over-analyze written statements. Hey -- that's what I get paid to do.

Anyway.....

Here's the short version: the Fed won't bail out lenders who made bad loans, but will lower rates if the current credit market problems start to slow down economic growth.

Let me play out a few scenarios that have been running through my head the past few days.

1.) Friday's employment report stinks. The market would interpret this as a sign the economy is slowing and the Fed would lower rates. Therefore, the market rallies.
2.) Friday's employment report is strong. The market would interpret this as a sign the economy is doing well; the credit market problems are contained. The markets rally.

3.) Tuesday's construction report is weak. The market would interpret this as a sign the economy is slowing and the Fed would lower rates. The market rallies.

4.) Tuesday's construction report is strong. The market would interpret this as a sign the economy is doing well; the credit market problems are contained. The markets rally.

5.) Let's say a slew of hedge funds report they have massive losses. The market would probably interpret this as a reason to rally because the cumulative damage to the markets would slow the economy.

Do you see where I am going with this? No matter what happens the lens through which market participants view the market would see a reason to rally.

Now, remember below when I was looking at the market I advanced the idea that the SPYs are currently forming a reverse head and shoulders pattern? This is typically a bottoming formation -- something that happens at a market bottom. Assuming the above analysis to be correct then we could start to see the SPYs rally from here.

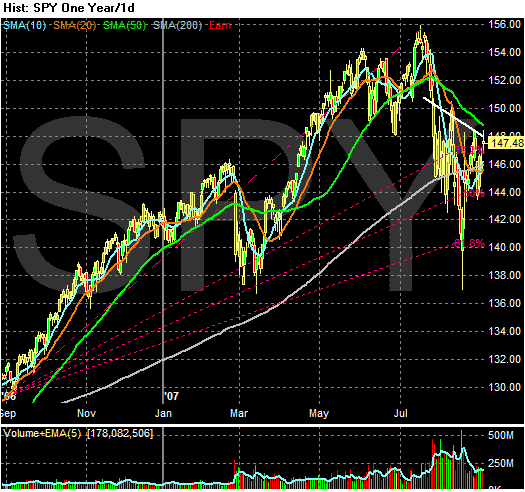
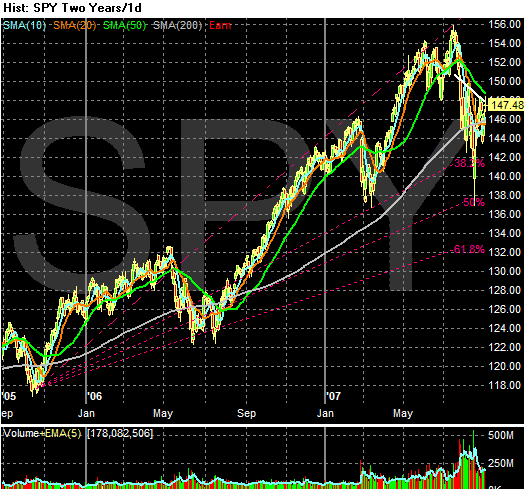
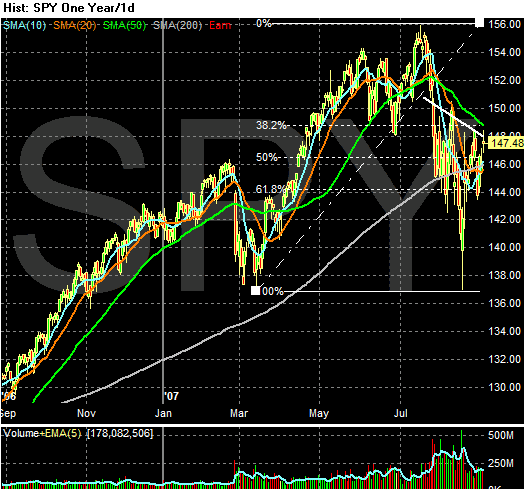
Also, here are four more charts of the SPY. The first two use Fibonacci fans and the second two use Fibonacci retracements. Notice that with all of these charts the market is at a technically important Fibonacci level. That means the probability of something happening is higher to traders who use Fibonacci analysis.


As with all technical analysis, remember this caveat: the markets have many tools to make an ass out of you, and will use those tools to your disadvantage at all possible times.

The Week Ahead

So -- what do we look for now that the Fed has announced it won't bail out stupidity but will bail out a slowing economy? The answer is pretty simply: signs of a slowing economy.

So - next week we have construction spending, ISM manufacturing and auto sales on Tuesday. All of these are important numbers.

The Redbook is on Wednesday. This might be more important than usual.

On Friday we get employment. This is the biggie. The primary argument from the bulls is the employment situation is a strong reason why the economy is doing well. That makes this number doubly important.