Saturday, October 19, 2024

Weekly Indicators for October 14 - 18 at Seeking Alpha


 - by New Deal democrat


My “Weekly Indicators” post is up at Seeking Alpha.

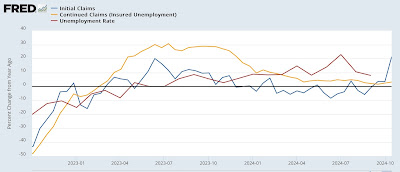
As per the analysis of monthly data that I wrote about this week, hurricane season continued to complicate the high frequency data as well. With that very big caveat, the underlying tone remained positive.

As usual, clicking over and reading will bring you up to the virtual moment as to the economic situation, and reward me a little bit for reporting and organizing it for you.

Friday, October 18, 2024

Despite Helene, housing permits and starts stabilized in September; but construction based yellow flag remains


 - by New Deal democrat


Much of the data that is being released, like yesterday’s jobless claims data, has to be viewed with an asterisk after it, because of hurricane disruptions. As an addendum to yesterday’s industrial production report, I failed to mention that the BEA that “the effects of two hurricanes subtracted an estimated 0.3 percent” from the total. Even with that increase, production would have been unchanged and manufacturing construction down -0.1%, and both would remains slightly down YoY, so the ultimate conclusion remains the same.

Similarly, Hurricane Beryl in July interfered with construction in July, and then permits and starts bounced back in August. Helene may have affected this month’s report, and Milton almost certainly will affect next month’s as well. Treat that as applying an asterisk to the analysis below.

The most leading metric, housing permits (gold), declined -42,000 to 1.428 million. Single family permits (red), which are just as leading and have very little noise, rose 3,000 to 970,000, the highest since April. Housing starts (blue), which tend to lag permits by a month or two, and are much more noisy, declined -7,000 to 1.354 million. All of the above were affected by very slight revisions to August:


All of this is a rebound from lows earlier this year, and it is what I have been expecting.   As I wrote two months ago, “we can expect permits to rise in the next several months, followed by starts,” for the simple reason that for 60+ years, mortgage rates have always led housing permits. And indeed that seems to have happened, given the downturn in mortgage rates (black in the graph below) this year (despite the increase in the past few weeks). :


That’s the good news. The bad news is that units under construction, the measure of real economic activity in this sector, declined another -28,000, and is now down -13.3% from its peak. This is very important, becuase while it is not so leading as permits and starts, it has always turned down, typically by more than -10% before a recession begins (the average is -15.1% and the median is -13.4%).  Here is the long-term graph comparing total permits (red, right scale) with housing units under construction (blue, left scale):


Here is the post-pandemic view:


Last month I hoisted a yellow flag “recession watch” for the construction sector, based on this metric being down more than -10%. It is now at the level consistent on average in the past with the onset of a recession.

While there had been a long time after single family construction turned down while multi-unit construction continued to increase and then plateaued, but this year both have declined. As shown below, multi-unit construction has continued to plummet, but the silver lining is that single family units under construction have remained stable for the past three months:


Further, as shown in the long historical view of housing units under construction and permits above, with one exception (the tech producer-centered recession of 2001), in the case of recessions, permits continued to decline sharply even after housing units under construction crossed the -10% threshold and well after recessions had begun. 

In our present situation, if I am correct that permits have bottomed and are starting to increase again, then housing units under construction will not decline too much further before bottoming as well. 

I concluded this review last month by saying “my base case is that this period of weakness is likely to turn around without a recession occurring. That’s why at this point there is only a housing sector ‘recession watch,’ meaning a heightened possibility, and not a ‘warning,’ meaning one is more likely than not. That continues to be my view - a period of softness without a recession - so long as mortgage rates continue to be lower than they were last year. With a hurricane asterisk.

Thursday, October 17, 2024

Real retail sales increased in September, but concern - and their yellow flag - continue


 - by New Deal democrat


A periodic reminder, real retail sales is one of my favorite economic indicators, because it tells us so much about the state of the consumer, and since consumption leads employment, it is a short leading indicator for that as well.


In September retail sales in August rose 0.4% on a nominal basis. After adjusting for inflation, they rose 0.3%. The below graph norms both real retail sales (dark blue) and the similar measure of real personal consumption of goods (light blue) to 100 as of just before the pandemic:


Despite the improvement in the past three months, over the longer term since the end of the pandemic stimulus in spring 2022, real retail sales have been trending generally flat to slightly declining, while real personal consumption expenditures on goods have continued to increase.

On a YoY basis, real retail sales continue to be negative, at -0.7%, which remains problematic as it has all this year:


That’s because, over the past 75 years, a negative YoY comparison in real retail sales has usually meant recession. Obviously that wasn’t the case in 2022 and 2023, but at some point the historical relationship is likely to be valid again.

Finally, since real sales are a good if noisy short leading indicator for employment, here is the above YoY graph adding YoY payroll gains (red):


This forecasts that the YoY comparison in job reports is likely to continue to fade, despite the excellent September report. Future reports in the range of 75,000 to 175,000 appear more likely. Here is the post-pandemic close-up:


I began to be concerned about this series four months ago. Three months ago I said “The yellow caution flag is up,” and two months I concluded by saying that “the longer real retail sales go without posting a positive YoY number, the more concerned I will be.”Finally, last month I wrote that “This real retail sales report puts … really puts the pressure on initial jobless claims.”

Well, for the last two weeks even excluding hurricanes initial jobless claims have trended higher YoY - not enough to raise a yellow flag in that series, but nevertheless suggesting that the relative weakness in real retail sales, despite this good month, may be beginning to affect the jobs market. Because consumption still leads employment.

The shallow downturn in industrial production continues


 - by New Deal democrat


Before I get to the (relatively) good news in retail sales, let’s take a look at the bad news from industrial production.


On a monthly basis, production declined -0.3%. Manufacturing declined -0.4%. There were also downward revisions to last month. Both of these continue to slowly fade from their 2022 peak:


On a YoY basis, production is down -0.6%, and manufacturing production is down -0.4%:


For all intents and purposes, manufacturing has been in a shallow recession since late 2022, and that recession continues. This is something that has been well telegraphed by both the regional Fed new orders reports as well as the monthly ISM manufacturing report.

The only reason not to be more concerned is that, since the accession of China to regular trade status in 1999, production has stalled on a longer term basis, and there have been several equivalent or worse downturns without any recession having occurred, most notably in 2015-16:


Still, this is not good news, meaning that the burden is on construction and consumer spending on services to carry the economy forward to avoid recession.

Initial claims: *maybe* the onset of a concerning trend, but there are distortions galore


 - by New Deal democrat


As I indicated yesterday, today’s initial jobless claims report was particularly challenging, due to hurricane effects and unusual seasonal adjustments. The Columbus Day holiday may also have affected the numbers.


To cut to the chase, even after accounting for distortions, the number was very elevated YoY, which if it continues will be a real cause for concern.

First, let’s do the typical roundup. Nationally, initial claims declined -19.000 to 241,000. The four week average increased 4,750 to 236,250. With the typical one week lag, continuing claims rose 9,000 to 1.867 million:


On the YoY% basis more important for forecasting, without any special adjustments initial claims were higher by 19.3%, the four week average by 12.2%, and continuing cliams by 3.3:


If there were no special factors, the big YoY jump in initial claims would warrant a yellow caution flag.

The elevated claims numbers for the first two weeks of October preliminarily forecast a jump in the unemployment rate in the next monthly jobs report as well (here shown at the YoY% changes in each):


Now let’s look at the hurricane and other adjustments compared to last week (the graphs won’t be up at FRED until tomorrow, so I’ll just list the numbers).

On a nationwide basis, non-seasonally adjusted initial claims, at 224,763, were 42,369 higher than one year ago, or by 23.2%.

Last week Michigan and Ohio showed a big spike in initial claims. Per the DoL, this appears to have been motor vehicle production related layoffs. This week Michigan’s numbers declined -7,812 and Ohio’s -2,532. Still compared with one year ago, the two State’s numbers were higher by 2,237. In other words, most but not all of the spike has disappeared this week.

Surprisingly, Florida also showed a big decline this week, down -3,428. On a YoY basis, Florida’s claims were only 107 higher than last year. Either Milton won’t show up until next week, or the damage may have been so severe that people couldn’t file their initial claims yet. Either way, a huge jump is almost certainly going to happen within the next week or two.

North Carolina, by contrast, continued to have very elevated claims YoY, up 5,603 vs. last year.

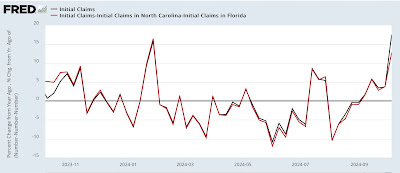
Which means, combined, the two hurricane affected States contributed only 5,710 to the 42,369 nationwide increase. Thus the YoY% increase excluding those two States remains 21.2% - a very big jump (note that graph below does not include this week’s State numbers (red) for NC and FL):


But that brings us to the last issue, which is the effects of the national holiday. Remember that last week there was a 5% disparity in the YoY comparisons in favor of the non-seasonally adjusted measure. This week that reversed, with a 4% disparity in favor of the seasonally adjusted measure. Here’s what the YoY comparisons look like for both:


Last year’s 202,000 seasonally adjusted claims number was one of the lowest of the entire year, meaning that the YoY comparison this week was especially difficult. Against either the week before or after this week last year, YoY claims would only be higher by about 7%.

The bottom line is that the hurricanes are continuing to have a significant effect on jobless claims, but that even accounting for those, on a YoY basis claims remain quite elevated. But because of the holiday distortions, we will have to wait at least one more week to see if this is really the beginning of a concerning trend.

Wednesday, October 16, 2024

Why hurricane effects and funky seasonal adjustments will make tomorrow’s initial cliams report particularly fun


 - by New Deal democrat


The drought in new economic data continues through today. We’ll make up for it all at once tomorrow with jobless claims, retail sales, and industrial production. 

In the meantime, last week I noted that Hurricane Helene’s impact in Florida and North Carolina was a big part of the reason for the spike in initial claims. Let me follow that up further today.


To begin with, State by State initial claims data is only available on a non-seasonally adjusted basis. So the best way to look is YoY. So all of the graphs below are presented in that format. To show the effect of hurricanes, what I have done in the past is subtract the data from the one or more States most affected by the event, and look at the YoY data for all of the rest of the States for the corrected nationwide picture ex-hurricane.

To begin with, here is Katrina in 2005, showing nationwide YoY claims (blue) vs. claims ex-Louisiana (red):


Including Louisiana, claims went up 30% and stayed elevate for five weeks thereafter, even as claims for the rest of the country were lower YoY.

Here is Sandy:


Sandy’s effect on NY and NJ similarly caused a one week spike to 30% higher YoY, and remained elevated compared with the remainder of the county for four more weeks.

Here is Harvey, which impacted the Houston area in 2017:


Claims spiked higher by about 15%, and remained elevated compared with the remainder of the country for two more weeks.

Now here is the situation as of last week, comparing the nationwide situation with that excluding Florida and North Carolina (gold), the two States most affected by Helene:


Nationwide claims were up 17.5% YoY. Excluding Florida and North Carolina, they were up 12.8% - still quite elevated.

As I mentioned last week, there were also spikes in Michigan and Ohio. I am not sure of the reason, but there may have been auto or transportation related strikes affecting those States. So the below graph shows the comparison excluding those two State in gold:


On that basis, claims were up 12.5% YoY.

Now, let’s exclude all four States:


Claims were up 7.1%. This is still elevated, but is in line with the trend in the previous month, which as I have noted has been higher YoY, but not by nearly enough to set off recession alarm bells.

I suspect the Michigan and Ohio numbers will return to normal tomorrow (as always, we’ll see!). Based on the previous three episodes shown above, I also expect North Carolina’s spike to recede somewhat. Florida, of course, was hard hit by Milton last week, and so we can expect an even bigger spike there.

Finally, there was one other unusual factor in last week’s number.

You would expect the YoY% comparisons for seasonal and non-seasonal data to be identical - since after all, a YoY comparison by definition takes out seasonality! But last week was one of those rare weeks where that wasn’t the case. The below graph shows the seasonally adjusted (gold) and non-seasonally adjusted (blue) YoY% changes for the past two years:


If you look at the far right, last week was one of the biggest variances in that entire time, as seasonally adjusted claims were up 22.3% vs. 17.5% for non-seasonally adjusted claims.

Typically these variances go away after one or two weeks, as in January 2023 and July of this year. 

All of which is going to make tomorrow’s initial jobless claims report particularly fun, as all three factors - Helene receding, Milton crashing in, and the funky SA vs. NSA variance possibly being resolved - all will be in play. 

Tuesday, October 15, 2024

Household balance sheets are in good shape


 - by New Deal democrat


 One of my fundamentals-based systems for monitoring the economy is to look at the health of household balance sheets.


Most recessions happen when consumers are under stress. If real wages are growing, if assets that can be leveraged or cashed in (mortgage payments, home equity, stocks) are increasing in value, if monthly debt payments are not increasing, then there is no reason for consumers to pull back, and economic expansions continue. It is only when all of these conduits for spending are constricted that recessions typically occur.

And at present, households are generally in good shape. None of the avenues of spending power have been constricted.

To begin with, real hourly and weekly wages have been increasing steadily since their June 2022 lows:


Values in the above graphs are normed to 100 as of January 1973, the previous all time high for both series. There is also some immediate post-pandemic distortion due to the fact that the 2020 layoffs were heavily tilted towards lower income laborers. Thus the averages increased. Even so, real average hourly wages are presently at all time highs except for several months in spring 2020, while real weekly wages are at 2.5 year highs, and above all pre-pandemic levels except for 1973.

In terms of assets that can be cashed in or borrowed against, I’ll spare you the graphs, but suffice it to say that both real, inflation adjusted home prices, and stock prices, are at all time highs - the latter having made another such all-time high only yesterday.

Finally, here is the long-term historical look at mortgage, non-mortgage (left scale), and total (red, right scale) debt services payments of households as a percent of disposable income:


While these have risen through Q2 of this year, the last data available, along with the Fed’s interest rate hikes, they are at pre-pandemic average levels.

Here is a close-up of the last five years:


What is noteworthy in this zoomed in look is that total debt service payments as a percent of income stabilized once the Fed was done hiking rates. If a recession were in the offing, I would expect this ratio to be continuing to increase. What this tells me is that average households’ debt service payments are well in line, despite being higher than their immediate post-pandemic historic lows.

In summary, real household wages and asset values are in good shape. The Fed rate hikes did not overly stress their balance sheets. There is no evidence households have been reining in spending. There is every reason to believe that the economic expansion will continue in the next few months.

Monday, October 14, 2024

For Indigenous Persons Day: a review of “A Brave and Cunning Prince” by James Horn


 - by New Deal democrat


Recently I read the above entitled book, and found it fascinating. Below are excerpts from an online book review, to which I have added further detail in brackets. I highly recommend it:


“In the mid-sixteenth century, Spanish explorers in the Chesapeake Bay kidnapped an Indian child [whose name they wrote as ‘Paquiquineo’] and took him back to Spain and subsequently to Mexico. [He may not have been kidnapped at all. There is evidence that many of the Indians who went to Europe did so of their own free will, especially younger warriors who were up for a Big Adventure.]  The boy converted to Catholicism and after nearly a decade was able to return to his land with a group of Jesuits to establish a mission.’ [During that time, he was treated as a  prince, I.e., visiting nobility, in Spain, even having an audience with Emperor Charles V. In fact, Indian nobility was treated similarly in Spain. There are descendants of Montezuma who married Conquistadors, settled with them in Spain, where the mansions and estates survive to this day. When he was taken to Mexico for several years on his way home, he got to know some of the Aztecs and other tribes, and both learned and saw how the Spanish treated them as virtual slaves. 


Based at least in part on that experience,] “Shortly after arriving, he organized a war party that killed the Spaniards.”[one Spaniard - a young servant/altar boy - was spared, despite his desire to be martyred rather than live among the heathens. When the next Spanish vessel arrived, he escaped and told the Spanish what happened. In an ensuing battle, many Indians were killed, and about 30 warriors were hung from the ship’s yardarms. But Paquiquineo’s plan succeeded in stopping any further Spanish exploration of the Chesapeake.]


“In the years that followed, Opechancanough (as the English called him), helped establish the most powerful chiefdom in the mid-Atlantic region, [including possibly killing some of the survivors of Raleigh’s ‘lost colony’. About 4 decades after the Spanish,] When English settlers founded Virginia in 1607, he fought tirelessly to drive them away, leading to a series of wars … and came close to destroying the colony. [His strategy was the same, engaging in a ‘long con’ designed to lull the settlers into complacency, even admitting Indian visitors into their dwellings often with no concern, after which his warriors suddenly and all at once fell upon the settlers at multiple locations, killing at least 1/3rd of them.]

[In an echo of what happened with the Spanish, his plans were thwarted by an Indian boy named Chanco, who had been sent to live at a settler’s farm in order to learn their language and customs. When a warrior told him of the planned massacre, Chanco warned his English friends instead. They in turn warned the Jamestown settlement in time to defend itself. Chanco was rewarded with 100 acres of land, which to this day is known as “Chanco’s Hundred” on the outskirts of Williamsburg.]

[As an aside, an English boy named Thomas Savage was sent to live with Powhatan’s tribe. He was well treated, but ultimately fled when he feared a massacre was impending. Powhatan was emotionally wounded, telling Savage he had nothing to be afraid of. Ultimately Savage was given a large tract of land by a friendly Chief on the eastern shore of the Chesapeake. The farm stayed in the family for 200 years, and even now is known as Savage’s neck.]

“He [Opechancanough] survived to be nearly a hundred years old and died as he lived, fighting the invaders [he was captured and imprisoned, and one of the guards shot him to death. He is buried near Chief Powhatan in a mound in a small reservation on the Pawmunkey River in Virginia.]”


Opechancanough‘s story raises some interesting questions for today’s Israel vs. Palestine conflict. What are the just limits of even violent resistance to displacement of an indigenous group by settlers?

 A Brave and Cunning Prince