This will be my last post before the weekend. I'm on a panel at the netroots nations convention on the subprime crisis. When the panel is over I'll be driving back to Houston so I'll be a bit preoccupied.
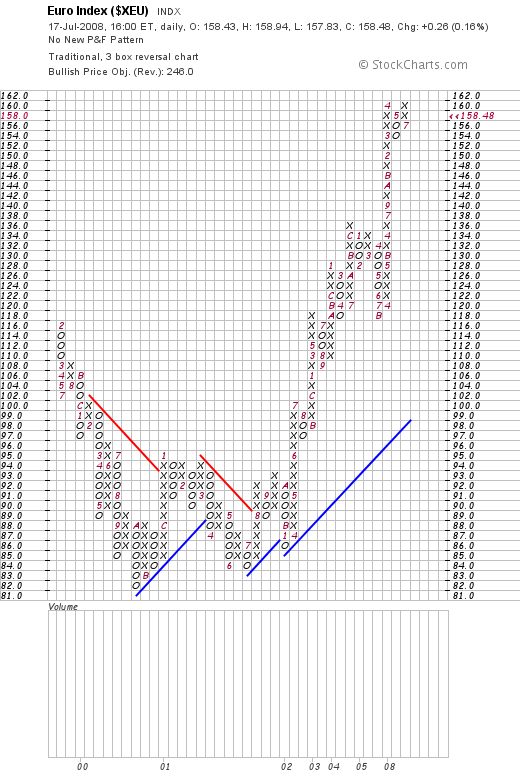
On the P&F chart, notice the euro has been in a very strong rally since 2002. Also note the especially strong run in 2008. However, note the possible double top forming as well. Bottom line: this chart says bull with a possible caution of a double top forming.
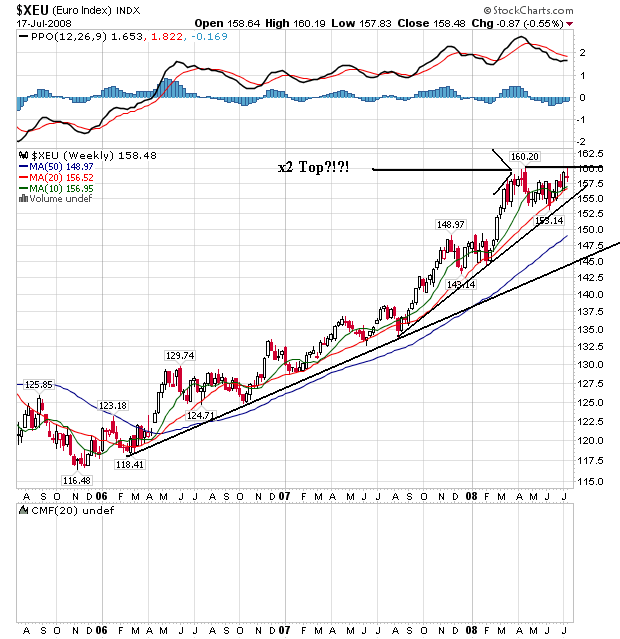
The euro's weekly chart has the euro in a strong rally from the end of 2006. The currency has continually moved through resistance and then consolidated those gains. However, note (again) the possible formation of a double top. But also note the bullish configuration of the SMAs -- the shorter SMAs are above the longer SMAs, all the SMAs are moving higher and prices are above all the SMAs.
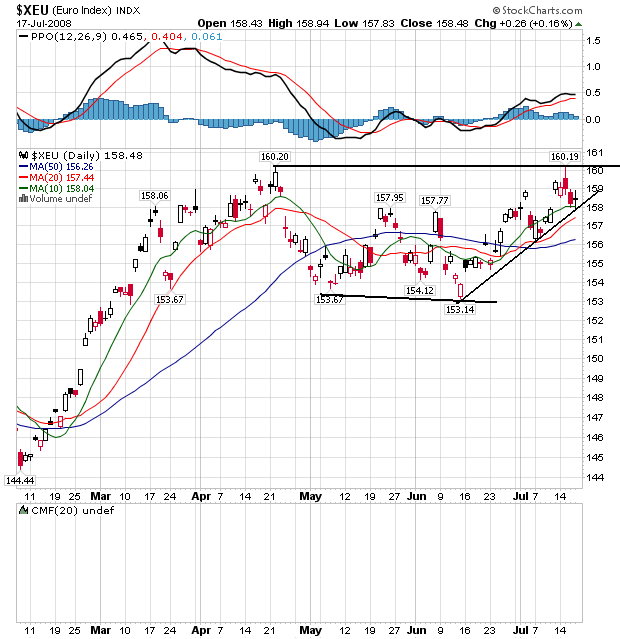
I mention the possible double top because currency traders have continually referred to the 160 level as an area of key resistance for the euro.
The daily chart shows the clear issue the euro has with the 160 level. Prices hit this level in mid-April and then retreated. They meandered sideways a bit and are now making another run at the 160 level. On the bullish side, prices are above the SMAs, and the shorter SMAs are above the longer SMAs. The 10 day SMA is moving sideways, although that could change fairly quickly. The bottom line is this is a chart that is either getting ready to move above key upadie resistance or it will back down. Only time will tell which one it is.
Friday, July 18, 2008
Forex Fridays -- the Yen
Let's continue Friday's usual forex theme with a look at the yen.
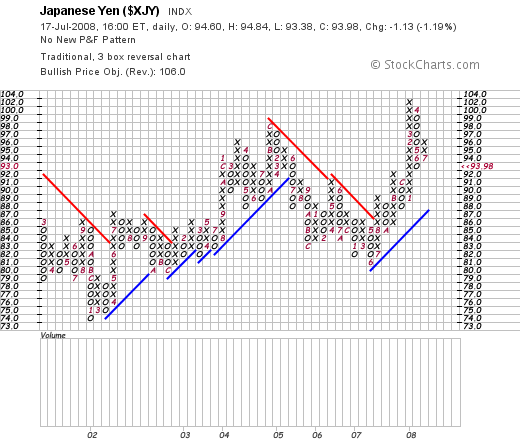
First, let's look at the P&F chart. This will give us an idea of the "absolute moves" of the yen. Notice that from 2004 until the beginning of 2007 there was a general downward sloping trend to the chart as prices made a series of lower peaks and lower lows. This is indicative of a bearish slump in the overall value. Then note that at the beginning 2007 the trend reversed, although the last two columns of the chart indicate some selling activity.
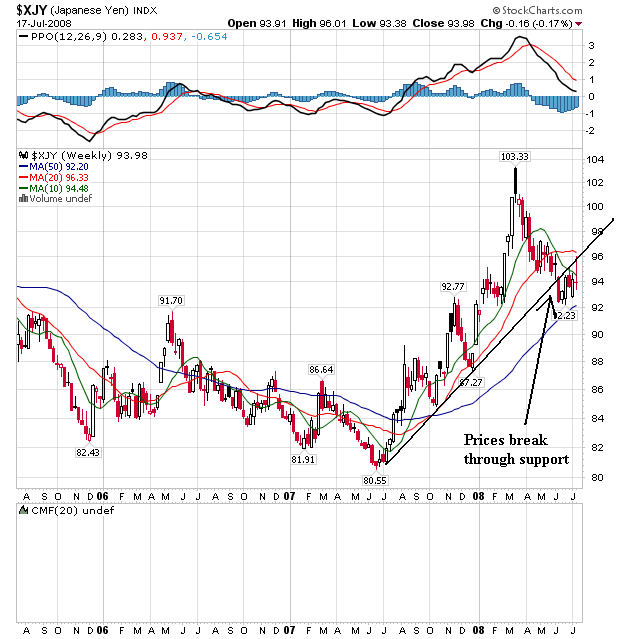
On the weekly chart, notice that since mid 2007 prices have risen sharply, continually breaking through resistance and then consolidating gains in a downward sloping flag pattern. However, prices broke below this upward sloping trendline in June of this year and are now using this trendline (along with the 10 week moving average) as resistance.
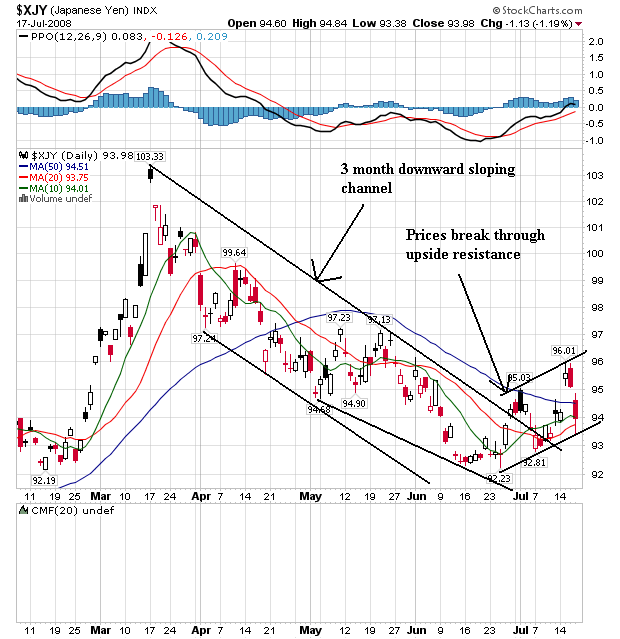
On the daily chart of the yen notice the following:
-- Prices were in a downward sloping trading range from late March until early July.
-- The 10 and the 20 day SMA are both moving higher
-- The 10 day SMA has crossed over the 20 day SMA
-- The 10 and 20 day SMA are below the 50 day SMA
-- The 50 day SMA has leveled out
This chart is in transition. The March - July correction is over, but the price/SMA picture is still cloudy. The short term SMAs are heading higher, but they are still below the longer SMAs. In addition, prices have broken above the 50 day SMA but have retreated from those levels.
The Credit Crisis is Far From Over
Just this morning the following three items were on the front page of the WSJ
Citigroup Swings to Loss
Merrill Reports Loss
Freddie Mulls Stock Sale
Countrywide has a bunch of crap in their portfolio:
Let's review:
We have two of the largest and most important financial institutions writing off an additional 16.7 billion in writedowns. As of a few days ago and according to an on-screen graphic from Bloomberg total worldwide writedowns are now over $400 billion dollars. Most of those are from the US and Europe -- which leads me to wonder why Asia hasn't reported a lot of losses yet. Either they were smarter than the average bear or we have a wave of bad news from another continent on the way.
We have a government sponsored entity saying it is thinking about selling $10 billion in equity. This is on top of the Paulson plan which calls for an unlimited line of credit for these two companies in addition to letting the Treasury purchase Freddie and Fannie stock in the open market. Yet we are continually told the GSEs are in good shape. For a company that is in good shape, it sure looks like they are in desperate need of money.
And then there is Countrywide -- a company under federal investigation. We now know they were selling, well, crap. And that's a huge problem because a lot of the crap that Countrywide sold is backing up bonds in portfolios across the globe.
But over the last few days we've seen the financials rally because they're a great place to put money?
Citigroup Swings to Loss
Citigroup Inc. swung to a second-quarter loss as it reported around $7 billion more in write-downs as credit costs continues to rise, and the company said it cut 6,000 jobs during the period.
Merrill Reports Loss
The brokerage firm's second-quarter loss of $4.65 billion, or $4.95 a share, was one of the worst in Merrill's history and more than twice as steep as the loss for which analysts had been bracing. Already clobbered by subprime-related write-downs of more than $30 billion in the previous three quarters ended in March, Merrill took an additional $9.7 billion hit in the second quarter, which caused the bulk of the company's net loss.
The results underscore why Merrill is parting with valuable assets, such as its 20% stake in news and data provider Bloomberg LP, which is being sold back to the news and information provider's parent Bloomberg Inc. for $4.4 billion. Merrill also announced Thursday its plan to sell Financial Data Services Inc., valued at $3.5 billion.
.....
The moves haven't yet led to a rebound in Merrill's overall performance. Merrill has had to raise $15.5 billion in new capital since Mr. Thain arrived and hasn't come close to turning a quarterly profit. In another sign of tough times at the firm, Merrill recently halted talks to occupy a new tower on the World Trade Center site in lower Manhattan, opting instead to negotiate with its current landlord.
Freddie Mulls Stock Sale
Mortgage giant Freddie Mac -- emboldened by emergency regulatory actions that have triggered a two-day rebound in its battered stock -- is considering raising capital by selling as much as $10 billion in new shares to investors, according to people familiar with the matter.
The high-stakes maneuver would have the potential to avoid a full-blown government rescue for Freddie Mac and Fannie Mae, twin keystones of the U.S. housing market. The publicly traded, government-sponsored companies own or guarantee about $5.2 trillion of home mortgages, or nearly half the total outstanding, and are at the center of government efforts to prop up the sagging housing market.
Countrywide has a bunch of crap in their portfolio:
An amended complaint filed Thursday by the California attorney general related to a suit against Countrywide Financial Corp. sheds new light on the poor quality of loans the company was planning to sell to investors.
The new data provide a close look at 158,000 mortgages that had been slated for sale by Countrywide Homes Loans before last summer's credit crunch -- which was triggered by rising mortgage defaults -- turned investors away from mortgage-backed securities. Nearly 48% of nonprime loans and 21% of pay-option adjustable-rate mortgage in that portfolio were in some stage of delinquency or foreclosure as of April 30, according to the amended complaint, filed by California Attorney General Jerry Brown in state court in Los Angeles. Overall, more than 21% of all loans in that portfolio were in some stage of delinquency or foreclosure, it says.
These loans account for roughly 17% of mortgages held by Countrywide, says Dan Frahm, a spokesman for Bank of America Corp., which completed its acquisition of Countrywide earlier this month. Mr. Frahm added that 9.53% of all loans owned by Countrywide were 30 days or more past due as of the end of April.
Let's review:
We have two of the largest and most important financial institutions writing off an additional 16.7 billion in writedowns. As of a few days ago and according to an on-screen graphic from Bloomberg total worldwide writedowns are now over $400 billion dollars. Most of those are from the US and Europe -- which leads me to wonder why Asia hasn't reported a lot of losses yet. Either they were smarter than the average bear or we have a wave of bad news from another continent on the way.
We have a government sponsored entity saying it is thinking about selling $10 billion in equity. This is on top of the Paulson plan which calls for an unlimited line of credit for these two companies in addition to letting the Treasury purchase Freddie and Fannie stock in the open market. Yet we are continually told the GSEs are in good shape. For a company that is in good shape, it sure looks like they are in desperate need of money.
And then there is Countrywide -- a company under federal investigation. We now know they were selling, well, crap. And that's a huge problem because a lot of the crap that Countrywide sold is backing up bonds in portfolios across the globe.
But over the last few days we've seen the financials rally because they're a great place to put money?
Forex Fridays -- the Dollar
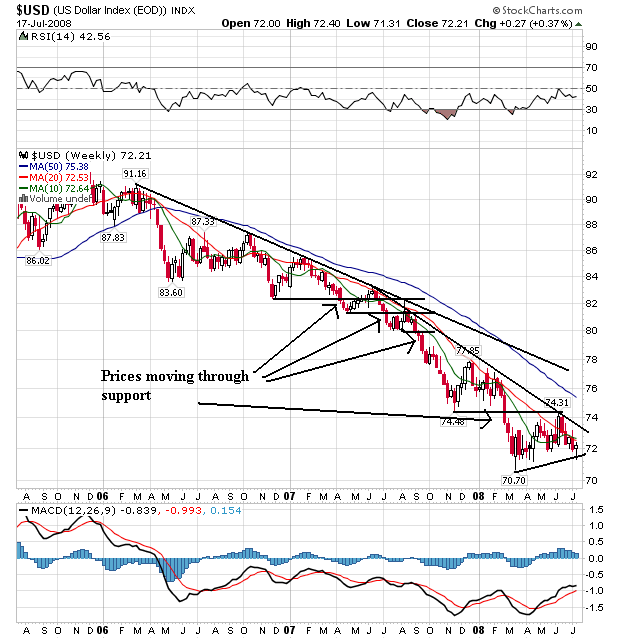
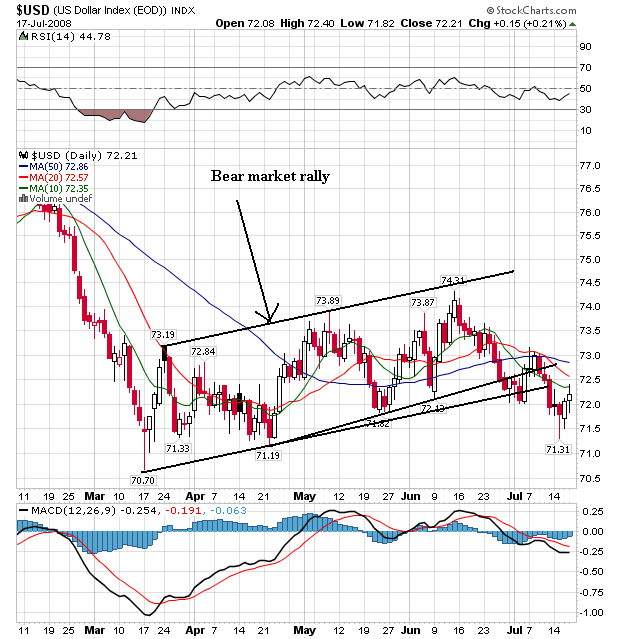
Let's take a look at the weekly and daily chart of the dollar to see how they look:
The dollar has been dropping for the last few years, continually moving through support and hitting new lows on a regular basis. All the SMAs are moving lower, All the shorter SMAs are below the longer SMAs and the prices are below the SMAs. Bottom line this is a bearish chart, plain and simple.
On the daily chart, notice prices rallied over the last three months but have now fallen through support. Also note the following:
-- Prices are below all the SMAs
-- All the SMAs are moving lower
-- The shorter SMAs are below the longer SMAs
In other words, prices and SMAs are now bearishly aligned.
Thursday, July 17, 2008
Today's Markets
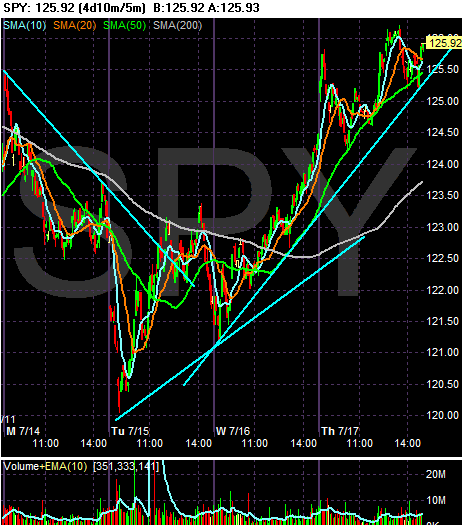
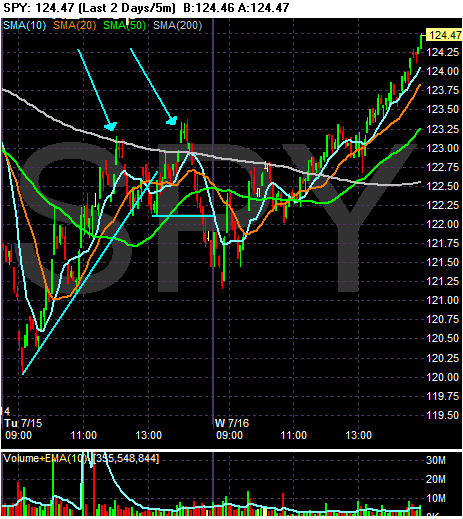
Actually, I'm going to pull the camera lens back a bit and look at the last 4 days of action:
The markets dropped on Monday and then gapped down on Tuesday. However, the markets formed a double bottom with the first bottom occurring early Tuesday and the second bottom occurring early Wednesday. Prices moved through the 200 minute SMA on mid-Wednesday. They have been hugging the upwardly sloping SMAs since, using the 10, 20 and 50 day SMA for technical support. Prices have moved up nearly 5% in the last three days.
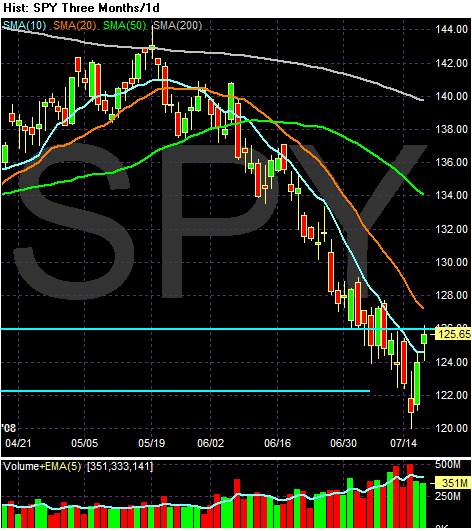
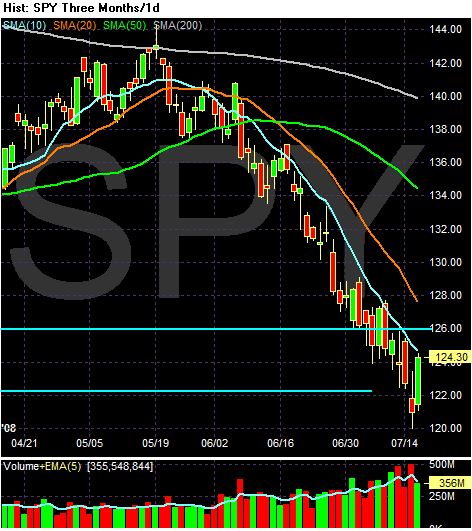
On the daily chart for the SPYs, notice the following:
-- Prices have moved through the 10 day SMA.
BUT
-- All the SMAs are still headed lower
-- The shorter SMAs are below the longer SMAs
-- Prices are still below the 200 day SMA
-- Prices are below three SMAs
This is still a bearish chart.
There are several reasons the SPYs are rallying
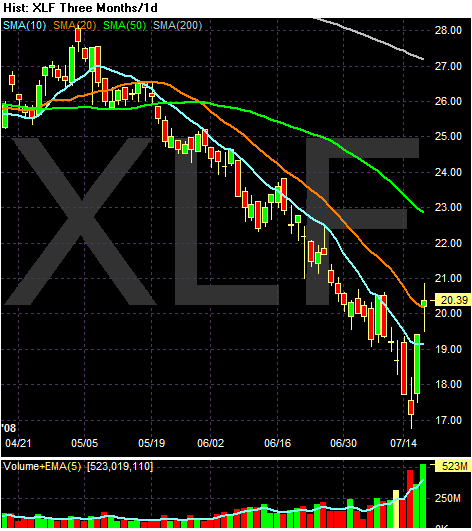
The financials ETF have rallied almost 20%. that's a huge move. The reasons for this rally are several. Several banks reported better than expected earnings. In addition, the sector was horribly oversold. Also note the incredibly high volume over the last three days. This is the type of volume that occurs on a market reversal. I'm not saying we're there because we won't know for a bit. But the volume indicates there is a great deal of excitement about the sector right now.
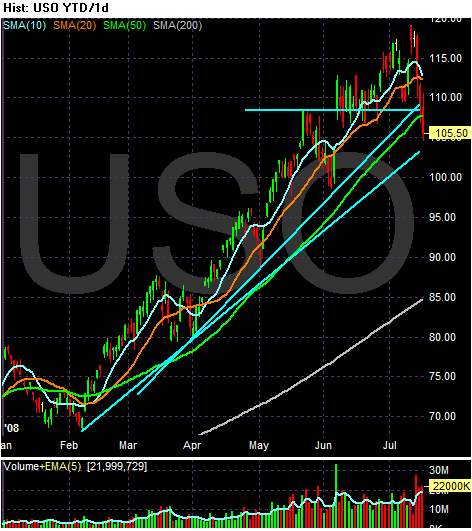
Oil has dropped hard over the last three days and has quickly moved though important technical levels. It has dropped through the 10, 20 and 50 day SMA along with the upward sloping trend line that started in late March/early April. Traders are taking profits, using the opening of Federal lands as a reason to sell. In addition:
The question now becomes, can this continue? Tune it tomorrow.
The markets dropped on Monday and then gapped down on Tuesday. However, the markets formed a double bottom with the first bottom occurring early Tuesday and the second bottom occurring early Wednesday. Prices moved through the 200 minute SMA on mid-Wednesday. They have been hugging the upwardly sloping SMAs since, using the 10, 20 and 50 day SMA for technical support. Prices have moved up nearly 5% in the last three days.
On the daily chart for the SPYs, notice the following:
-- Prices have moved through the 10 day SMA.
BUT
-- All the SMAs are still headed lower
-- The shorter SMAs are below the longer SMAs
-- Prices are still below the 200 day SMA
-- Prices are below three SMAs
This is still a bearish chart.
There are several reasons the SPYs are rallying
The financials ETF have rallied almost 20%. that's a huge move. The reasons for this rally are several. Several banks reported better than expected earnings. In addition, the sector was horribly oversold. Also note the incredibly high volume over the last three days. This is the type of volume that occurs on a market reversal. I'm not saying we're there because we won't know for a bit. But the volume indicates there is a great deal of excitement about the sector right now.
Oil has dropped hard over the last three days and has quickly moved though important technical levels. It has dropped through the 10, 20 and 50 day SMA along with the upward sloping trend line that started in late March/early April. Traders are taking profits, using the opening of Federal lands as a reason to sell. In addition:
Crude oil fell more than $5 a barrel, dropping below $130 for the first time in six weeks, as natural gas futures tumbled and global economic growth slows.
Natural gas dropped more than 7 percent after a government report showed that U.S. supplies rose a greater-than-forecast 104 billion cubic feet last week. Some users can switch between oil- based fuels and gas depending on cost. Oil also fell because of reports showing that the U.S. and Chinese economies are slowing.
``The rout in natural gas is pulling oil lower,'' said Addison Armstrong, director of market research at TFS Energy LLS in Stamford, Connecticut. ``The sheer weight of the decline is bound to impact all the energy markets. A consensus was already forming that prices were too high.''
The question now becomes, can this continue? Tune it tomorrow.
Manufacturing Not Looking That Hot
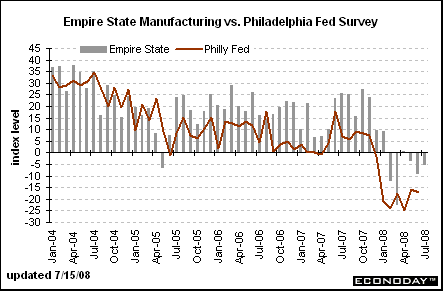
One of the areas of the economy the NBER looks at when determining a recession is the manufacturing sector. This week we've gotten the Empire State and Philly Fed releases. Neither have been good.
Here's a chart from Econoday of both numbers:
From the NY Fed:
There is a bit of good news in here with the increase in new orders and shipments. However, the record high level of prices paid and prices received indicates inflation is present in the system at uncomfortable levels. In addition, the employment indicator is negative -- another indicator the NBER looks at when dating a recession.
From the Philly Fed survey:
Activity is down and prices are up. Isn't that just wonderful news....
Seriously -- things aren't looking that hot right now and haven't for some time.
Here's a chart from Econoday of both numbers:
From the NY Fed:
The Empire State Manufacturing Survey indicates that manufacturing activity in New York State worsened for a third consecutive month in July. The general business conditions index increased slightly from last month’s level but, at -4.9, remained below zero. The new orders and shipments indexes both rose into positive territory, while the unfilled orders index was negative and drifted downward. The inventories index fell to its lowest level in a year. The prices paid and prices received indexes both reached record highs, and the employment indexes dipped below zero. The future general business conditions index fell sharply, reaching a level not seen since September 2001.
There is a bit of good news in here with the increase in new orders and shipments. However, the record high level of prices paid and prices received indicates inflation is present in the system at uncomfortable levels. In addition, the employment indicator is negative -- another indicator the NBER looks at when dating a recession.
From the Philly Fed survey:
The region’s manufacturing sector continued to contract this month, according to firms polled for the July Business Outlook Survey. Indexes for general activity, new orders, shipments, and employment were all negative again this month and little changed from their readings in June. Despite the overall weakness in current activity, slightly more than three-fourths of respondents reported cost increases this month, and more than one-third reported higher prices for their own manufactured products. The region’s manufacturing executives remained generally optimistic that manufacturing conditions will improve over the next six months.
Activity is down and prices are up. Isn't that just wonderful news....
Seriously -- things aren't looking that hot right now and haven't for some time.
Bernanke the Whiner....Pt. II
In his opening remarks to Congress, Bernanke highlighted the current economic situation. This provides a really good overview of the economy at large. Let's see what he sees:
Job growth is down and overall growth is weak. If it wasn't for the cheap dollar and the positive effect on exports we'd be in more trouble. Overall, this is not a very good picture of the economy.
Basically, there is still a massive inventory overhand of homes for sale. Foreclosures are increasing which means inventory will continue to expand. At the same time consumer confidence and sentiment is still at record lows and total household debt is still at really high levels. House prices are still dropping hard as well. Bottom line: these really isn't much reason to think we're near the bottom in housing.
Bernanke makes an incredibly solid point here: the fact that consumers are spending at all is an amazing fact right now considering all of the headwinds they face at the macro level. Between a softening job market and high energy inflation the consumer is under tremendous pressure. Bernanke also notes the drop in household net worth caused by the drop in the stock market and home prices. Bottom line: the consumer is under assault from literally every front right now.
Business is pulling in their spending as well because they are concerned about the overall economic environment. Imagine that.
Great news here, huh? Prices are spiking for necessary things like food and energy. And by the way -- if the US rate of consumption slows we can probably count on developing nations to keep up the pressure on oil and food.
The Fed doesn't see this getting better anytime soon. Great news, huh?
The economy has continued to expand, but at a subdued pace. In the labor market, private payroll employment has declined this year, falling at an average pace of 94,000 jobs per month through June. Employment in the construction and manufacturing sectors has been particularly hard hit, although employment declines in a number of other sectors are evident as well. The unemployment rate has risen and now stands at 5-1/2 percent.
Job growth is down and overall growth is weak. If it wasn't for the cheap dollar and the positive effect on exports we'd be in more trouble. Overall, this is not a very good picture of the economy.
In the housing sector, activity continues to weaken. Although sales of existing homes have been about unchanged this year, sales of new homes have continued to fall, and inventories of unsold new homes remain high. In response, homebuilders continue to scale back the pace of housing starts. Home prices are falling, particularly in regions that experienced the largest price increases earlier this decade. The declines in home prices have contributed to the rising tide of foreclosures; by adding to the stock of vacant homes for sale, these foreclosures have, in turn, intensified the downward pressure on home prices in some areas.
Basically, there is still a massive inventory overhand of homes for sale. Foreclosures are increasing which means inventory will continue to expand. At the same time consumer confidence and sentiment is still at record lows and total household debt is still at really high levels. House prices are still dropping hard as well. Bottom line: these really isn't much reason to think we're near the bottom in housing.
Personal consumption expenditures have advanced at a modest pace so far this year, generally holding up somewhat better than might have been expected given the array of forces weighing on household finances and attitudes. In particular, with the labor market softening and consumer price inflation elevated, real earnings have been stagnant so far this year; declining values of equities and houses have taken their toll on household balance sheets; credit conditions have tightened; and indicators of consumer sentiment have fallen sharply. More positively, the fiscal stimulus package is providing some timely support to household incomes. Overall, consumption spending seems likely to be restrained over coming quarters.
Bernanke makes an incredibly solid point here: the fact that consumers are spending at all is an amazing fact right now considering all of the headwinds they face at the macro level. Between a softening job market and high energy inflation the consumer is under tremendous pressure. Bernanke also notes the drop in household net worth caused by the drop in the stock market and home prices. Bottom line: the consumer is under assault from literally every front right now.
In the business sector, real outlays for equipment and software were about flat in the first quarter of the year, and construction of nonresidential structures slowed appreciably. In the second quarter, the available data suggest that business fixed investment appears to have expanded moderately. Nevertheless, surveys of capital spending plans indicate that firms remain concerned about the economic and financial environment, including sharply rising costs of inputs and indications of tightening credit, and they are likely to be cautious with spending in the second half of the year. However, strong export growth continues to be a significant boon to many U.S. companies.
Business is pulling in their spending as well because they are concerned about the overall economic environment. Imagine that.
Inflation has remained high, running at nearly a 3-1/2 percent annual rate over the first five months of this year as measured by the price index for personal consumption expenditures. And, with gasoline and other consumer energy prices rising in recent weeks, inflation seems likely to move temporarily higher in the near term.
The elevated level of overall consumer inflation largely reflects a continued sharp run-up in the prices of many commodities, especially oil but also certain crops and metals.2 The spot price of West Texas intermediate crude oil soared about 60 percent in 2007 and, thus far this year, has climbed an additional 50 percent or so. The price of oil currently stands at about five times its level toward the beginning of this decade. Our best judgment is that this surge in prices has been driven predominantly by strong growth in underlying demand and tight supply conditions in global oil markets. Over the past several years, the world economy has expanded at its fastest pace in decades, leading to substantial increases in the demand for oil. Moreover, growth has been concentrated in developing and emerging market economies, where energy consumption has been further stimulated by rapid industrialization and by government subsidies that hold down the price of energy faced by ultimate users.
Great news here, huh? Prices are spiking for necessary things like food and energy. And by the way -- if the US rate of consumption slows we can probably count on developing nations to keep up the pressure on oil and food.
In conjunction with the June FOMC meeting, Board members and Reserve Bank presidents prepared economic projections covering the years 2008 through 2010. On balance, most FOMC participants expected that, over the remainder of this year, output would expand at a pace appreciably below its trend rate, primarily because of continued weakness in housing markets, elevated energy prices, and tight credit conditions. Growth is projected to pick up gradually over the next two years as residential construction bottoms out and begins a slow recovery and as credit conditions gradually improve. However, FOMC participants indicated that considerable uncertainty surrounded their outlook for economic growth and viewed the risks to their forecasts as skewed to the downside.
The Fed doesn't see this getting better anytime soon. Great news, huh?
Thursday Oil Market Round-Up
FYI: I'll be on KTLK today at 11:30 CST to talk about the economy.
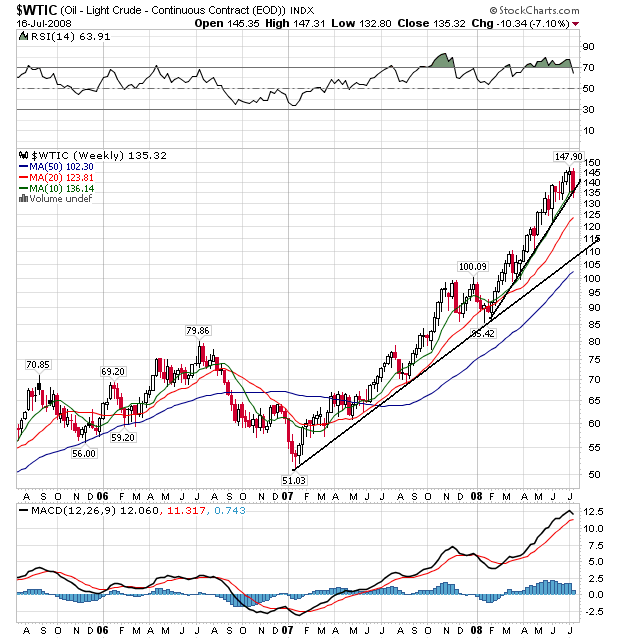
Lots of interesting action in the oil market over the last few days. The primary reason is the news contained in the weekly oil market report along with a sluggish economy:
I should add: this is one week's report. While the news is bearish, it is still one week's report, in a series of trends. Another way to look at this situation is the market needed a reason to take profits and this week's news gave the market the reason to do so. If we see a few more weeks news like this, then we can say things may be changing. But right now we have a single data point which is counter to a whole series of data points.
Let's go to the charts to see what all of this means.
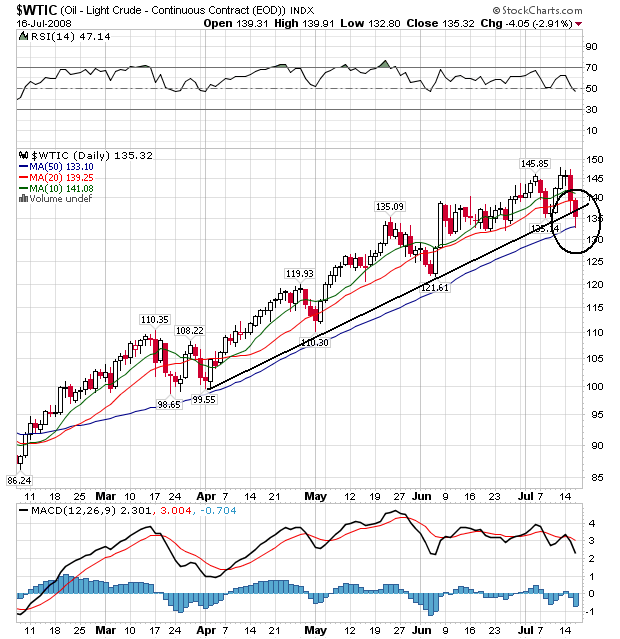
Yesterday prices broke the upward sloping trendline that started in early April. Now there are two important points to make:
-- The amount of the break is small. In his book on technical analysis, Pring uses a 2%-3% rule, meaning prices have to break a trend by a specific amount. This allows for daily fluctuations and in general is a good rule.
-- Will the trend break continue? If we continue to see prices move lower or sideways, then we can say we've got a definite change in psychology.
In addition, note the following:
-- The 10 day SMA has just turned downward
-- The 20 and 50 day SMAs are still moving higher
-- The shorter SMAs are still above the long term SMAs
-- Over the course of this rally, note that prices have corrected between the 20 and 50 day SMA.
On the weekly chart, notice that prices are also on the verge of breaking through support. However -- this is a weekly chart, and the week isn't over yet. That means the bar could change over the next few days.
Also note the following:
-- The shorter SMAs are above the longer SMAs
-- All the SMAs are moving higher
-- Prices are right at the 10 week SMA
In other words, there are still a lot of technically bullish signs on this chart
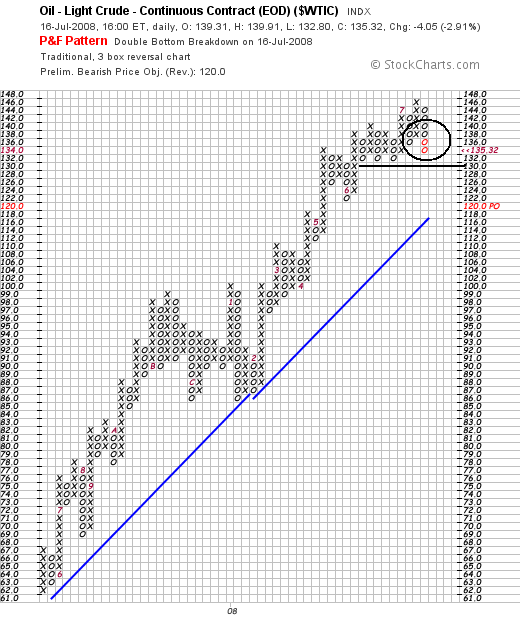
On the PF chart, notice the following:
-- The chart added two more o's yesterday, meaning prices are moving lower.
-- BUT -- note there is strong price support at 132.
To sum up, we have two days of a sell-off caused by a single report. We have a long way to go before we're in correction territory. But we mush also be aware that new information which runs counter to the prevailing sentiment and perception is out there as well.
Lots of interesting action in the oil market over the last few days. The primary reason is the news contained in the weekly oil market report along with a sluggish economy:
Futures have dropped $10.58, or 7.3%, over the last two sessions on concerns that a prolonged economic downturn in the U.S. will leave a hole in oil demand too big for growing Asian economies to fill. Oil prices remain up about 80% from a year ago, however, and the market has recovered from proportionately larger downward corrections this year.
Stockpiles of crude oil and gasoline as reported by the U.S. Energy Information Administration rose unexpectedly in the week ended July 11. Distillates, a category of fuel that includes diesel and heating oil, increased by twice as much as expected.
Oftentimes rising inventories signal faltering demand.
"This is about as straightforward a set of bearish data as we're likely to see," said Tim Evans, an analyst with Citi Futures Perspectives.
Sluggish growth and record oil prices have translated into a 2% drop in U.S. gasoline demand this summer. Gasoline futures have tended to lag behind crude, while heating-oil futures, acting as a stand-in for world-wide diesel demand, have seen bigger gains. Refiners responded by turning a record 30% of their production over to distillates last week. Growing inventories are the result.
I should add: this is one week's report. While the news is bearish, it is still one week's report, in a series of trends. Another way to look at this situation is the market needed a reason to take profits and this week's news gave the market the reason to do so. If we see a few more weeks news like this, then we can say things may be changing. But right now we have a single data point which is counter to a whole series of data points.
Let's go to the charts to see what all of this means.
Yesterday prices broke the upward sloping trendline that started in early April. Now there are two important points to make:
-- The amount of the break is small. In his book on technical analysis, Pring uses a 2%-3% rule, meaning prices have to break a trend by a specific amount. This allows for daily fluctuations and in general is a good rule.
-- Will the trend break continue? If we continue to see prices move lower or sideways, then we can say we've got a definite change in psychology.
In addition, note the following:
-- The 10 day SMA has just turned downward
-- The 20 and 50 day SMAs are still moving higher
-- The shorter SMAs are still above the long term SMAs
-- Over the course of this rally, note that prices have corrected between the 20 and 50 day SMA.
On the weekly chart, notice that prices are also on the verge of breaking through support. However -- this is a weekly chart, and the week isn't over yet. That means the bar could change over the next few days.
Also note the following:
-- The shorter SMAs are above the longer SMAs
-- All the SMAs are moving higher
-- Prices are right at the 10 week SMA
In other words, there are still a lot of technically bullish signs on this chart
On the PF chart, notice the following:
-- The chart added two more o's yesterday, meaning prices are moving lower.
-- BUT -- note there is strong price support at 132.
To sum up, we have two days of a sell-off caused by a single report. We have a long way to go before we're in correction territory. But we mush also be aware that new information which runs counter to the prevailing sentiment and perception is out there as well.
Wednesday, July 16, 2008
Today's Markets
Today was a very strong rally. The market dropped a bit at the open as a result of the CPI news. But the Wells Fargo's news that it would increase its dividend helped to move the market a bit higher. Prices rallied into the 200 minute SMA a little after 10 AM. Prices fell back to the 50 minute SMA and then made a strong move through the 200 minute SMA. Prices continue to use the 10 minute SMA for support until 1PM, when prices retreated a touch. But they regained their momentum into the close, moving higher by a total of 2.74%.
Also helping out today were lower oil prices which I'll cover tomorrow. Also note the financial sector moved higher by 12% -- a huge rally for this area of the market. However, I'm guess this is a reaction rally, meaning prices moved higher not because things are great but because the index has dropped hard for so long; nothing goes down forever.
On the daily chart, note the following:
-- Prices rallied today to just short of the 10 day SMA.
BUT
-- Prices are still moving lower
-- All the SMAs are still moving lower
-- The shorter SMAs are still below the longer SMAs
-- Prices are still below the 200 day SMA, and
-- Prices are still below all the SMAs
In other words, one day does not a massive turnaround make.
Bernanke the Whiner....
Here is a link to the testimony.
Here is a great overview of how we got here.
Let's take this one at a time.
Translation: as housing fell apart, so did anything associated with housing. This means mortgage debt is in serious trouble. According to a blurb I recently saw on Bloomberg, worldwide writedowns are now over $400 billion. Here's a scary point -- Asia has reported very little in writedowns. Either they were really smart, or we have some problems coming down the pike.
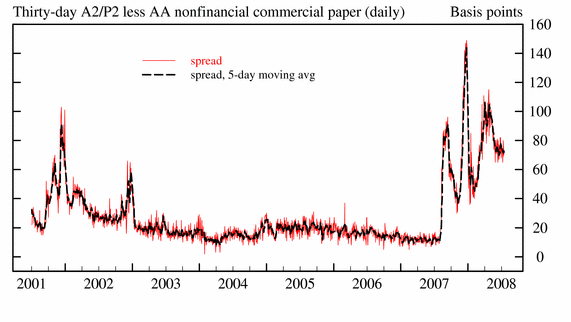
The credit markets are still not in good shape. Here is the Tedd Spread from the Fed:
Short version -- short-term debt is really expensive. This indicates people are hoarding cash and not lending.
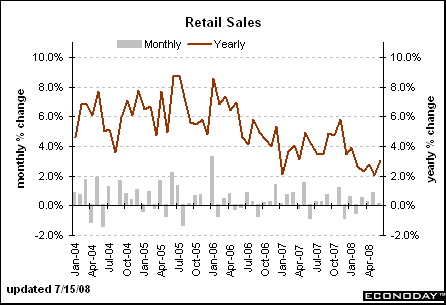
Retail sales are not adjusted for inflation.
These are not pretty pictures.
He forgot to mention poor job growth, or the the fact that real household income is down for this expansion. Bottom line -- we're got serious problems.
Here is a great overview of how we got here.
The U.S. economy and financial system have confronted some significant challenges thus far in 2008. The contraction in housing activity that began in 2006 and the associated deterioration in mortgage markets that became evident last year have led to sizable losses at financial institutions and a sharp tightening in overall credit conditions. The effects of the housing contraction and of the financial headwinds on spending and economic activity have been compounded by rapid increases in the prices of energy and other commodities, which have sapped household purchasing power even as they have boosted inflation. Against this backdrop, economic activity has advanced at a sluggish pace during the first half of this year, while inflation has remained elevated.
Let's take this one at a time.
The contraction in housing activity that began in 2006 and the associated deterioration in mortgage markets that became evident last year have led to sizable losses at financial institutions and a sharp tightening in overall credit conditions.
Translation: as housing fell apart, so did anything associated with housing. This means mortgage debt is in serious trouble. According to a blurb I recently saw on Bloomberg, worldwide writedowns are now over $400 billion. Here's a scary point -- Asia has reported very little in writedowns. Either they were really smart, or we have some problems coming down the pike.
The credit markets are still not in good shape. Here is the Tedd Spread from the Fed:
Short version -- short-term debt is really expensive. This indicates people are hoarding cash and not lending.
The effects of the housing contraction and of the financial headwinds on spending and economic activity have been compounded by rapid increases in the prices of energy and other commodities...
...which have sapped household purchasing power even as they have boosted inflation
Retail sales are not adjusted for inflation.
These are not pretty pictures.
He forgot to mention poor job growth, or the the fact that real household income is down for this expansion. Bottom line -- we're got serious problems.
What Inflation?
From the WSJ:
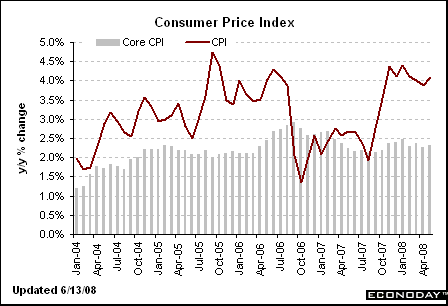
Here's a chart of CPI
As mentioned below, agricultural prices are coming down. We don't know if that is a permanent or temporary situation. The long-term chart can be read as both a consolidation and a retreat so we'll have to wait until prices give us a confirmation. I'll cover oil prices tomorrow, but they are still in a rally.
The consumer price index jumped 1.1% in June, the Labor Department said Wednesday. Excluding food and energy, it advanced 0.3%. Wall Street economists had expected a 0.7% rise in the headline and 0.2% core increase, according to a Dow Jones Newswires survey.
Unrounded, the CPI rose 1.056% last month. The core CPI advanced 0.323% unrounded.
Consumer prices swelled 5% on a year-over-year basis, the highest rate since May 1991. The core CPI grew a more modest 2.4% compared to June 2007, though that's still well above the Fed's long-term goal of 1.5% to 2%. Over the past three months, core inflation rose at a 2.5% annual rate.
Here's a chart of CPI
As mentioned below, agricultural prices are coming down. We don't know if that is a permanent or temporary situation. The long-term chart can be read as both a consolidation and a retreat so we'll have to wait until prices give us a confirmation. I'll cover oil prices tomorrow, but they are still in a rally.
Paulson's Opening Remarks From Yesterday
Here is a link to the remarks
Translation: If the GSEs fail, we're hosed. Therefore, we need to do everything possible to keep these institutions afloat
Translation: This is probably the primary fact that got and kept Paulson's attention. As a former big guy at Goldman Sachs, he was involved in one way or another with Freddie and Fannie debt issues on many occasions. His experience is telling him how important these institutions are.
Translation: This is a statement from the same guy who keeps saying the US has a strong dollar policy.
Here's the three point plan:
Translation: In a previous paragraph, Paulson said, "OFHEO has reaffirmed that both GSEs remain adequately capitalized." Now he states he is "not proposing a particular dollar amount" regarding the total loan value. These two statements do not jibe. My guess is the GSEs are in far more trouble than we thought. Why else would be need an unlimited amount of discretion for the total amount of the dollar injection?
Translation: The Treasury will now become a GSE shareholder. I wonder how other members of the financial community will feel about this? I bet Citigroup would love to have this kind of support for its stock price. How long do you think it will be before the market forces the Treasury to act on this promise?
Translation: hold on -- monkeys are flying out of my butt.....give me a minute.....
Translation: Because we are lending the GSEs more and more money we will be looking over their shoulder more and more. That makes sense.
So -- here's what we have
1.) The Treasury can pump as much money as they want whenever they want into the GSEs. In the same breath we're told the GSEs are in good shape. Bullshit. The Treasury is asking for this loan ability because the GSEs are not in good shape and the Treasury is concerned that over the next 18 months we're gong to have additional problems.
2.) The Treasury is backstopping GSE stock. The treasury has the possibility of becoming the largest GDSE shareholder out there.
3.) The Treasury and Federal Reserve will perform more oversight.
Fannie Mae and Freddie Mac, two of the government-sponsored enterprises (GSEs), are also working through this challenging period. Fannie and Freddie play a central role in our housing finance system and must continue to do so in their current form as shareholder-owned companies. Their role in the housing market is particularly important as we work through the current housing correction. The GSEs now touch 70 percent of new mortgages and represent the only functioning secondary mortgage market. The GSEs are central to the availability of housing finance, which will determine the pace at which we emerge from this housing correction.
Translation: If the GSEs fail, we're hosed. Therefore, we need to do everything possible to keep these institutions afloat
In addition, debt and other securities issued by the GSEs are held by financial institutions around the world. Continued confidence in the GSEs is important to maintaining financial system and market stability.
Translation: This is probably the primary fact that got and kept Paulson's attention. As a former big guy at Goldman Sachs, he was involved in one way or another with Freddie and Fannie debt issues on many occasions. His experience is telling him how important these institutions are.
Our proposal was not prompted by any sudden deterioration in conditions at Fannie Mae or Freddie Mac. OFHEO has reaffirmed that both GSEs remain adequately capitalized. At the same time, recent developments convinced policymakers and the GSEs that steps are needed to respond to market concerns and increase confidence by providing assurances of access to liquidity and capital on a temporary basis if necessary.
Translation: This is a statement from the same guy who keeps saying the US has a strong dollar policy.
Here's the three point plan:
First, as a liquidity backstop, the plan includes an 18-month temporary increase in Treasury's existing authority to make credit available for the GSEs. Given the difficulty in determining the appropriate size of the credit line we are not proposing a particular dollar amount. Flexibility is the best means of increasing market confidence in the GSEs, and also the best means of minimizing taxpayer risk.
Translation: In a previous paragraph, Paulson said, "OFHEO has reaffirmed that both GSEs remain adequately capitalized." Now he states he is "not proposing a particular dollar amount" regarding the total loan value. These two statements do not jibe. My guess is the GSEs are in far more trouble than we thought. Why else would be need an unlimited amount of discretion for the total amount of the dollar injection?
Second, to ensure the GSEs have access to sufficient capital to continue to fulfill their mission, the plan gives Treasury an 18-month temporary authority to purchase – only if necessary – equity in either of the two GSEs.
Translation: The Treasury will now become a GSE shareholder. I wonder how other members of the financial community will feel about this? I bet Citigroup would love to have this kind of support for its stock price. How long do you think it will be before the market forces the Treasury to act on this promise?
Let me stress that there are no immediate plans to access either the proposed liquidity or the proposed capital backstop. If either of these authorities is used, it would be done so only at Treasury's discretion, under terms and conditions that protect the U.S. taxpayer and are agreed to by both Treasury and the GSE. I have for some time urged a broad range of financial institutions to raise capital and at Treasury we have constantly encouraged the GSEs to do just that. In March, at my request, both the Chairman and Ranking Member of this Committee hosted a meeting with me and the CEOs of the two GSEs where they agreed to raise capital and you began the effort to move your GSE reform bill, which is now hopefully about to be enacted with the modifications we are recommending today.
Translation: hold on -- monkeys are flying out of my butt.....give me a minute.....
Third, to help protect the financial system from future systemic risk, the plan strengthens the GSE regulatory reform legislation currently moving through Congress by providing the Federal Reserve authority to access information and perform a consultative role in the new GSE regulator's process for setting capital requirements and other prudential standards. Let me be clear, the Federal Reserve would not be the primary regulator. As I have said for some time, the Fed already plays the role of de-facto market stability regulator and we must give it the authorities to carry out that role. This role for the Federal Reserve with respect to the GSEs is consistent with the recommendation made in Treasury's Blueprint for a Modernized Financial Regulatory Structure. Clearly, given the scope of the GSEs' operations in world financial markets, a market stability regulator must have some line of sight into their operations.
Translation: Because we are lending the GSEs more and more money we will be looking over their shoulder more and more. That makes sense.
So -- here's what we have
1.) The Treasury can pump as much money as they want whenever they want into the GSEs. In the same breath we're told the GSEs are in good shape. Bullshit. The Treasury is asking for this loan ability because the GSEs are not in good shape and the Treasury is concerned that over the next 18 months we're gong to have additional problems.
2.) The Treasury is backstopping GSE stock. The treasury has the possibility of becoming the largest GDSE shareholder out there.
3.) The Treasury and Federal Reserve will perform more oversight.
Wednesday Commodities Round-Up
Let's start with gold. First, gold is a proxy for inflation expectations. If traders are concerned about inflation rising they will bid up the price of gold as a hedge against perceived or real inflation. The reverse is also true.
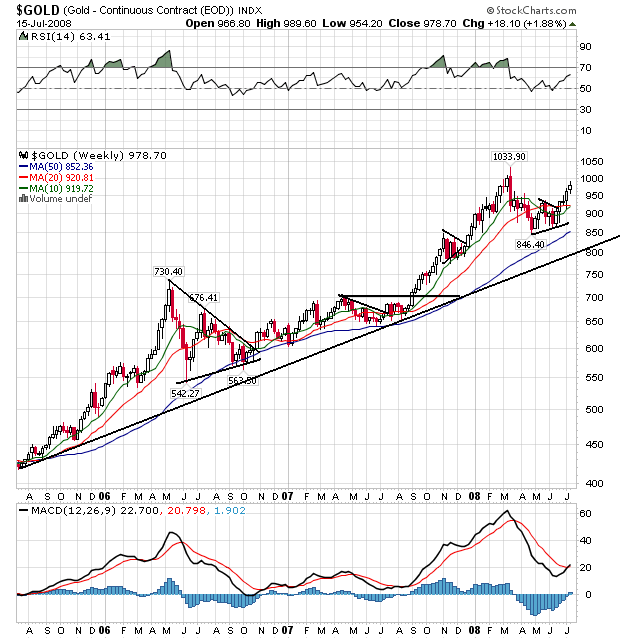
The three year weekly gold chart is in a clear bull market. It has continually moved higher, consolidated gains and then moved higher. This is a good example of what an extended rally should look like.
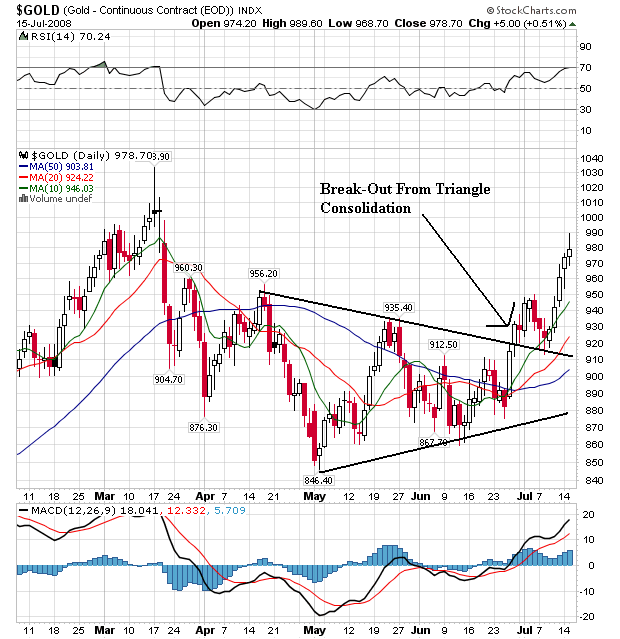
On the daily chart, notice the following:
-- Gold consolidated in a triangle from mid-April to late June of this year
-- Prices have broken through upside resistance from the triangle
-- The shorter SMAs are now above the longer SMAs
-- All the SMAs are moving higher
-- Prices are above all the SMAs
This chart is short-term very bullish.
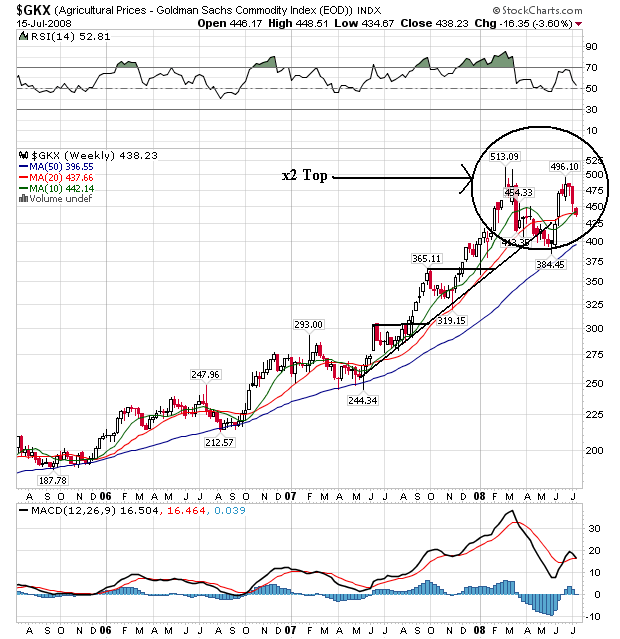
On the weekly agricultural prices chart, notice that prices are forming a double top. This is to be expected for several reasons. First, nothing cures high prices like high prices. In other words, as prices increase they lead to a change in the nature of supply and demand -- either people will demand less (unlikely with food) or more supply will come on the market. Either way prices start to drop.
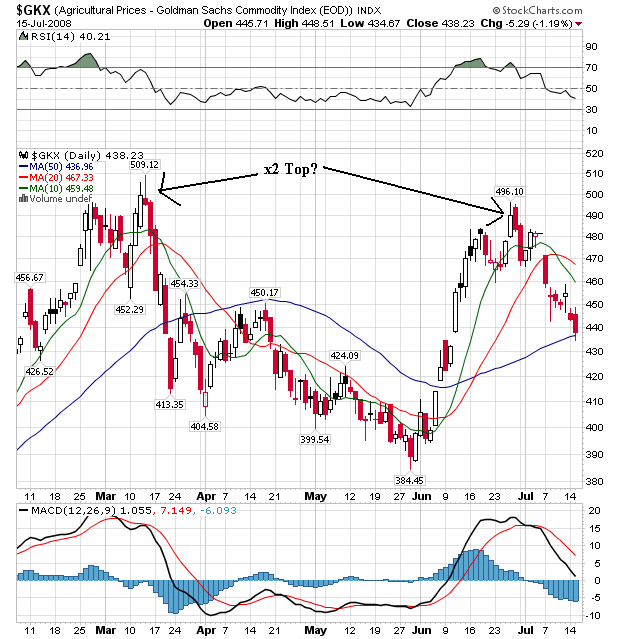
On the daily chart the double top is clearer. Also notice the following:
-- Prices have moved bellow the 10 and 20 day SMA.
-- The 10 and 20 day SMA have both turned lower
-- The 10 day SMA has crossed below the 20 day SMA
-- Prices are currently using the 50 day SMA as technical support
The recent run-up is a direct result of the Iowa floods. As the flood waters receded, the reason for bidding up prices disappeared. Also note that before the Iowa floods prices were already dropping, indicating a change in the market's psychology. This chart is shifting from a bullish to a bearish chart, but hasn't quite made the transition complete yet.
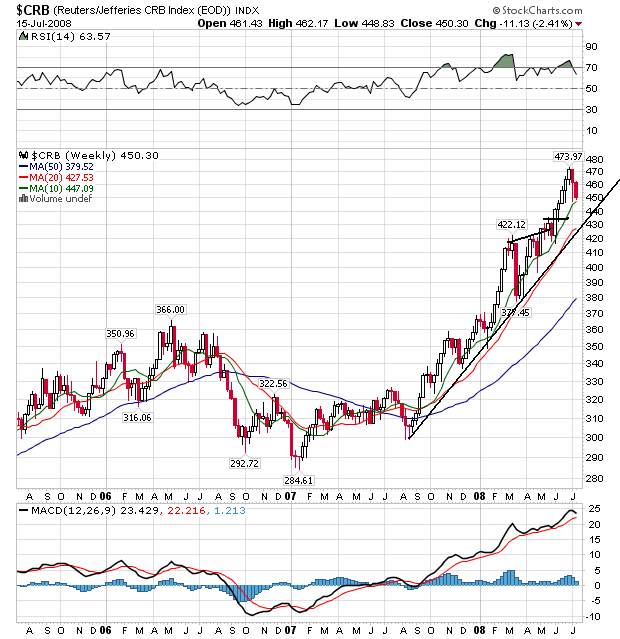
Overall, the CRB is still in the middle of a strong bull run that started in mid-2007. Prices have continually moved through upside resistance, consolidated gains, and then moved higher.
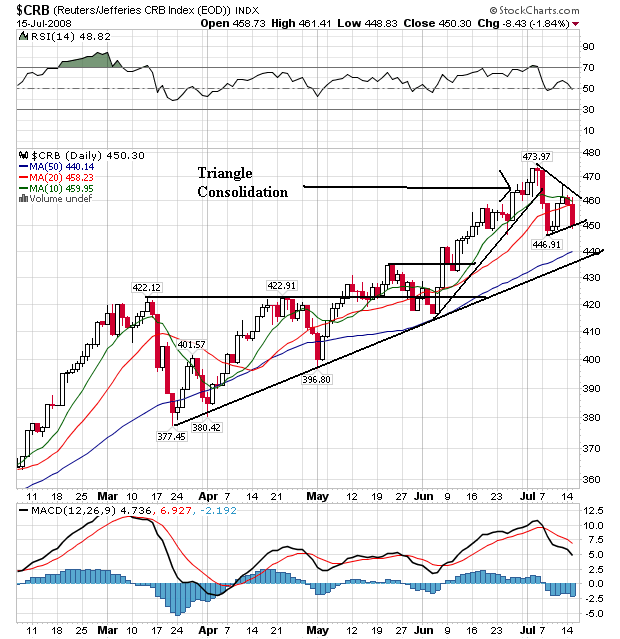
On the daily chart, notice the following:
-- Prices have been rising since late March, although the 420-430 area provided a great deal of upside resistance
-- Prices broke a mini-rally that started in June
-- Prices have now dropped a bit and are consolidating in a triangle pattern
-- Notice that prices and the 10 and 20 day SMA are bunched together. This is still bullish, but a bit less so then the other charts we have seen.
-- Also note the 10 day SMA is now headed lower, although it is still above the 20 day SMA
-- Prices have moved below the 10 and 20 day SMA
-- Note that in the past, prices have used the 50 day SMA area as support. They may be looking to do that again.
Overall, this is still a bullish chart, but less so then others we have seen. There are some incredibly strong bullish trends, but it looks as though we're going to see a bit of a consolidation or correction in the near future.
So, we have gold telling us inflation expectations are increasing. With oil in a rally that shouldn't be surprising. However, agricultural prices are dropping which is putting some downward pressure on the CRB.
Tuesday, July 15, 2008
Today's Markets
The markets gapped down at the open. There were several reasons for this. There was a hangover from yesterday's session. PPI was high (see post below), indicating inflation is still an issue. In addition:
A gauge of manufacturing in New York State contracted in July for the third consecutive month, though the rate of decline was less severe than in June, the New York Federal Reserve said in a report on Tuesday.
The New York Fed's "Empire State" general business conditions index came in at minus 4.92 in July from minus 8.68 in June, while its gauges of inflation also posted increases.
Industrial production is one of the areas of the economy the NBER analyzes when it is looking to date a recession. The Empire State survey has not been doing well over the last few months. In addition to that:
U.S. retail sales rose a disappointing 0.1% in June despite nearly $50 billion in stimulus checks for consumers, Commerce Department data released Tuesday revealed.
Sales were boosted by higher prices for gasoline, food and other consumer goods. The figures are seasonally adjusted but are not adjusted for inflation.
It was the weakest sales report since February's 0.2% decline.
Sales in June were held back by the biggest drop in auto sales in more than two years. By contrast, sales at the malls and shopping centers were relatively healthy, stimulated by the tax rebate checks,
Excluding the 3.3% drop in auto sales, sales rose 0.8%, the slowest in three months.
Excluding the 3.3% rise in gasoline station sales, sales fell 0.5%, the biggest drop since December. Excluding both autos and gas, sales rose 0.2%.
Despite Washington pumping money into the economy, retail sales are lackluster.
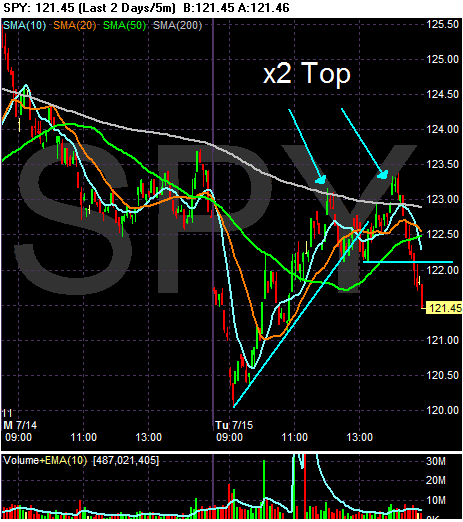
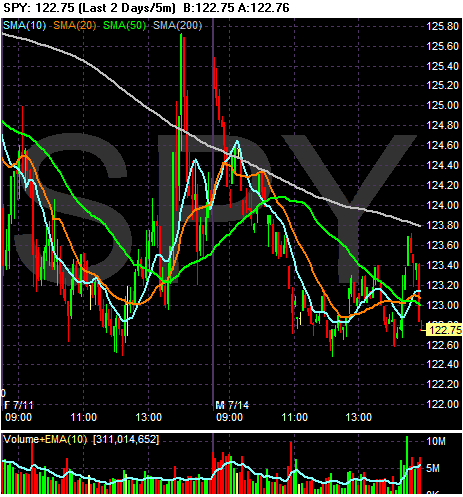
So, there was a lot of negativity at the open. Prices moved lower a bit more and then gapped down around 9AM CST. Then prices started to move higher. They crossed over the 10 and 20 minute SMA, then rose a bit before hitting resistance at the 50 day SMA. Prices fell back to the 20 minute SMA and then printed two strong bars right before 11 AM to get over the 50 minute SMA. Prices continued to rise until a little after 12 when they ran into upside resistance at the 200 minute SMA. Prices dropped a bit and then everything moved sideways before making another move higher. Right after 2 PM prices moved through the 200 minute SMA. But they couldn't hold momentum and they fell into the close.
Despite all of the positive technical developments in the day -- the continued moves through upside resistance and the important move through the 200 minute SMA near the close, prices just couldn't keep the momentum going. That indicates there is still a great deal of concern out there. Also note that prices fell into the close, indicating traders don't want to hold anything overnight which is another bearish sign.
What Inflation?
From Bloomberg:
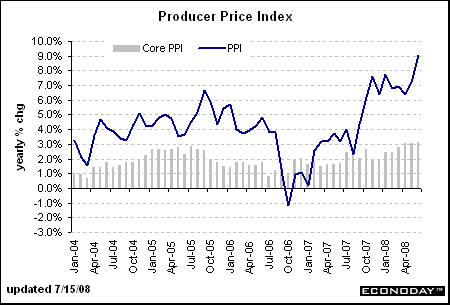
Prices paid to U.S. producers rose for a sixth month in June, pushed up by surging fuel costs that underscore risks of inflation.
The 1.8 percent increase was the biggest gain since November and followed a 1.4 percent jump the prior month, the Labor Department said today in Washington. So-called core producer prices that exclude fuel and food increased 0.2 percent, less than economists forecast.
Higher prices for fuel and raw materials cut into corporate profits and pressure them to raise prices. Federal Reserve policy makers, who have paused in their steepest rate cuts in two decades, last month said ``upside risks'' to inflation had increased and they would act ``as needed'' to foster both stable prices and growth.
``It was primarily confined to the energy sector,'' said Lindsey Piegza, an analyst at FTN Financial in New York, which correctly forecast the rise in the core rate. ``There is risk that in the future they could seep through and cause an inflationary spiral, but right now inflation is going to take a back seat to the slowing economy'' on the list of Fed concerns.
See -- if only we the news reports dealt exclusively with core inflation then everything would be OK.
Also note the following:
The Labor Department said producer prices over the last 12 months were up 9.2 percent, the biggest increase since a 10.4 percent gain in June 1981 when the United States was last mired in a low-growth, high-inflation period known as stagflation.
Isn't that just wonderful?
The Credit Crisis is Far From Over
From today's WSJ, talking about the Freddie and Fannie bail-out:
The bottom line is Freddie and Fannie have a combined portfolio value that is almost twice the size of the federal government's budget. Let's play this out a bit further and assume that only one of these companies needs help -- and more than a loan at the discount window. Where is the federal budget is the money coming from?
Also consider this:
Expect more reports like this:
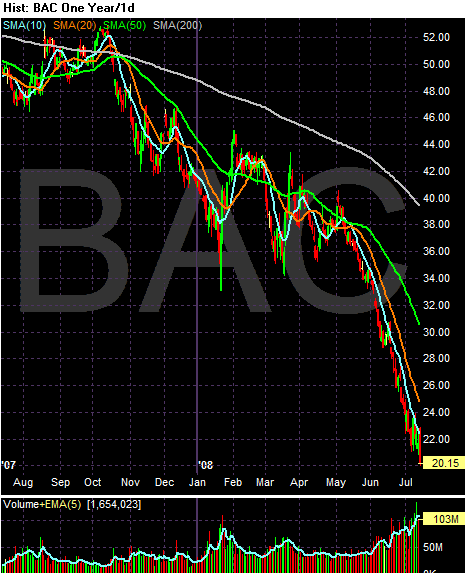
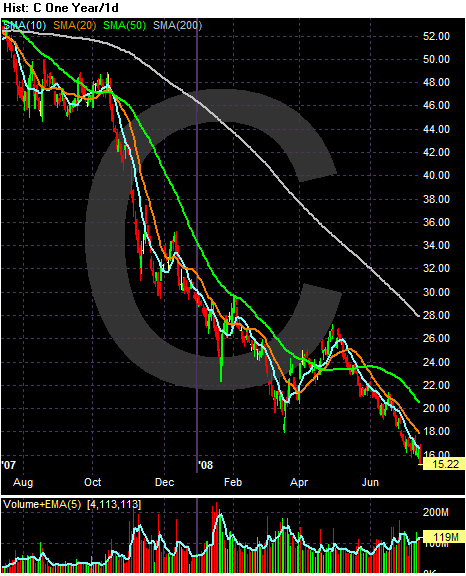
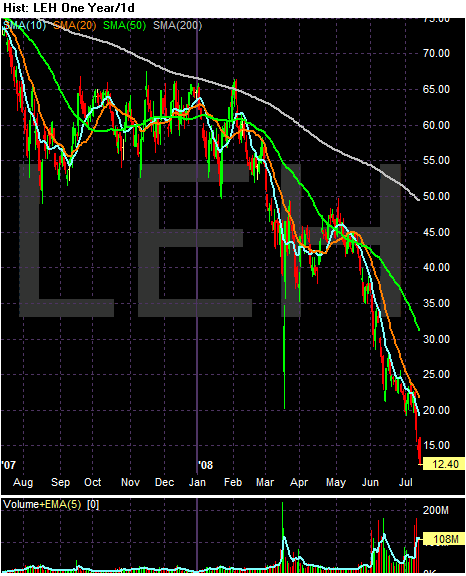
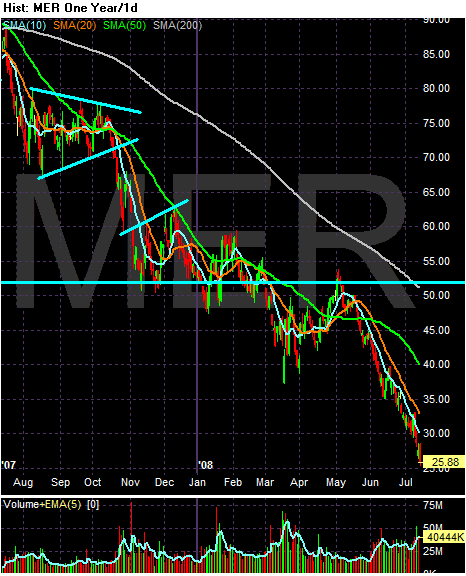
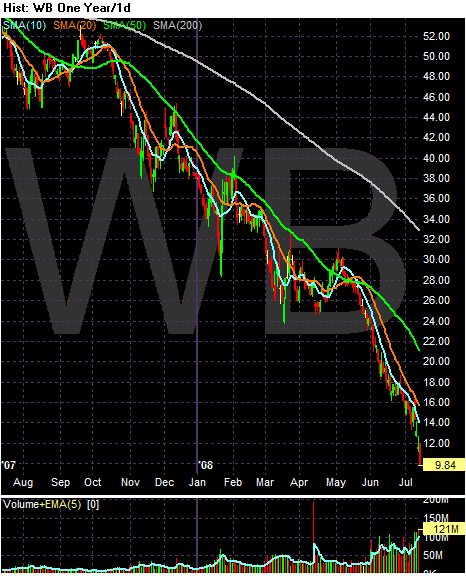
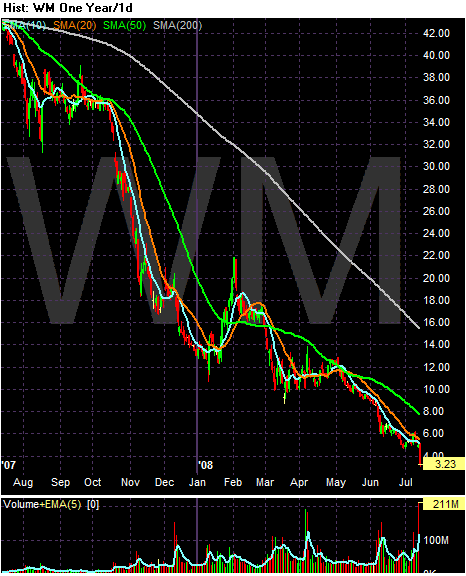
The entire financial sector is suspect right now -- not just IndyMac. Here are some charts to prove it:
Bank of America is tanking, as is
Citigroup
Lehman Brothers
Merrill Lynch
Wachovia and
Washington Mutual
For anybody that is saying:
-- Schumer caused the IndyMac failure, and/or
-- To keep buying those bank shares because they're cheap,
Please shut up. Schumer is an idiot of the highest order (isn't everybody in Washington?), but Indy Mac caused their own problems. And the financial sector is about to go through another round of writedowns caused by the mortgage mess. And this one won't be the last either. The Case Shiller index is still dropping hard. As prices of homes drop, the mortgages tied to those properties become less valuable. Hence, the owners of those mortgages must lower the estimated value of those mortgages leading to more and more writedowns.
But analysts warned that a bailout carries considerable risk for the government. The two lenders carry $5.2 trillion in mortgages on their books, dwarfing even the $2.9 trillion in spending budgeted for the entire federal government in fiscal 2008. Washington would essentially be betting that only a small portion of the agencies' mortgages will result in defaults in the months ahead, analysts said.
The bottom line is Freddie and Fannie have a combined portfolio value that is almost twice the size of the federal government's budget. Let's play this out a bit further and assume that only one of these companies needs help -- and more than a loan at the discount window. Where is the federal budget is the money coming from?
Also consider this:
Traders and analysts said the woes of IndyMac, once one of the nation's largest independent mortgage lenders, also underscored the possibility of meltdowns at regional firms that may be too small to merit a Bear Stearns-style intervention. Regulators are keeping tabs on the health of about 90 banks.
Shares of such companies were sharply lower Monday. Zions Bancorp dropped 23.2% and First Horizon National plunged 25.2%.
National City slid 14.7% despite issuing a statement that it "is experiencing no unusual depositor or creditor activity. As of the close of Friday's business, the bank maintained more than $12 billion of excess short-term liquidity." National City also said its capital position was strong after its recent capital raising.
.....
Other banks also saw big declines. Washington Mutual fell 34.8% and Wachovia dropped nearly 14.7%.
Investment banks also fell. Lehman Brothers Holdings, which has been battered in recent weeks, was down more than 12.2%. Merrill Lynch dropped nearly 6.3%. Morgan Stanley fell 5.1% and Goldman Sachs Group was down 2.3%.
Shares of M&T Bank slid 15.6% after the company reported a 25 % drop in second-quarter profit, missing analysts' expectations.
The firm's report was part of a series of earnings announcements due this week from financial institutions, with analysts expecting to see more write-downs and disclosures of bad credit bets. Reports are due Thursday from J.P. Morgan, Merrill Lynch, and Zions. On Friday, Citigroup will report. Overall, Wall Street expects the financial sector to lead a decline of over 13% in aggregate profits at S&P 500 companies for the second quarter, according to Thomson Reuters.
Expect more reports like this:
U.S. Bancorp posted a larger-than-expected 18 percent decline in quarterly profit due to mounting housing-related credit losses, and said that tough economic conditions will cause bad loans to increase further.
The results, from a bank that has avoided the massive credit losses afflicting many rivals, do not augur well for the rest of the nation's banks, many of which are expected to report dismal quarterly results this week and next.
U.S. Bancorp, whose shares fell nearly 7 percent in pre-market trading, is the sixth-largest U.S. bank and the first of the 10 biggest to report.
The entire financial sector is suspect right now -- not just IndyMac. Here are some charts to prove it:
Bank of America is tanking, as is
Citigroup
Lehman Brothers
Merrill Lynch
Wachovia and
Washington Mutual
For anybody that is saying:
-- Schumer caused the IndyMac failure, and/or
-- To keep buying those bank shares because they're cheap,
Please shut up. Schumer is an idiot of the highest order (isn't everybody in Washington?), but Indy Mac caused their own problems. And the financial sector is about to go through another round of writedowns caused by the mortgage mess. And this one won't be the last either. The Case Shiller index is still dropping hard. As prices of homes drop, the mortgages tied to those properties become less valuable. Hence, the owners of those mortgages must lower the estimated value of those mortgages leading to more and more writedowns.
Treasury Tuesdays
Let's go to (what else?) the charts to see what they're telling us this week.
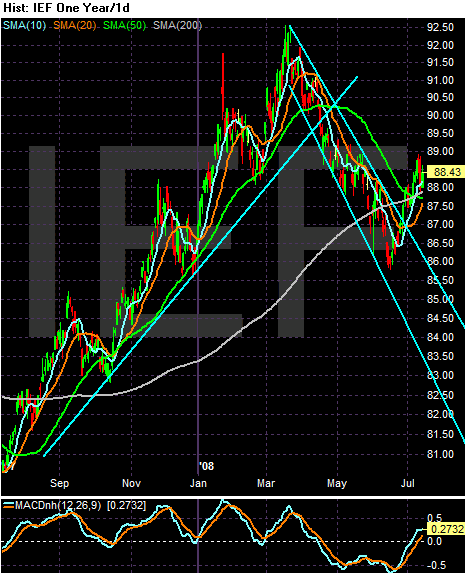
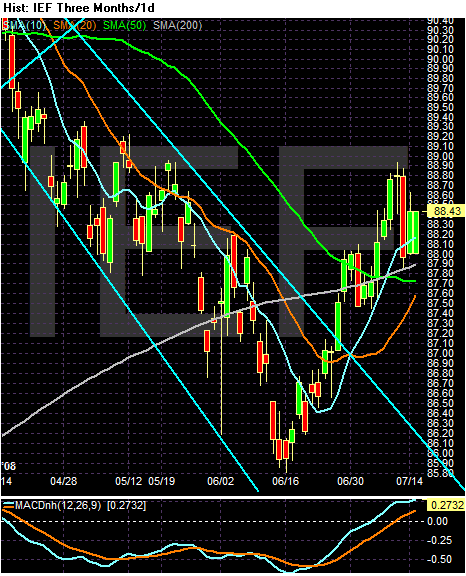
Above is a 1 year chart of the 7-10 Treasury ETF. This part of the market rallied from the end of last summer to March of this year. The credit crisis started last summer, which was a natural stimulus for the Treasury market because of its safe haven status. In March of this year the Fed back-stopped the Bear Stearns deal which indicated the Fed was going to be far more open to the idea of intervention. This made Treasury bonds less attractive. However, over the last month or so we've seen a the Treasury market start to advance again.
Above is a three month chart of the 7-10 year Treasury market ETF. Notice the following.
-- Prices have moved above the 200 day SMA, indicating a move into bull market territory
-- The short term SMAs (the 10 and 20 SMA) are both moving higher
-- The 10 day SMA has just moved over the 200 day SMA
-- Prices are above all the SMAs
This is a chart in transition. Traders are obviously more confident about the future price prospects of the Treasury market -- or are more interested in the short-term safety of these bonds. Considering inflation is higher than we would like, the safety argument is probably the primary reason for the rally.
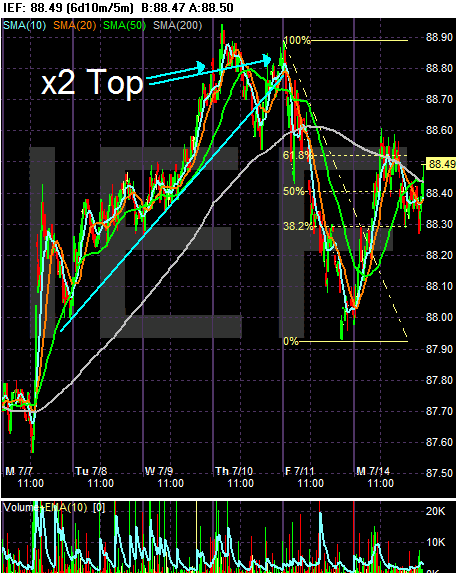
On the 6 day chart, notice the following:
-- Prices rallied from Monday until Thursday as the market fell.
-- The market formed a double top and then fell hard on Friday, largely as a reaction to the news of Freddie and Fannie. A federal bail-out means more government spending.
-- Prices rallied yesterday as traders realized the Fed plan might actually help.
Monday, July 14, 2008
Today's Markets
The markets gapped up at the open, but then fell just below the 20 minute SMA. Prices tried to rally, but ran into resistance at the 10 minute SMA. Prices then ping-ponged between the 50 and 20 minute SMAs until they fell below the 10 minute SMA a little after 10 AM. But then the 10 and the 20 minute SMA had crossed under the 50 minute SMA, indicating further moves downward. Prices continued to fall until 11 AM when prices stabilized. Then they moved sideways until 12:30. Prices moved above th 10 minute SMA and then advanced above the 50 minute SMA. But prices were again pulled down. They attempted one more run right before closing but could not maintain the momentum. We closed near lows for the day.
Financials were the main issue:
Washington Mutual Inc. posted its biggest drop ever and National City Corp. tumbled to a 24-year low after last week's collapse of IndyMac Bancorp Inc. spurred speculation that regional banks are short of capital. The companies said they've seen no unusual depositor activity. Fannie Mae and Freddie Mac erased an earlier rally fueled by Treasury Secretary Henry Paulson's plan to help rescue the largest U.S. mortgage lenders.
.....
Zions Bancorporation, the Salt Lake City-based lender with operations in 10 Western U.S. states, fell 23 percent to $19.73. First Horizon National Corp., Tennessee's biggest bank, slumped 25 percent to $5.04.
This shouldn't be surprising considering all the turmoil related to Fannie and Freddie over the last few days. And don't be surprised to see it continue.
The Credit Crisis is Far From Over
I've been saying this for some time. But more and more news stories are saying it as well:
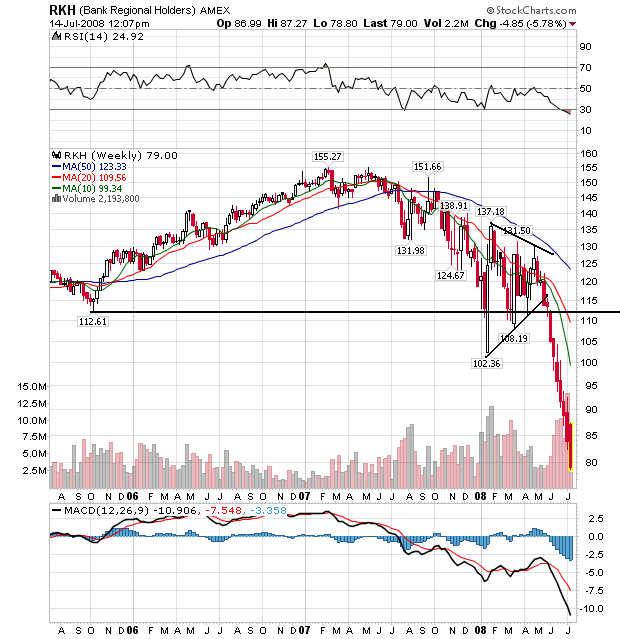
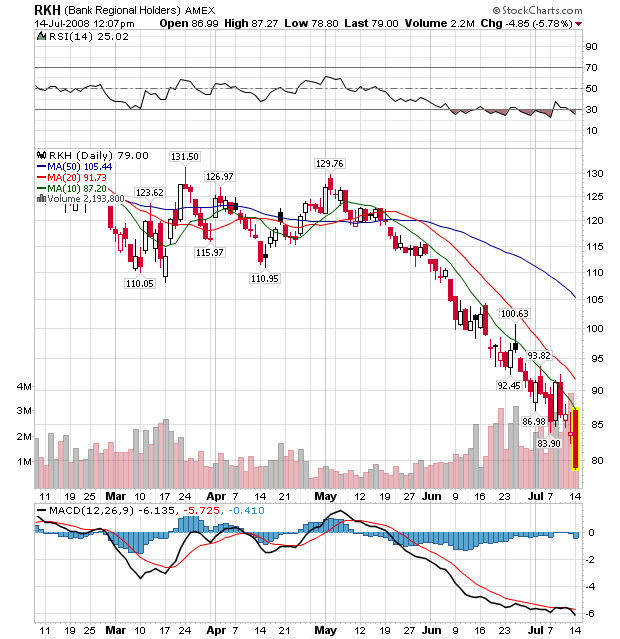
Below is a chart of teh bigger financial institutions as represented by the XLF. Here are two charts of the regional bankshares ETF:
On the weekly chart, notice that prices have been dropping since the beginning of 2007. Part of that is a natural sell-off that occurred after a strong rally. Notice that prices dropped slightly but but precipitously. Starting at the end of last year is when we see the bigger drops in the market.
On the daily chart, notice that prices have been dropping hard since the beginning of May. Also notice the following:
-- Prices are below all the SMAs
-- The SMAs are all moving lower
-- The shorter SMAs are below the longer SMAs
This is a bearish chart, plain and simple
Zions Bancorporation, National City Corp. and First Horizon National Corp. tumbled as Goldman Sachs Group Inc. said regional banks may cut their dividends to restore capital. M&T Bank Corp. slumped the most since 1987 after mortgage losses hurt second- quarter profit. Apple Inc. climbed after selling twice as many of its new iPhones as some analysts had estimated.
.....
``The factors that affected IndyMac are not isolated -- while they're probably more severe, the pressures are evident in other financials,'' said Alan Gayle, the Richmond, Virginia-based senior investment strategist at Ridgeworth Capital Management, which oversees about $74 billion. The Treasury's plan for Fannie Mae and Freddie Mac is ``encouraging, but it does suggest that credit availability is going to remain somewhat impaired and borrowing costs will likely be higher.''
Below is a chart of teh bigger financial institutions as represented by the XLF. Here are two charts of the regional bankshares ETF:
On the weekly chart, notice that prices have been dropping since the beginning of 2007. Part of that is a natural sell-off that occurred after a strong rally. Notice that prices dropped slightly but but precipitously. Starting at the end of last year is when we see the bigger drops in the market.
On the daily chart, notice that prices have been dropping hard since the beginning of May. Also notice the following:
-- Prices are below all the SMAs
-- The SMAs are all moving lower
-- The shorter SMAs are below the longer SMAs
This is a bearish chart, plain and simple
It's A Very Serious Banking Crisis
At least according to someone who should know:
I've touched on this before, but let's return to what the FDIC has said about bank's current conditions:
Those are the bullet points at the beginning of the story. None of them are good. Here is the opening paragraph:
Let's take a look at some graphs from the report:
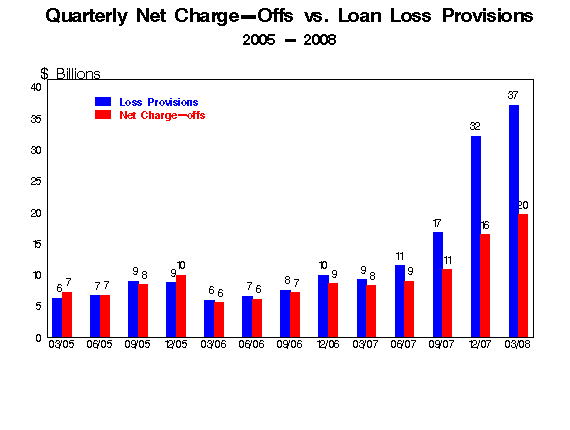
Notice that the amount of money banks are setting aside to absorb losses is increasing, as is the amount of money they are charging off. Neither of these are good developments.
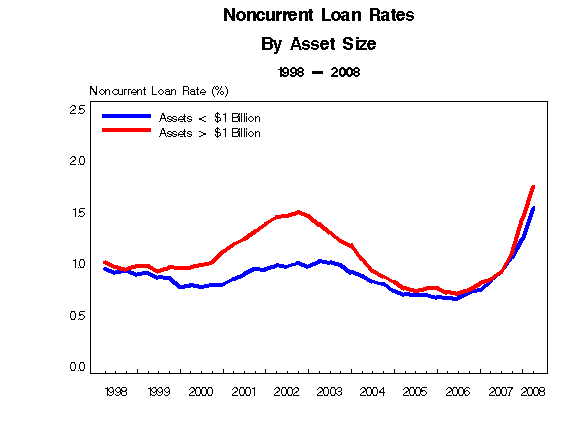
Non-current loan rates are increasing as well
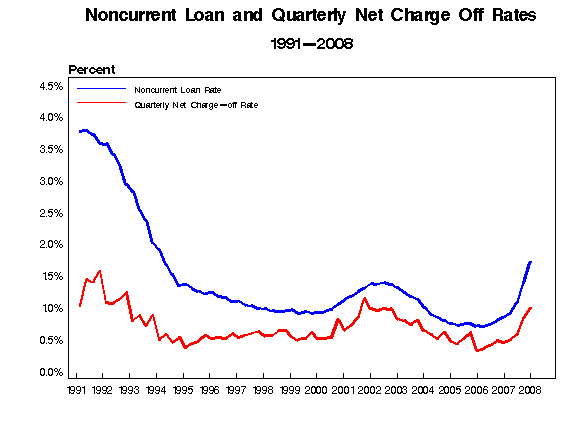
Non-current loan rates and charge offs are also increasing. The non-current loan rate is higher than the highest rate during the last recession. The quarterly net charge off rate is approaching the level it achieved in the last recession.
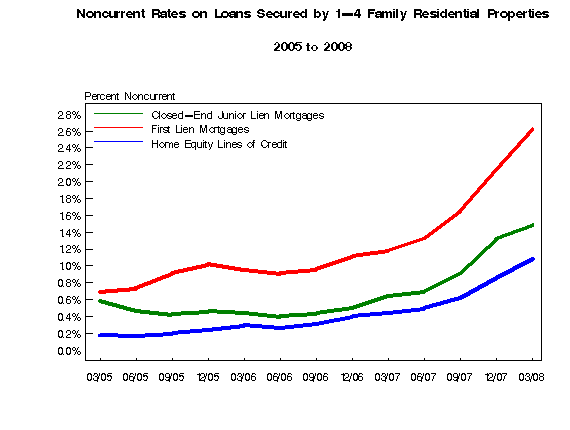
Non-current rates on residential mortgage loans are increasing
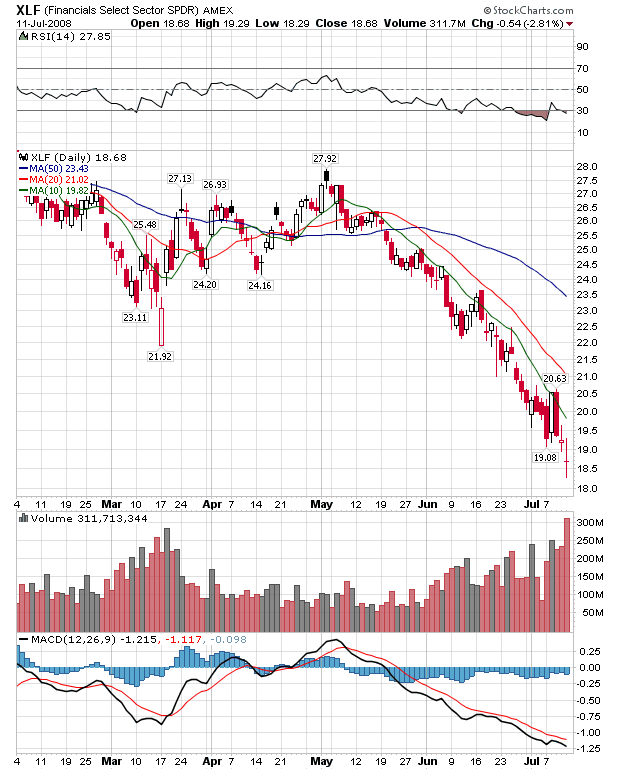
And the charts confirm this problem. Let's take a look at the XLFs which are ETF that tracks the big money firms:
Notice the following:
-- Prices are below all the SMAs
-- The shorter SMAs are below the longer SMAs
-- All the SMAs are headed lower
This is a bear market chart, plain and simple. And it indicates traders are incredibly bearish about the future for financial institutions.
Now - we are not a panic levels by any stretch of the imagination. However, we're also not in a place where we can say "it will all be OK". There is going to be more pain ahead, plain and simple.
"This is a very serious banking crisis. There's just no question about that," said Donald G. Ogilvie, a longtime president of the American Bankers Association and now a senior adviser at Deloitte LLP.
For much of the past decade, borrowers and lenders have been lulled into a sense of security about the safety of the banking system. As real-estate values soared, banks doled out loans that fed the explosion in residential construction, mortgages and home-equity borrowings. Loan defaults hovered at historic lows as home buyers and builders flipped properties and sold them at huge profits.
At the same time, banks fueled the demand for loans by competing fiercely against one another for customer deposits. They wooed customers with new high-yield savings accounts and certificates of deposit, and special Internet-only promotions. Banks now also routinely encourage customers to pay bills online -- a practice that makes it difficult for customers to sever their banking relationships. And customers who keep multiple accounts at the same bank, such as traditional savings deposits, credit-card accounts or CDs, often get the best rates on loans.
But all too often consumers accumulate money in a single bank to earn better returns or end up exceeding the limits covered by federal insurance simply by not paying attention to a growing balance.
I've touched on this before, but let's return to what the FDIC has said about bank's current conditions:
# INDUSTRY EARNINGS DECLINE 46 PERCENT FROM YEAR-EARLIER LEVEL
# LOSS PROVISIONS ABSORB A HIGHER SHARE OF REVENUE
# TROUBLED LOANS ACCUMULATE IN REAL ESTATE PORTFOLIOS
# LENDING GROWTH SLOWS
# FOURTH QUARTER 2007 EARNINGS ARE REVISED BELOW $1 BILLION
Those are the bullet points at the beginning of the story. None of them are good. Here is the opening paragraph:
Deteriorating asset quality concentrated in real estate loan portfolios continued to take a toll on the earnings performance of many insured institutions in first quarter 2008. Higher loss provisions were the primary reason that industry earnings for the quarter totaled only $19.3 billion, compared to $35.6 billion a year earlier. FDIC-insured commercial banks and savings institutions set aside $37.1 billion in loan-loss provisions during the quarter, more than four times the $9.2 billion set aside in first quarter 2007. Provisions absorbed 24 percent of the industry's net operating revenue (net interest income plus total noninterest income) in the quarter, compared to only 6 percent in the first quarter of 2007. The average return on assets (ROA) was 0.59 percent, falling from 1.20 percent in first quarter 2007. The first quarter's ROA is the second-lowest since fourth quarter 1991. The downward trend in profitability was relatively broad: slightly more than half of all insured institutions (50.4 percent) reported year-over-year declines in quarterly earnings. However, the brunt of the earnings decline was borne by larger institutions. Almost two out of every three institutions with more than $10 billion in assets (62.4 percent) reported lower net income in the first quarter, and four large institutions accounted for more than half of the $16.3-billion decline in industry net income.
Let's take a look at some graphs from the report:
Notice that the amount of money banks are setting aside to absorb losses is increasing, as is the amount of money they are charging off. Neither of these are good developments.
Non-current loan rates are increasing as well
Non-current loan rates and charge offs are also increasing. The non-current loan rate is higher than the highest rate during the last recession. The quarterly net charge off rate is approaching the level it achieved in the last recession.
Non-current rates on residential mortgage loans are increasing
And the charts confirm this problem. Let's take a look at the XLFs which are ETF that tracks the big money firms:
Notice the following:
-- Prices are below all the SMAs
-- The shorter SMAs are below the longer SMAs
-- All the SMAs are headed lower
This is a bear market chart, plain and simple. And it indicates traders are incredibly bearish about the future for financial institutions.
Now - we are not a panic levels by any stretch of the imagination. However, we're also not in a place where we can say "it will all be OK". There is going to be more pain ahead, plain and simple.
Market Monday's
Sorry about dropping off the face of the earth on Friday. Mr$. Bonddad and I were traveling and we simply ran out of time before we left.
So, let's get to the charts to see how we're going to start the week.
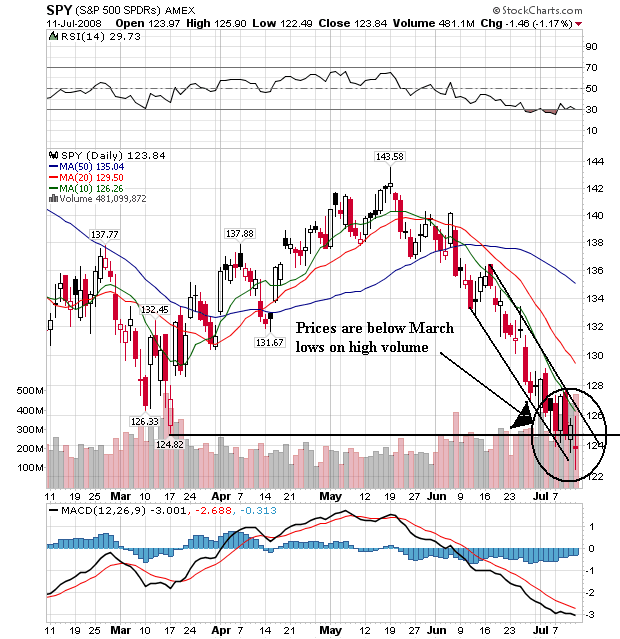
On the daily chart, notice that prices have fallen through March lows on high volume. Remember -- markets have memories. Previously attained price levels are psychologically important. When future prices violate previous prices, it usually means an important change in market psychology. Here, moving below this previously established low is a big deal.
Also note the following:
-- Prices are below all the SMAs including the 200
-- The shorter SMAs are below the longer SMAs
-- All the SMAs are headed lower
All these factors are bear market factors plain and simple
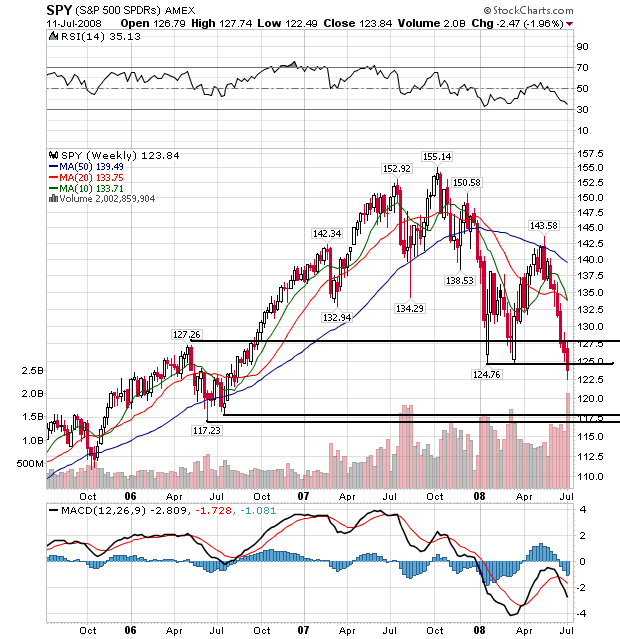
The weekly chart highlights two important points.
-- Prices have dipped below levels established in March
-- Prices dipped on high volume.
This is looking like the beginning of a second wave of a sell-off where prices move through technically important levels on high volume
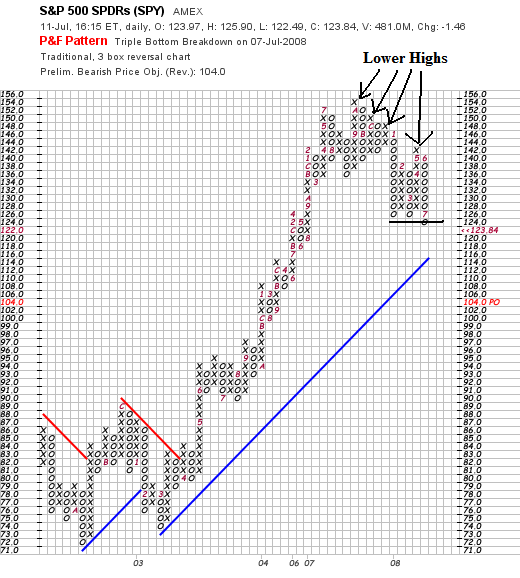
The P&F chart shows two important points:
-- The SPYs have made a series of lower highs, indicating declining momentum
-- The SPYs have broken through the recently established lows
All of the technical indicators tell us the market is not in a good shape.
Subscribe to:
Posts (Atom)