Saturday, July 20, 2024

Weekly Indicators for July 15 - 19 at Seeking Alpha


 - by New Deal democrat


My “Weekly Indicators” post is up at Seeking Alpha.

While several of the monthly updates I’ve discussed here in the past week have tiptoed in the direction of yellow caution flags, that’s not apparent at all in the high frequency data that is updated every week, much of which comes from private sources.

In fact, this week for the first time in a long time, not a single coincident indicators was negative. A majority were positive, and the rest neutral.

As usual, clicking over and reading will bring you up to the virtual moment as to the state of the economy, and reward me a little bit for gathering and organizing the data for you.

Thursday, July 18, 2024

Jobless claims join other data series inching in the direction of yellow caution territory


 - by New Deal democrat


Ever since jobless claims started higher in May, I’ve cautioned that I suspected that unresolved seasonality may be at play. We are now at the point where claims were at their low points for all last summer. In other words, last week through next weeks are the acid test for that hypothesis. Last week the news was good. This week it was more mixed.

Initial jobless claims rose 20,000 to 243,000, while the four week moving average rose 1,000 to 234,750. Continuing claims, with the usual one week delay, rose 20,000 to 1.867 million, the highest level since December 2021. I’ve needed to expand the graph below from its usual 2 year time period in order to show that:


On the YoY basis that is more important for forecasting purposes, initial claims were higher for the first time since early May, up 5.2%. But the less noisy four week average remained lower by -1.1%. Continuing claims were 4.5% higher, still within the lower end of their recent range:


There is an additional seasonal complicating factor this week, in that July 4 fell during different counting weeks last year vs. this year. For the combined 2 week period, initial claims were only 1,500, or 0.6%, higher than last year, at 233,000 vs. 231,500.

This is a very mixed signal, and seems likely to resolve higher YoY next week. The continuing uptrend in continuing claims in particular absolutely speaks to relative weakness in the labor market relative to one and two years ago.

Which brings me to the update of the “Sahm rule” forecast. As I have written numerous times, for over 50 years initial claims have led the unemployment rate. This year that has not been the case, as the unemployment rate has trended higher despite a downturn in initial claims during the first four months of this year. The likely reason is a surge of working age immigrants in the last two years, some of whom are having a more difficult time finding employment. Since they are in the labor force but have not previously held jobs, they are not filing for unemployment benefits.

With that lead-in, here is the updated graph through mid-July:


Both initial and continuing claims suggest that there will be upward pressure on the unemployment rate in the next few months. Since it is already at 4.1%, this suggests a significant chance that it will trigger the “Sahm rule,” although note that the comparison point, of the lowest 3 month average during the past 12 months, will also be moving higher. Because the likely trigger is immigration, however, as I have previously written the economy is likely to be nevertheless expanding - in other words, if triggered it is likely to be a false positive.

A one week 5.2% YoY. Increase in new jobless claims is not nearly enough to trigger even a yellow caution flag. For that we would need, at absolute minimum, a 10%+ comparison lasting multiple weeks. Still, together with the combined economically weighted ISM composite index, real retail sales, and housing under construction, we now have a number of significant sectors signaling weakness.

Wednesday, July 17, 2024

Industrial and manufacturing production close to 10 year+ highs in June


 - by New Deal democrat


If the news in housing construction this morning was cautionary, the news on manufacturing and industrial production was very good.


Manufacturing production (red in the graph below) rose 0.4% in June, and is only 0.2% below its post-pandemic high in October 2022. It is also only 1.2% below its highest level since the Great Recession, which was set in September 2018.

The news was even better for total industrial production (blue), which rose 0.6% in June to a new post-pandemic high, and is only 0.1% below its all-time high, also set in September 2018:


In the past, industrial production has been the King of Coincident Indicators, since its peaks and troughs tended to coincide almost exactly with the onset and endings of recessions. That weighting has faded somewhat since the accession of China to the world trading system in 1999 an the wholesale flight of US manufacturing to Asia, generating several false recession signals, most notably in 2015-16. But it is still an  important measure in the economy. 

In other words, while several important leading indicators are getting close to yellow flag cautionary signals, or in one case (real retail spending) already there, this very important coincident indicator signals all clear for the present.

Housing permits and starts stabilize, but construction comes close to generating yellow recession caution signal


 - by New Deal democrat


There was good news and bad news in this morning’s report on housing permits, starts, and construction. The good news is that both permits and starts stabilized after last month’s initially reported multi-year lows. The bad news is that single family permits declined further, and even worse the metric best showing the actual economic impact of new housing, building units under construction, declined to a new 2+ year low, only slightly above the level where it gives a recession caution signal. 

Let’s start with the good news.  the longest leading signal in the data - permits (black in the graph below) - rose 47,000 or 3.4% on an annualized basis to 1.446 million. Starts (light blue), which are slightly less leading and much more noisy, rose 39,000 or 3.0% to 1.353 million annualized. Further, last month’s abysmal readings for permits and starts were both revised higher.

Now the bad news. Single family permits, which are the least noisy of all the leading data (red, right scale) declined a further -22,000 or 2.3% to 934,000 units annualized:


In other words, the rebound in permits was all about the much noisier multi-family unit sector (gold in the graph below), which increased sharply but not in any way breaking its general downtrend:


Now let’s turn to the bigger bad news. Ill spare you the long term graph this month, but usually it has taken more than a 10% decline in units under construction to be consistent with a recession. In 1970 and 2001, the declines were less than that. But in the late 1980s and 2000s, it took almost a 25% decline before a recession occurred. 

With this morning's further decline, total units under construction (red, right scale) are now -8.6% below peak (vs. permits, black, left scale):


In the past few months I have commented that I did not expect this decline to exceed the -10% level, mainly because mortgage rates had stabilized, and mortgage rates lead permits and starts, which I also expected to stabilize. While obviously the situation is more dicey, I still believe we are getting close to, if not at, a stabilization point for units under construction, because mortgage rates are only slightly higher than they were one year ago, and depending on how you measure, are either generally flat or Elise in a slight uptrend (red, vs. permits, blue, right scale):


At the moment both single family units and multi-family units under construction are both in downtrends, but I expect single family units in particular to stabilize shortly, since that portion of the market was the first to turn down:


Earlier this month, I wrote that the economically weighted average of the ISM indexes was very close to generating a recession caution yellow flag. Yesterday I wrote that consumer spending as measured by retail sales already warranted such a flag. With this morning’s residential construction report, that sector too has gotten close to generating a yellow caution flag. The next big data I will be watching is whether personal spending on goods follows retail sales into cautionary territory, and whether employment in manufacturing and construction (the latter of which typically shortly lags, but follows, building units under construction), neither of which has turned down, change direction in the next few jobs report.

Tuesday, July 16, 2024

The yellow caution flag on retail consumption is up


 - by New Deal democrat


Retail sales declined -0.1% in June, but since consumer inflation also declined -0.1%, real retail sales were unchanged for the month. There was an upward revision to May which helped out the comparisons slightly, but for the entire first half of this year real retail sales have been treading water at a level below last year. The below graph is normed to 100 as of right before the pandemic, and shows the similar measure of real personal consumption of goods (light blue) as well:


There’s been a general slight downtrend in real retail sales ever since the burst of pandemic stimulus spending in early 2021, that fortunately has not been confirmed by the broader measure of real personal spending on goods. On the other hand, real personal consumption of goods has also been lower all this year so far from its peak last December.

We are also down -0.7% YoY:


Although I won’t bother with the historical graph this time around, I’ve note previously In the entire history of real retail sales going back 75 years, much more often than not such downturns foreshadowed a recession within half a year.

Last month I wrote that “the negative YoY retail sales for four of the first five months of this year [ ] is now a real concern, although it has not been confirmed by the similar metric of real personal spending on goods.”

I also said that “Since we are now over three years past the last pandemic stimulus, I suspect real retail sales are also giving a more accurate signal for employment (red in the graph below) in the months ahead, as they did for decades before the pandemic [Here’s the updated graph for this month]:


“Consumption has historically led employment, and this suggests weaker monthly employment reports in the months ahead.” 

It’s worth noting that in the graph above, real personal spending on goos is also lower YoY than payroll employment. It’s also worth recalling that there is good reason to believe that the payroll employment gains of 225,000-300,000 one year ago are likely to be revised significantly lower in view of the poor QCEW comprehensive census for the last two quarters of 2023.

My concluding remark last month was that, especially in view of the relatively poor numbers since the start of this year, real retail sales had to be regarded as raising a caution flag for the economy. That is if anything even more true this month, with an additional month of data, especially where an important component of the economically weighted ISM indexes released at the beginning of this month showed contraction in June.

The yellow flag is up. We’ll get important information about both the manufacturing and construction sectors tomorrow.

Monday, July 15, 2024

The inverted Treasury yield curve: we are in uncharted territory


 - by New Deal democrat


We passed a significant anniversary last week: the spread for the 10 year minus 2 year Treasury has been inverted for over 2 years (blue in the graph below). The 2 year minus 3 month Treasury spread has also been inverted for 20 months (red):


Why is this significant? Because neither spread has been inverted for as long as they have at present without a recession having already started. In fact in a few case the recession has been close to ending, or even already ended!

The closest case was when the 10 year minus 2 year spread inverted at the start of 2006. A recession did not start until 23 months later. 

What happens now? There is no good historical analogy. We are in uncharted terrritory.

As I have pointed out a number of times in years past, the yield curve is not infallible. There was a significant yield curve inversion in 1966-67 without a recession occurring. On the other hand, there were no yield curve inversions at all between 1933 and 1960, and yet there were 6 recessions during that time, including the very deep 1938 recession:


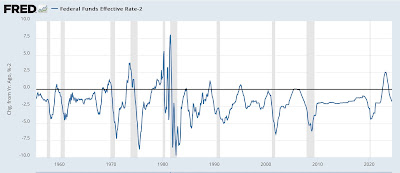
Since the Fed began to more actively manipulate the Fed funds rate in the 1950s, typically a 2% or greater increase in the rate within a year has triggered a recession (graph below subtracts 2% so that a 2% YoY increase shows at the zero line):


There were two false positives (1984 and 1994) and one false negative (2000, when a 1.75% increase in the Fed funds rate over 12 months preceded a recession).

Needless to say, the very aggressive Fed funds rate hikes of 2022 did not trigger a recession in the 2 years since. 

In the case of 1938, it is thought that a very deep fiscal retrenchment was the main trigger for that recession. In the case of 1966, LBJ’s aggressive “guns and butter” fiscal spending kept the economy stimulated enough to avoid a recession (blue line below, showing Federal spending YoY):


And in 2022-23, the unspooling of pandemic-related supply chain bottlenecks more than outweighed interest rate tightening (as shown by the red line below, in which commodity prices declined on average almost 10% during that time):


It just goes to show that no metric is infallible. 

As for what happens now that both the stimulus spending and supply chain unspooling are done, there are two realistic possibilities:

 1. Because interest rates remain very elevated compared to before 2022, their constricting effect has just been delayed.
 2. Because interest rates are even with or below where they were when the supply chain unspooling ended, they are no longer restrictive relative to that period, so the economy should continue on trend.

As I said above, we are in uncharted territory. There is no on point historical analogue. That’s why I am watching the leading sectors of manufacturing and construction so closely this year. We’ll get updates on both of them for June later this week.