While the overall level of inflation across the globe is generally under control (a point I'll develop later this week), there are two countries that are experiencing increased inflationary pressures: India and Brazil.
The following is from the latest interest rate announcement from the reserve bank of India
5. The year-on-year headline WPI inflation edged up to 6.8 per cent in February 2013 from 6.6 per cent in January, essentially reflecting the upward revisions effected to administered prices of petroleum products. On the other hand, non-food manufactured products inflation, and its momentum, continued to ebb along the trajectory that began in September 2012, enabled by softening prices of metals, textiles and rubber products. Worryingly, retail inflation continued on the upward path that set in from October 2012, with the new combined (rural and urban) CPI (Base: 2010=100) inflation at a high of 10.9 per cent in February 2013 on sustained price pressures from food items, especially cereals and proteins. Consequently, the divergence between wholesale and consumer price inflation continued to widen during the year.
This high level of inflation is a big concern for the bank going forward:
12. On the inflation front, some softening of global commodity prices and lower pricing power of corporates domestically is moderating non-food manufactured products inflation. However, the unrelenting rise in food inflation is keeping headline wholesale price inflation above the threshold level and consumer price inflation in double digits. Also, there is still some suppressed inflation related to administered prices which carries latent inflationary pressures. All this complicates the task of inflation management and underscores the imperative of addressing supply constraints. From an inflation perspective, upward revisions in the minimum support prices (MSP) should warrant caution in view of their implications for overall inflation.
Oddly enough, India has high interest rates. The RBI recent cut rates, but they were cut to 7.5%. And here's a chart of the 10-year government bond yield:
As for Brazil, consider this from the latest Brazilian inflation report:
The inflation measured by the 12-month IPCA reached 6.31% in February, 0.46 percentage points (p.p.) higher than the rate recorded in February 2012. Market prices increased 7.86% in the 12-month period up to February (up 1.89 p.p. against February 2012), while regulated prices rose 1.53% (down 3.95 p.p. against February 2012). The services sector inflation, which has been higher than total market prices, has reached 8.66% in the 12-month period up to February. The Copom evaluates that the greater dispersion of consumer price increases recently observed, seasonal pressures and pressures localized in the transportation segment, among other factors, contribute for inflation resistance.
Here's a chart of their inflation rate, which shows an obvious increase:
Brazil's discount rate is currently at 7.25%. In addition, here is the chart of Brazil's 10-year bond yield:
So -- the two countries with some of the highest rates in the world are also experiencing country specific inflation spikes.
Showing posts with label inflation. Show all posts
Monday, April 1, 2013
Friday, April 13, 2012
The weakness begins
- by New Deal democrat
With the release of producer and consumer inflation figures yesterday and today, it is safe to say that the period of maximum weakness forecast by the downturn in the long leading indicators over a year ago has begun. Notice I didn't say "recession." Neither the increase in initial claims yesterday, nor the inflation data, causes me to re-think that position I just re-examined within the last month (a period of weakness now, followed by relative strength later in the year). But weak data is likely to persist for several months at least.
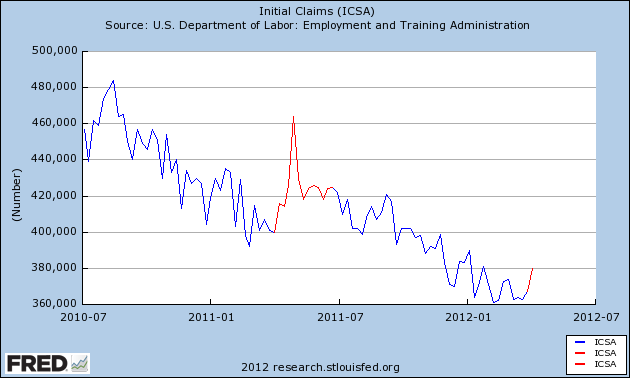
First, let's briefly look at initial jobless claims. Prof. Dean Baker says not to panic, the increase is due to the non-winter winter distorting seasonal patterns.
That may be true, but on the other hand, there may be a different seasonality at work. The below graph includes the last 2 years of claims, and highlights April through June last year and claims since April 1 of this year in red:

It may be that the recent re-jiggering of seasonal adjustments was incomplete, or it may reflect increased layoffs due to the seasonal increase in gasoline prices tightening the choke collar on the economy.
Next, let's examine commodity, producer, and consumer prices. What is noteworthy is that, after a period of heightened commodity and producer price inflation, those are now declining on a YoY basis to the point where they are equal to or below consumer inflation. As of today, YoY CPI is +2.7%. YoY Commodity inflation is now +2.6%, and producer prices YoY are +2.8%. In the past, as I will describe more below, when the rate of commodity and producer price inflation goes from higher than to lower than consumer inflation, it has almost always coincided with weakness.
The inflation data isn't leading, it is coincident. But by examining the last few periods of weakness, we can get a very good idea how long it is likely to persist. (Note: the graphs below do not include this morning's CPI data).
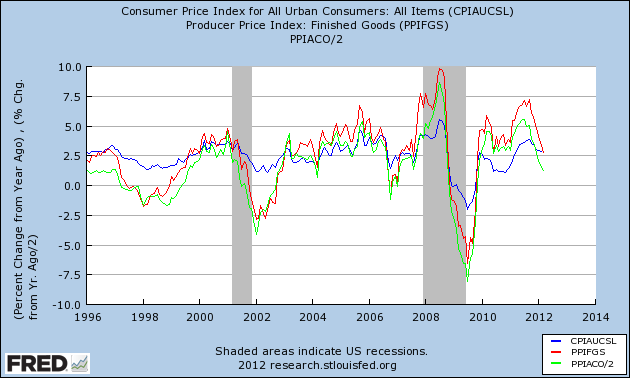
First of all, here's a look at YoY consumer prices (blue), finished producer prices (red) and commodity prices (light green) since 1996 (note: I've divided the change in commodity prices by 2 for better scale only):

Notice that there have been 4 periods of relatively weak commodity and producer prices since 1996. Notice further that just prior to both recessions since then, commodity and producer prices ran much hotter than consumer prices. They crossed consumer prices about 1/3 of the way into each recession, and each recession ended when YoY commodity and producer price changes were at their lowest. This by the way is also exactly the pattern for the pre-WW2 deflationary recessions, including both the Great Contraction of 1929-32, and the Recession of 1938. That YoY commodity and producer price changes have now become weaker than YoY consumer prices tell us we have entered the period of maximum weakness.
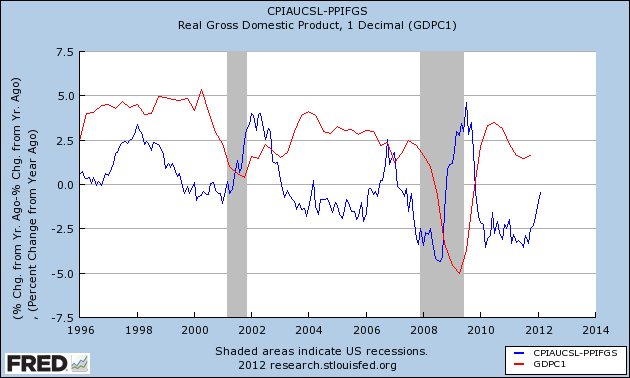
In the next few graphs, I've subtracted producer prices from consumer prices. Thus a negative reading is a period when producer prices are growing faster than consumer prices. In the first, these are compared with YoY GDP (red):

Negative readings don't always mean negative GDP (remember the importance of consumer debt refinancing at lower rates). But when producer and commodity prices suddenly become weaker than consumer prices, at minimum a bout of weakness (1998, 2002, 2006) if not recession (2001, 2008) follows.
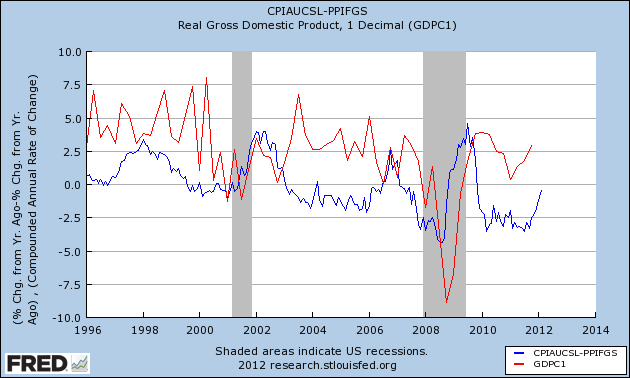
Next is the same relationship, except that the comparison is with quarterly changes in GDP:

When we make this substitution, we get a noisier relationship, but on the other hand you can see that quarterly GDP changes track the relative weakness or strength of consumer vs. producer prices very closely, as in only one or two quarters later.
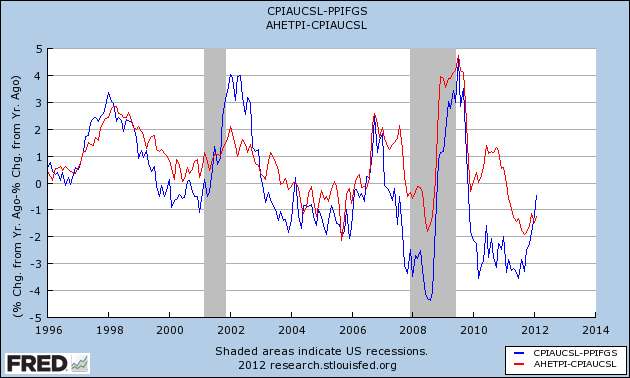
Since it is weakness in inflation-adjusted wages that in part triggers the economic weakness, next let's compare real wages (red) with producer vs. consumer prices:

Note that once again, while there is noise, the two tend to move in tandem. Thus as producer prices weaken, we should expect to see real wages improve.
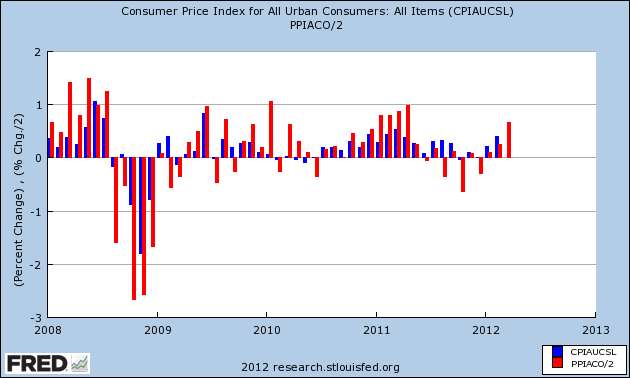
How long will the weakness last? As I've repeated above, the weakness bottoms almost exactly when producer and commodity prices are at their YoY weakest. That isn't as difficult to predict as it may seem. In each of the 4 periods of relative weakness since 1996 shown in the first graph above, the weakest point came within one month of exactly one year after the highest monthly producer and commodity price reading. The last 5 years of commodity (red, dividing by 2 for scale) vs. consumer (blue) price changes are shown in the bar graph below:

In 2008, the last strongly inflationary month was July. Barring a deflationary spiral, it wasn't too difficult to foresee that the maximum YoY reading in commodity prices would be July 2009. Based on past deflationary recessions, including the Great Depression, that meant the "Great Recession" was likely to bottom in about that month. That was a strong contributing factor in my ability to foresee when that recession would bottom in advance.
In 2011, the last strong inflationary month was April. Unless there is a severe recession, it is unlikely that YoY commodity prices will continue to decline after July, or September at the latest. Better real wages and improving business profitability caused by the greater decline in commodity prices should assert themselves beginning at that time. That means this period of weakness should start to abate sometime during the summer -- i.e., too short and too shallow to be considered a recession.
With the release of producer and consumer inflation figures yesterday and today, it is safe to say that the period of maximum weakness forecast by the downturn in the long leading indicators over a year ago has begun. Notice I didn't say "recession." Neither the increase in initial claims yesterday, nor the inflation data, causes me to re-think that position I just re-examined within the last month (a period of weakness now, followed by relative strength later in the year). But weak data is likely to persist for several months at least.
First, let's briefly look at initial jobless claims. Prof. Dean Baker says not to panic, the increase is due to the non-winter winter distorting seasonal patterns.
That may be true, but on the other hand, there may be a different seasonality at work. The below graph includes the last 2 years of claims, and highlights April through June last year and claims since April 1 of this year in red:

It may be that the recent re-jiggering of seasonal adjustments was incomplete, or it may reflect increased layoffs due to the seasonal increase in gasoline prices tightening the choke collar on the economy.
Next, let's examine commodity, producer, and consumer prices. What is noteworthy is that, after a period of heightened commodity and producer price inflation, those are now declining on a YoY basis to the point where they are equal to or below consumer inflation. As of today, YoY CPI is +2.7%. YoY Commodity inflation is now +2.6%, and producer prices YoY are +2.8%. In the past, as I will describe more below, when the rate of commodity and producer price inflation goes from higher than to lower than consumer inflation, it has almost always coincided with weakness.
The inflation data isn't leading, it is coincident. But by examining the last few periods of weakness, we can get a very good idea how long it is likely to persist. (Note: the graphs below do not include this morning's CPI data).
First of all, here's a look at YoY consumer prices (blue), finished producer prices (red) and commodity prices (light green) since 1996 (note: I've divided the change in commodity prices by 2 for better scale only):

Notice that there have been 4 periods of relatively weak commodity and producer prices since 1996. Notice further that just prior to both recessions since then, commodity and producer prices ran much hotter than consumer prices. They crossed consumer prices about 1/3 of the way into each recession, and each recession ended when YoY commodity and producer price changes were at their lowest. This by the way is also exactly the pattern for the pre-WW2 deflationary recessions, including both the Great Contraction of 1929-32, and the Recession of 1938. That YoY commodity and producer price changes have now become weaker than YoY consumer prices tell us we have entered the period of maximum weakness.
In the next few graphs, I've subtracted producer prices from consumer prices. Thus a negative reading is a period when producer prices are growing faster than consumer prices. In the first, these are compared with YoY GDP (red):

Negative readings don't always mean negative GDP (remember the importance of consumer debt refinancing at lower rates). But when producer and commodity prices suddenly become weaker than consumer prices, at minimum a bout of weakness (1998, 2002, 2006) if not recession (2001, 2008) follows.
Next is the same relationship, except that the comparison is with quarterly changes in GDP:

When we make this substitution, we get a noisier relationship, but on the other hand you can see that quarterly GDP changes track the relative weakness or strength of consumer vs. producer prices very closely, as in only one or two quarters later.
Since it is weakness in inflation-adjusted wages that in part triggers the economic weakness, next let's compare real wages (red) with producer vs. consumer prices:

Note that once again, while there is noise, the two tend to move in tandem. Thus as producer prices weaken, we should expect to see real wages improve.
How long will the weakness last? As I've repeated above, the weakness bottoms almost exactly when producer and commodity prices are at their YoY weakest. That isn't as difficult to predict as it may seem. In each of the 4 periods of relative weakness since 1996 shown in the first graph above, the weakest point came within one month of exactly one year after the highest monthly producer and commodity price reading. The last 5 years of commodity (red, dividing by 2 for scale) vs. consumer (blue) price changes are shown in the bar graph below:

In 2008, the last strongly inflationary month was July. Barring a deflationary spiral, it wasn't too difficult to foresee that the maximum YoY reading in commodity prices would be July 2009. Based on past deflationary recessions, including the Great Depression, that meant the "Great Recession" was likely to bottom in about that month. That was a strong contributing factor in my ability to foresee when that recession would bottom in advance.
In 2011, the last strong inflationary month was April. Unless there is a severe recession, it is unlikely that YoY commodity prices will continue to decline after July, or September at the latest. Better real wages and improving business profitability caused by the greater decline in commodity prices should assert themselves beginning at that time. That means this period of weakness should start to abate sometime during the summer -- i.e., too short and too shallow to be considered a recession.
Wednesday, April 4, 2012
1955: Interest Rates, Inflation and Fed Policy
Remember that during 1955, the economy was growing at very strong rates. As the economy expanded, businesses increased their borrowings. In addition, as the economy expanded, the Fed became more and more concerned with inflation. This is the reason for the increase in the discount rate during the year. Consider the following excerpts from various rate decisions by the Fed:
From April 13:
November 17:
However, prices were in fact pretty contained:
The bottom whole sale price chart shows that crude goods were decreasing in price. The real price pressure was coming at the intermediate price level, but producers were able to absorb that cost, as evidenced by the slow rise of finished goods prices. The top chart shows that food prices were dropping sharply, while other prices were moving higher.
Consumer prices were also pretty contained. The primary area where we see an increase are in services, which is to be expected; this year -- and this decade -- saw a tremendous increase in service usage on the part of consumers. As the US started to form households, they purchased more and more goods such as dry cleaners, yard services etc....
Wednesday, December 21, 2011
1950s: The Discount Rate and 1950 Inflation
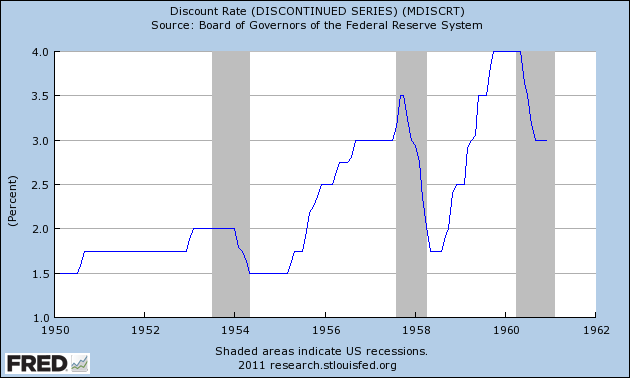
The above chart shows the Federal Reserve's Discount Rate for the 1950s. Note that in the middle and end of the decade we see the Fed increasing rates to such a degree that they create a recession. Then we see the Fed lower rates during the recession to spur growth. This is what most people think of when they think of "recession and recovery."
That being said, let's take a look at inflation in the year 1950, as it explains the increase in the discount rate.
PPI continued to increase on a YOY rate, eventually reaching nearly 15%, while CPI continued to escalate as well, eventually hitting hear 6%. So -- what caused these price increases?
1.) Massive demand. PCEs increased at incredibly strong rates for the first three quarters of the year. This led to a classic case of demand pull inflation. Food prices were a big reason for the increase (which increased 4.8% from December 1949 to November 1950), as was an increase in house hold furnishings (which increased 9.1% from December 1949 to November 1950).
2.) The Korean War outbreak led to massive increases in raw material prices. As the ERP notes, 75% of industrial goods had increased in price by mid-October, 44% had risen 10% or more, and 26% were up 20% or more above the pre-Korean war levels.
As an aside, here are the charts from the Economic Report to the President for both Whole
sale and Consumer prices.
Wednesday, March 16, 2011
Three eras of Inflation
- by New Deal democrat
If you would like to donate for Japan relief, here is a link to the Red Cross..
This week we will get February's producer and consumer inflation readings. While a lot of attention will be paid to food and energy prices, the overall allocation of commodity price increases between producers and consumers has received little attention. While the variation in any one month appears trivial, the long-term trajectories of producer vs. consumer prices tell an important story about how much of the burden has been borne by consumers vs. how much has been retained by producers. Since World War 2, there have in fact been three eras of inflation.
In the post WW2 "Great Compression" of incomes, where the middle and working class fully shared in America's prosperity, producer and consumer prices moved generally in lockstep. With the exception of the Vietnam war inflation of the late 1960's, producer inflation (red) - and only that inflation - was passed on to consumers (blue):

The came the Reagan era of the "great moderation" and of the 18 year bull market in stocks, in which declining interest rates, automation and offshoring meant that producer price increases were kept to a minimum, and consumer prices increased far beyond those paid by producers. Put another way, in inflation terms the middle and working classes were gouged:

By about 2000, consumers had reached the end of their rope. Only easy credit fueled a temporary binge during the Bush years. Producers have been unable to pass on price increases to consumers, for the simple reason that consumers can no longer afford them:

This is why I do not see a general inflation (as opposed to Oil price inflation) as a threat to the economy. Producers who increase prices due to commodity price increases will be met with a downturn in consumer demand (just as happened in 2008). They won't recoup their losses, instead some of them will go out of business. Those who are able will increase the hours and obligations of salaried employees, or hire new workers at lower wages than before. Inflationary spikes will be temporary and will be quickly offset with a deflationary response. In milder cases this will lead to a slowdown as during last summer. In severe cases there will be another deflationary bust.
If you would like to donate for Japan relief, here is a link to the Red Cross..
This week we will get February's producer and consumer inflation readings. While a lot of attention will be paid to food and energy prices, the overall allocation of commodity price increases between producers and consumers has received little attention. While the variation in any one month appears trivial, the long-term trajectories of producer vs. consumer prices tell an important story about how much of the burden has been borne by consumers vs. how much has been retained by producers. Since World War 2, there have in fact been three eras of inflation.
In the post WW2 "Great Compression" of incomes, where the middle and working class fully shared in America's prosperity, producer and consumer prices moved generally in lockstep. With the exception of the Vietnam war inflation of the late 1960's, producer inflation (red) - and only that inflation - was passed on to consumers (blue):

The came the Reagan era of the "great moderation" and of the 18 year bull market in stocks, in which declining interest rates, automation and offshoring meant that producer price increases were kept to a minimum, and consumer prices increased far beyond those paid by producers. Put another way, in inflation terms the middle and working classes were gouged:

By about 2000, consumers had reached the end of their rope. Only easy credit fueled a temporary binge during the Bush years. Producers have been unable to pass on price increases to consumers, for the simple reason that consumers can no longer afford them:

This is why I do not see a general inflation (as opposed to Oil price inflation) as a threat to the economy. Producers who increase prices due to commodity price increases will be met with a downturn in consumer demand (just as happened in 2008). They won't recoup their losses, instead some of them will go out of business. Those who are able will increase the hours and obligations of salaried employees, or hire new workers at lower wages than before. Inflationary spikes will be temporary and will be quickly offset with a deflationary response. In milder cases this will lead to a slowdown as during last summer. In severe cases there will be another deflationary bust.
Thursday, October 8, 2009
A Note on Inflation
Click on all images for a larger image

The above chart shows a very simple economic truth: you always want a little inflation in the economy. A little inflation indicates that there is enough pricing power somewhere in the buying cycle for someone to raise prices. And that indicates there is enough demand pull or cost push inflation that is the result of increasing economic activity. Now we can debate the proper level of inflation for the economy, but the bottom line is we always want some.

A.) This is what scared the hell out of everybody. It is deflation:
This was a primary reason why there was such a rush to get the stimulus package done. It looked as though we were going to start a deflationary spiral. This is one of the primary causes of the Great Depression -- a general collapse in prices caused by a corresponding drop in demand.
B.) Now we again have inflation -- a slight increase in prices. That tells us that somewhere out there in the economy is pricing power - the ability to raise prices. That means that somewhere there is enough demand pull or cost push inflation to be able to increase prices. And that is an incredibly health and important economic development.

The above chart shows a very simple economic truth: you always want a little inflation in the economy. A little inflation indicates that there is enough pricing power somewhere in the buying cycle for someone to raise prices. And that indicates there is enough demand pull or cost push inflation that is the result of increasing economic activity. Now we can debate the proper level of inflation for the economy, but the bottom line is we always want some.

A.) This is what scared the hell out of everybody. It is deflation:
A general decline in prices, often caused by a reduction in the supply of money or credit. Deflation can be caused also by a decrease in government, personal or investment spending. The opposite of inflation, deflation has the side effect of increased unemployment since there is a lower level of demand in the economy, which can lead to an economic depression. Central banks attempt to stop severe deflation, along with severe inflation, in an attempt to keep the excessive drop in prices to a minimum.
This was a primary reason why there was such a rush to get the stimulus package done. It looked as though we were going to start a deflationary spiral. This is one of the primary causes of the Great Depression -- a general collapse in prices caused by a corresponding drop in demand.
B.) Now we again have inflation -- a slight increase in prices. That tells us that somewhere out there in the economy is pricing power - the ability to raise prices. That means that somewhere there is enough demand pull or cost push inflation to be able to increase prices. And that is an incredibly health and important economic development.
Wednesday, June 24, 2009
Why Inflation Isn't A Problem
A poster asked me to explain my position on inflation. First, here is a link to an article I wrote that outlines some of the issues. Please note the article I wrote with Invictus was published before Krugman's. Here are two other excerpts from NY Times editorials on the issue.
Paul Krugman:
Alan Blinder:
I just don't see it right now.
Paul Krugman:
First things first. It’s important to realize that there’s no hint of inflationary pressures in the economy right now. Consumer prices are lower now than they were a year ago, and wage increases have stalled in the face of high unemployment. Deflation, not inflation, is the clear and present danger.
So if prices aren’t rising, why the inflation worries? Some claim that the Federal Reserve is printing lots of money, which must be inflationary, while others claim that budget deficits will eventually force the U.S. government to inflate away its debt.
The first story is just wrong. The second could be right, but isn’t.
Now, it’s true that the Fed has taken unprecedented actions lately. More specifically, it has been buying lots of debt both from the government and from the private sector, and paying for these purchases by crediting banks with extra reserves. And in ordinary times, this would be highly inflationary: banks, flush with reserves, would increase loans, which would drive up demand, which would push up prices.
But these aren’t ordinary times. Banks aren’t lending out their extra reserves. They’re just sitting on them — in effect, they’re sending the money right back to the Fed. So the Fed isn’t really printing money after all.
Still, don’t such actions have to be inflationary sooner or later? No. The Bank of Japan, faced with economic difficulties not too different from those we face today, purchased debt on a huge scale between 1997 and 2003. What happened to consumer prices? They fell.
Alan Blinder:
Rather, it’s more like a grand version of what the Fed does every Christmas season. The Fed always puts more currency into circulation during this prime shopping period because people demand it, and then withdraws the “excess” currency in January.
True inflation hawks worry about that last step. (Did someone say, “Bah, humbug”?) Will the Fed really withdraw all those reserves fast enough as the financial storm abates? If not, we could indeed experience inflation. Although the Fed is not infallible, I’d make three important points:
•
The possibilities for error are two-sided. Yes, the Fed might err by withdrawing bank reserves too slowly, thereby leading to higher inflation. But it also might err by withdrawing reserves too quickly, thereby stunting the recovery and leading to deflation. I fail to see why advocates of price stability should worry about one sort of error but not the other.
•
The Fed is well aware of the exit problem. It is planning for it, is competent enough to carry out its responsibilities and has committed itself to an inflation target of just under 2 percent. Of course, none of that assures us that the Fed will hit the bull’s-eye. It might miss and produce, say, inflation of 3 percent or 4 percent at the end of the crisis — but not 8 or 10 percent.
•
The Fed will start the exit process when the economy is still below full employment and inflation is below target. So some modest rise in inflation will be welcome. The Fed won’t have to clamp down hard.
I just don't see it right now.
Thursday, June 4, 2009
Monday, December 1, 2008
Inflation, the Depression and Other Ruminations
There has been a lot of talk lately using the word "depression." I am in no way an expert on this event. But given the recent increase in the use of the word depression I think it would be a good idea to look at some of the economic items from that period.
Let's start with inflation. Here is a chart from the St. Louis Federal Reserve that shows the year over year percentage change in inflation.

Click for a larger image
Let's start by assuming inflation measuring statistics were less developed in the 1920s than now. That being said, this is all we've got from that period. So -- let's see what this chart says.
First, notice there were two recessions during this period. According to the NBER these were May '23 - July '24 and October '26 - November '27. But also notice the lack of year over year growth for the last four years of the decade. A little inflation is a good thing -- it indicates there is either a strong demand to increase prices or a strong enough increase in costs to allow companies to increase prices. Either way, a little inflation is healthy. However -- there was no inflation for the last four years of the decade. That is not healthy at all.

Click for a larger image
Above is the year over year percentage change in inflation from 1930 - 1939. Notice the price collapse in the first four years of the decade. From 1930 - 1934 year over year price movements s were negative. That's a heck of a lot of economic damage to recover from. Notice that year over year prices came back in 1935, but because this number was an increase from a huge drop I would argue it wasn't until 1936 at the earliest that prices got back to a healthy rate of increase. And then it would still take a few years to get back to 1930 levels.
So -- what have we learned? Deflation was an obvious issue in the 1930s. And deflation is not good.
Let's start with inflation. Here is a chart from the St. Louis Federal Reserve that shows the year over year percentage change in inflation.

Click for a larger image
Let's start by assuming inflation measuring statistics were less developed in the 1920s than now. That being said, this is all we've got from that period. So -- let's see what this chart says.
First, notice there were two recessions during this period. According to the NBER these were May '23 - July '24 and October '26 - November '27. But also notice the lack of year over year growth for the last four years of the decade. A little inflation is a good thing -- it indicates there is either a strong demand to increase prices or a strong enough increase in costs to allow companies to increase prices. Either way, a little inflation is healthy. However -- there was no inflation for the last four years of the decade. That is not healthy at all.

Click for a larger image
Above is the year over year percentage change in inflation from 1930 - 1939. Notice the price collapse in the first four years of the decade. From 1930 - 1934 year over year price movements s were negative. That's a heck of a lot of economic damage to recover from. Notice that year over year prices came back in 1935, but because this number was an increase from a huge drop I would argue it wasn't until 1936 at the earliest that prices got back to a healthy rate of increase. And then it would still take a few years to get back to 1930 levels.
So -- what have we learned? Deflation was an obvious issue in the 1930s. And deflation is not good.
Friday, June 20, 2008
What Inflation?
From Bloomberg:
Considering the spike in commodity prices, this news should not be surprising. There are several things to note from this article.
1.) Spiking commodity prices are hitting everyone -- not just the US
2.) There has been a fair amount of discussion about "de-linking", meaning the US slowdown will not effect the rest of the world. This news should indicate that idea is a fantasy. One of the US primary problems right now high commodity prices which are a prime cause for India's and China's problem.
3.) As long as commodity prices remain high, expect more and more upward pressure on worldwide interest rates
Also consider this news, also from Bloomberg:
Trichet has consistently stated that price stability is his primary concern. In addition, EU rates are still higher than US levels -- adding to the euro's overall strength right now.
India's inflation accelerated to a 13-year high and economists forecast higher consumer prices in China after record crude oil forced both nations to increase the regulated cost of fuel.
India's wholesale prices jumped 11.05 percent in the week to June 7, the government said today, more than the median 9.79 percent increase in a Bloomberg News survey of 18 economists. China's fuel price increase today may lift consumer prices by as much as 1 percentage point this year, a separate survey showed.
A near doubling of crude oil prices has pushed up subsidy costs and threatened to erode profits of refiners such as Indian Oil Corp., prompting governments from Indonesia to Sri Lanka to raise fuel prices. That's adding pressure on central banks to increase interest rates and cool inflation, risking growth.
``If China and India are going to continue to roll back subsidies, then clearly we have not seen a peak in inflation,'' said Joseph Tan, a strategist at Fortis Bank SA in Singapore. ``They need to tighten monetary policy, which means that growth is going to slow.''
Considering the spike in commodity prices, this news should not be surprising. There are several things to note from this article.
1.) Spiking commodity prices are hitting everyone -- not just the US
2.) There has been a fair amount of discussion about "de-linking", meaning the US slowdown will not effect the rest of the world. This news should indicate that idea is a fantasy. One of the US primary problems right now high commodity prices which are a prime cause for India's and China's problem.
3.) As long as commodity prices remain high, expect more and more upward pressure on worldwide interest rates
Also consider this news, also from Bloomberg:
German producer-price inflation, an early indicator of price pressures in the economy, accelerated to the fastest pace in almost two years in May on energy costs.
Prices for goods from newsprint to plastics increased 6 percent from a year earlier, the most since July 2006, the Federal Statistics Office in Wiesbaden said today. Economists expected a 5.8 percent gain, the median of 27 estimates in a Bloomberg News survey shows. Prices rose 1 percent from April.
Inflation has been pushed up by record energy and food prices, crimping consumers' spending power and clouding the outlook for economic growth across the 15-nation euro region. European Central Bank President Jean-Claude Trichet said on June 5 that the bank may increase its benchmark rate next month to rein in inflation expectations.
``The pressure in the inflation pipeline is still very high and will rise in coming months,'' said Andreas Rees, chief economist Germany at UniCredit Markets & Investment Banking in Munich. ``The ECB will point to inflation dangers to justify an interest-rate hike in July.''
Energy prices rose 15 percent from a year earlier and oil products were 25.9 percent more expensive, the statistics office said. Excluding energy, producer prices rose 2.9 percent.
Trichet has consistently stated that price stability is his primary concern. In addition, EU rates are still higher than US levels -- adding to the euro's overall strength right now.
Tuesday, June 17, 2008
What Inflation? Part II
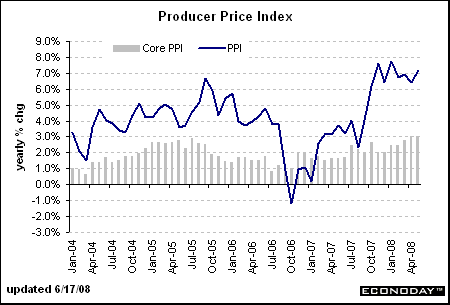
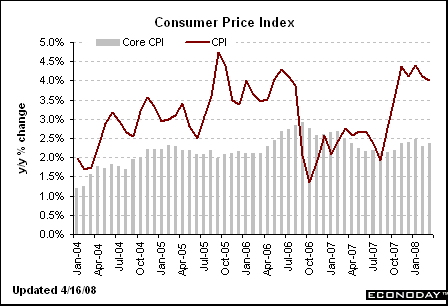
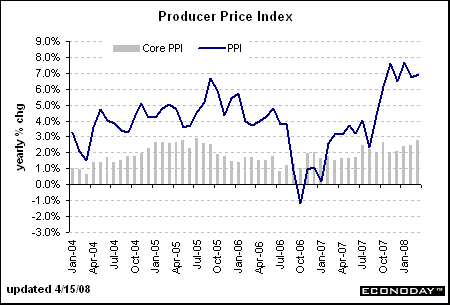
Here are two charts that show the year over year increase in CPI and PPI


Things aren't looking that good right now.


Things aren't looking that good right now.
What Inflation?
I have a mixed feeling about the possibility of future inflation. On one hand, commodity prices are still increasing. Oil is touching new highs nearly every day and agricultural prices are spiking thanks for floods in Iowa. On the other side, there's an old adage: "nothing cures high prices like high prices." In other words, high prices (in and of themselves) create incentives for people to purchase cheaper substitutes (if they exist) or to produce more of the high-priced good in an attempt to make money.
So, with the two stories listed below the question to ask is, "are these the type of price spikes that will create incentives for lower prices down the road?"
From Bloomberg:
From Bloomberg:
So, with the two stories listed below the question to ask is, "are these the type of price spikes that will create incentives for lower prices down the road?"
From Bloomberg:
U.K. inflation reached the highest since at least 1997 in May, and Bank of England Governor Mervyn King predicted it will exceed 4 percent later this year, adding to speculation that the economy will fall into a recession.
The Monetary Policy Committee ``is concerned about the present and prospective period of above-target inflation,'' King wrote in a letter to the government, after the Office for National Statistics said consumer prices climbed 3.3 percent from a year earlier last month. ``The path of bank rate that will be necessary to meet the 2 percent target is uncertain.''
.....
Policy makers ``are going to sit on their hands for the time being since there's not really much they can do for the moment,'' said George Buckley, chief U.K. economist at Deutsche Bank AG in London. ``They need to see what the economy does first.''
From Bloomberg:
European inflation accelerated to the highest in 16 years last month as food and energy costs soared, intensifying what finance ministers from the world's richest nations said is becoming a ``more complicated'' dilemma.
The inflation rate in the euro area rose to 3.7 percent, the highest since June 1992, from 3.3 percent in April, the European Union's statistics office in Luxembourg said today. The rate for May is higher than the 3.6 percent estimate published on May 30.
Soaring commodity prices have pushed up costs for companies and consumers and at the same time are posing a ``serious challenge'' to economic growth, officials from the Group of Eight nations said yesterday after a meeting in Japan. European Central Bank President Jean-Claude Trichet this month said the ECB may raise its benchmark interest rate a quarter point in July, signaling he is setting aside concerns about the economy's expansion to combat inflation.
With inflation accelerating ``it becomes increasingly difficult to argue against an ECB hike in July,'' said Carsten Brzeski, an economist at ING Group in Brussels. ``However, we still believe that a July rate hike would be a one-off, mainly to flaunt the ECB's willingness to fight any second-round effects.''
Wednesday, June 11, 2008
Inflation On the Brain
There is a ton of news today about inflation. Consider the following:
From the WSJ:
From Bloomberg:
Tie this information to the CRB chart below, especially the following points.
1.) The weekly chart is still in a major rally.
2.) The daily chart is still bullishly aligned
3.) The P&F chart shows a series of multiple new highs.
These developments explain the following statement from Bernanke's most recent speech:
NY Fed President Geithner echoed Bernanke's sentiment:
And Treasury Secretary Paulson has supposed dollar intervention which is a de facto way to cure inflation caused by the dropping dollar:
Now -- US officials have talked a good game for awhile, but haven't done anything. Let's see if they are will to act.
From the WSJ:
Inflation worries are heating up around the world and jolting financial markets in the process.
On Tuesday, China's stock market was the latest to feel the blow, with the benchmark Shanghai Composite Index tumbling by 7.7%, to its lowest close this year. The drop came after the government announced steps to remove cash from the financial system in an attempt to tamp down inflation.
.....Also Tuesday, officials in Vietnam effectively devalued their currency in a step aimed at easing market pressures related to soaring inflation rates. (See related article.)
And in the U.S., investors sold off U.S. Treasury securities, one day after Federal Reserve Chairman Ben Bernanke warned that the run-up in oil prices is adding to upside risks for inflation. The price of the two year Treasury note, most sensitive to the Fed's moves, has fallen sharply (and its yield has risen) as investors grow convinced that the central bank may have to raise rates this autumn to contain inflation. On Tuesday, the two-year note's yield was 2.9%, up from 2.4% on Friday, marking a major jump in that rate.
Meanwhile, the Bank of Canada surprised markets Tuesday by holding off on an expected interest-rate cut; the central bank said the risk of inflation, driven by high energy prices, had grown too great to allow for further rate cuts. The European Central Bank is also considering interest rate increases to fend off inflation.
From Bloomberg:
European Central Bank board member Juergen Stark damped speculation of a series of interest-rate increases, saying policy makers have signaled only that they may raise borrowing costs in July.
``The markets have understood the Governing Council's signal,'' Stark, 60, said in an interview in Chatham, Massachusetts, late yesterday. ``However, we are not talking about a series of rate increases.''
ECB President Jean-Claude Trichet said last week the bank may raise its benchmark rate by a quarter-point to 4.25 percent in July to curb inflation, which is running at the fastest pace in 16 years. Investors responded by increasing bets on higher borrowing costs. They expect the ECB to lift the key rate twice this year, taking it to 4.5 percent, according to Eonia forward contracts.
.....
Oil prices above $130 a barrel and rising food prices pushed inflation in the 15-nation euro region to 3.6 percent in May, well above the ECB's 2 percent limit. Central banks around the world are changing rate policy in response to surging inflation.
Global Policy Shift
Vietnam, Brazil, Chile, the Philippines and Indonesia all lifted borrowing costs this month. The Bank of Canada yesterday unexpectedly kept its benchmark rate unchanged after four straight reductions. U.S. Federal Reserve Chairman Ben S. Bernanke has also signaled the Fed is done cutting rates, saying this week he'll ``strongly resist'' any surge in inflation expectations.
Tie this information to the CRB chart below, especially the following points.
1.) The weekly chart is still in a major rally.
2.) The daily chart is still bullishly aligned
3.) The P&F chart shows a series of multiple new highs.
These developments explain the following statement from Bernanke's most recent speech:
Inflation has remained high, largely reflecting sharp increases in the prices of globally traded commodities. Thus far, the pass-through of high raw materials costs to the prices of most other products and to domestic labor costs has been limited, in part because of softening domestic demand. However, the continuation of this pattern is not guaranteed and future developments in this regard will bear close attention. Moreover, the latest round of increases in energy prices has added to the upside risks to inflation and inflation expectations. The Federal Open Market Committee will strongly resist an erosion of longer-term inflation expectations, as an unanchoring of those expectations would be destabilizing for growth as well as for inflation.
NY Fed President Geithner echoed Bernanke's sentiment:
Geithner also said containing global inflation risks will probably require tighter monetary policy. The Fed has cut U.S. interest rates sharply to 2 percent since September, though markets expect it to raise them later this year.
And Treasury Secretary Paulson has supposed dollar intervention which is a de facto way to cure inflation caused by the dropping dollar:
U.S. Treasury Secretary Henry Paulson on Tuesday said he stood by comments made a day earlier in which he said he would never rule out currency intervention as a potential policy tool.
"I'll let my comments stand," Paulson said in an interview with Bloomberg Television. "I never like to say never, but my focus is on long-term fundamentals."
Now -- US officials have talked a good game for awhile, but haven't done anything. Let's see if they are will to act.
Tuesday, May 27, 2008
Are Beef Prices Headed Higher?
From Blomberg:
Agricultural/food price inflation has been a hot topic over the last few months. I've been concerned about the long-term spike in prices for about 6-9 months. This is just another symptom of the underlying problem: as the world's standard of loving increases (think India and China making more and more money) people will want better things like steak.
So, let's take a look at a few charts.

On the monthly corn chart, simply notice the huge price spike that's occurred.

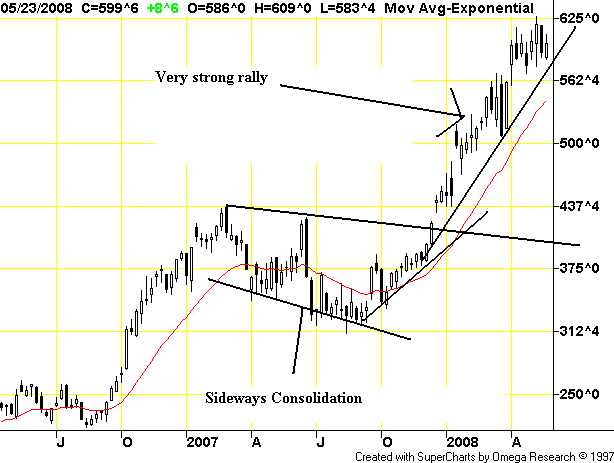
On the weekly chart, notice the following:
-- Prices rallied from the summer of 2006 to the beginning of 2007
-- Prices consolidated gains until the fourth quarter of 2007
-- Prices have been rallying strongly since the fourth quarter of 2007

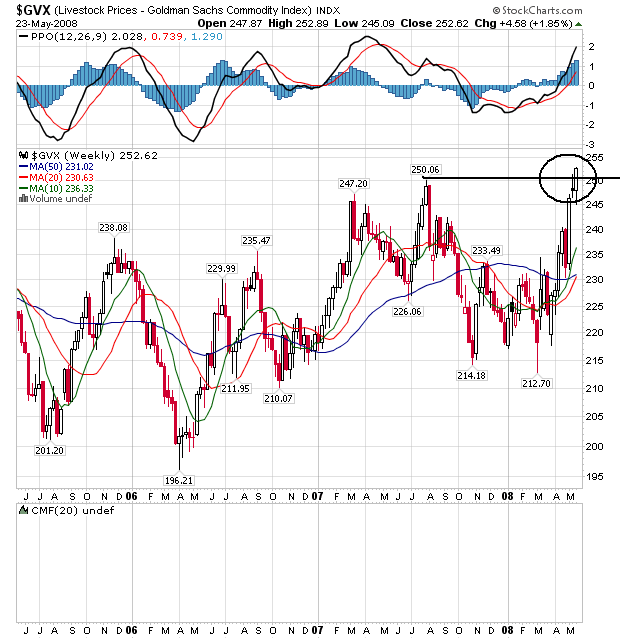
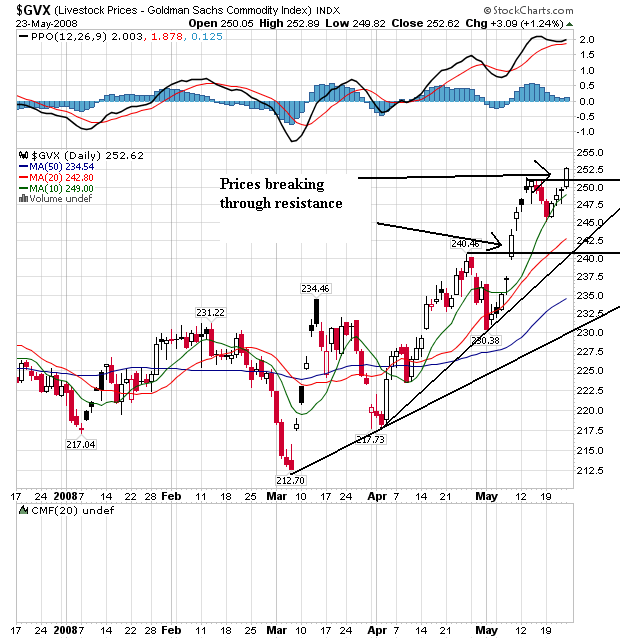
On the weekly livestock chart, notice that prices have been meandering for the better part of two years. But also note that prices have recently moved through a key area of resistance.

On the daily chart, notice that prices have been rallying since the beginning of March, with prices continually moving through key resistance levels. Also note that the shorter SMAs are higher than the longer SMAs, that all the SMAs are moving higher and that prices are higher than the SMAs. This is a bullish chart.
Enjoy your next steak, because prices from Shanghai to San Francisco are only going up.
The highest corn prices since at least the Civil War, based on Chicago Board of Trade data, mean U.S. feedlots are losing money on every animal they sell, discouraging production as rising global incomes increase meat consumption and a declining dollar spurs exports. Cattle may rise 13 percent by the end of the year on the Chicago Mercantile Exchange and Brazil's Bolsa de Mercadorias e Futuros, futures contracts show.
Not since 1996, when corn reached what was then a record $5 a bushel, have cattle been this cheap relative to their primary source of feed. Cattle are the seventh-worst performer of the 26-member UBS Bloomberg Constant Maturity Commodity Index in the past year, a time when soybeans, oil and copper jumped to records. After adjusting for inflation, cattle are down 27 percent from their 1988 peak.
``It's pretty certain that we'll see a decline in domestic supply in the U.S.,'' Joesley Batista, chief executive officer of JBS SA, the world's biggest beef producer, told reporters in Sao Paulo on May 15. ``As a result, we'll have price hikes and improved margins.''
Agricultural/food price inflation has been a hot topic over the last few months. I've been concerned about the long-term spike in prices for about 6-9 months. This is just another symptom of the underlying problem: as the world's standard of loving increases (think India and China making more and more money) people will want better things like steak.
So, let's take a look at a few charts.

On the monthly corn chart, simply notice the huge price spike that's occurred.

On the weekly chart, notice the following:
-- Prices rallied from the summer of 2006 to the beginning of 2007
-- Prices consolidated gains until the fourth quarter of 2007
-- Prices have been rallying strongly since the fourth quarter of 2007

On the weekly livestock chart, notice that prices have been meandering for the better part of two years. But also note that prices have recently moved through a key area of resistance.

On the daily chart, notice that prices have been rallying since the beginning of March, with prices continually moving through key resistance levels. Also note that the shorter SMAs are higher than the longer SMAs, that all the SMAs are moving higher and that prices are higher than the SMAs. This is a bullish chart.
Wednesday, May 7, 2008
Fed Governor Concerned About Inflation
From Marketwatch.com:
Let's take a look at some of the inflation measures to see how they're doing:

Although it has stabilized, PPI is still at high levels.

CPI has also stabilized, although at high levels as well.

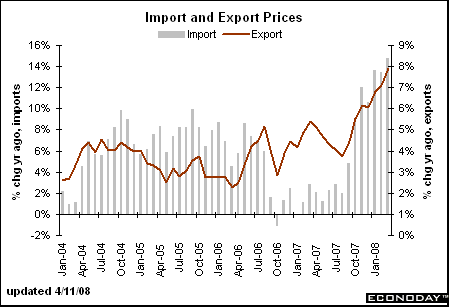
Import prices are spiking. So long as oil is in a rally, expect this trend to continue.

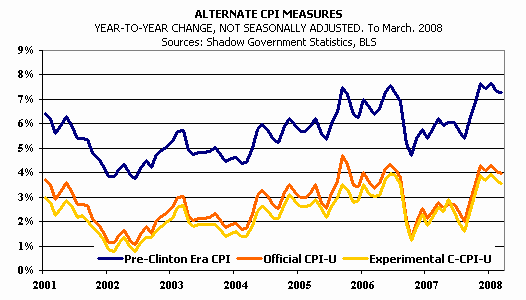
And now for the Shadow Stats alternate CPI measures, just to show you that yes, there is probably more inflation in the system than the Fed wants to admit.
So - who is right? I'm not a statistician so I can't speak to the validity or non-validity of any of these numbers. However, I can tell you there has been a tremendous amount of debate about the US CPI calculation which leads me to believe there is a problem somewhere. However, where it is and to what degree it is impacting the current situation I don't know.
I will add my own observations. I have noticed big food price increases over the last few years. Nothing concrete -- no "prices have increased by x%" -- but I know my food bill is going up and my eating habits have not changed. FWIW.
The latest comments form Federal Reserve Bank of Kansas City President Thomas Hoenig also will be scrutinized, as he said late Tuesday that rising inflationary pressures are "troublesome" and a "serious" matter, and now stand at "unacceptably high levels." Hoenig isn't a voting member of the FOMC.
Let's take a look at some of the inflation measures to see how they're doing:

Although it has stabilized, PPI is still at high levels.

CPI has also stabilized, although at high levels as well.

Import prices are spiking. So long as oil is in a rally, expect this trend to continue.

And now for the Shadow Stats alternate CPI measures, just to show you that yes, there is probably more inflation in the system than the Fed wants to admit.
So - who is right? I'm not a statistician so I can't speak to the validity or non-validity of any of these numbers. However, I can tell you there has been a tremendous amount of debate about the US CPI calculation which leads me to believe there is a problem somewhere. However, where it is and to what degree it is impacting the current situation I don't know.
I will add my own observations. I have noticed big food price increases over the last few years. Nothing concrete -- no "prices have increased by x%" -- but I know my food bill is going up and my eating habits have not changed. FWIW.
Thursday, April 24, 2008
Rice Price Spikes Leading to Hoarding and Other Fun Problems
From the WSJ's Marketebeat Blog:
When was the last time you heard of a food product not being available in he US? Anyone? I don't think it's ever happened in my lifetime for the reasons outlined above.
From CNBC:
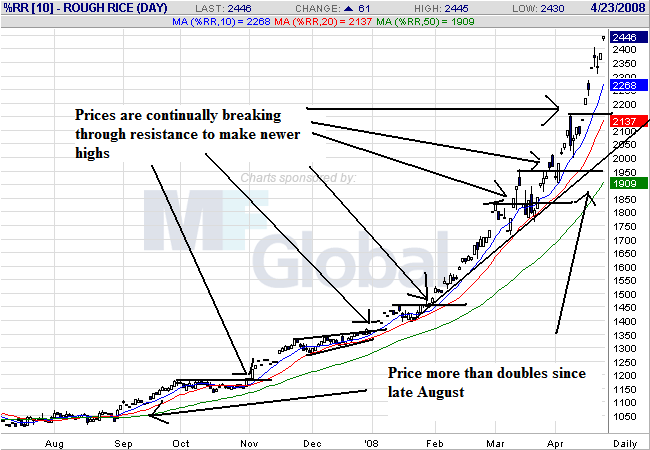
Here's the problem. To bring the price down, what the world needs is a massive increase in supply to literally flood the market. However, we're dealing with food -- a basic human necessity. Governments will always do what Brazil is doing -- cutting exports -- in order to protect their citizens from starvation. While that is politically an astute move, economically it's the worst move possible because it limits an already dwindling supply. It leads to charts that look like this:

Notice the following:
-- Prices have continually broken through resistance to make new highs
-- All of the SMAs are moving higher
-- The shorter SMAs are higher than the longer SMAs
-- Prices have continually used the SMAs as support levels for the rally.
Bottom line -- this is a bullish chart that will bring more traders into the market.
Oh yeah -- this won't help the inflationary picture at all.
Food-related protests have been occurring worldwide, and in the U.S. now major discounters are seeing runs on products, particularly rice, as both Sam’s Club, the Wal-Mart Stores Inc. operated discounter, and Costco Wholesale Corp. have seen shelves cleaned out of rice as consumers worry about higher prices. “It is just unreal what can happen when we get fear being spread as it is now, and when the general populace goes out and starts doing idiotic things like lining up at the Sam’s Club and the Costco and not buying one bag but buying 10 bags just because they might run out,” says Neauman Coleman, introducing broker at Neauman Coleman & Co. in Brinkley, Ark. Sam’s Club has decided to put limits (or rations, if you will) on the amount of 20-pound bags customers can purchase every week, and Costco earlier this week said it was considering such limits as well, which in a way is just as panicky a response.
When was the last time you heard of a food product not being available in he US? Anyone? I don't think it's ever happened in my lifetime for the reasons outlined above.
From CNBC:
Benchmark Thai rice prices leapt more than 5% to a record high above $1,000 a ton Thursday. Meanwhile, Brazil has temporarily halted rice exports to ensure domestic supply amid rising world prices for the grain.
Brazil grows more rice than it consumes and has a reserve that will safeguard the country's supply, Agriculture Minister Reinhold Stephanes said in a statement. Sales abroad will nevertheless be blocked to make sure the country has enough of the grain for the next six to eight months.
.....
Brazil follows on the steps of India and Vietnam, the world's second- and third-largest rice exporters in 2007, in imposing export curbs of rice in a bid to keep prices of the grain under control. Brazil, which is not a major global rice supplier, exported 313,000 tons of rice last year.
Here's the problem. To bring the price down, what the world needs is a massive increase in supply to literally flood the market. However, we're dealing with food -- a basic human necessity. Governments will always do what Brazil is doing -- cutting exports -- in order to protect their citizens from starvation. While that is politically an astute move, economically it's the worst move possible because it limits an already dwindling supply. It leads to charts that look like this:

Notice the following:
-- Prices have continually broken through resistance to make new highs
-- All of the SMAs are moving higher
-- The shorter SMAs are higher than the longer SMAs
-- Prices have continually used the SMAs as support levels for the rally.
Bottom line -- this is a bullish chart that will bring more traders into the market.
Oh yeah -- this won't help the inflationary picture at all.
Tuesday, April 22, 2008
US Gasoline Consumption Down
From the Kansas City Star:
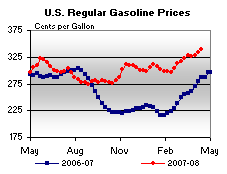
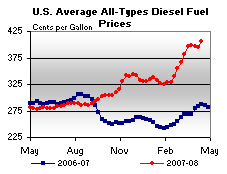
Here are two charts from This Week in Petroleum to show where retail prices are:


Notice that instead of falling in the winter, both gas and diesel prices remained at high levels. I think this is an important contributing factor to the slowdown that occurred in the fourth quarter.
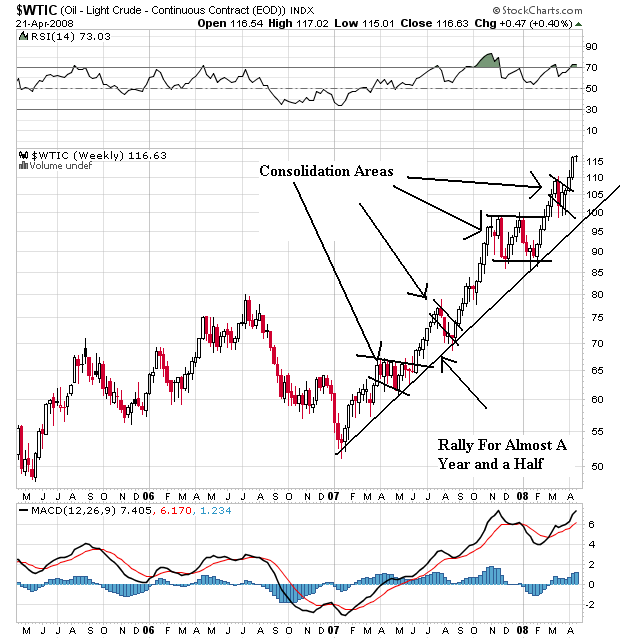
Also consider the following graph of oil prices:

Oil has been in a rally for almost a year and a half. Notice the market has continually advanced through previous resistance levels, consolidated gains and then moved higher.
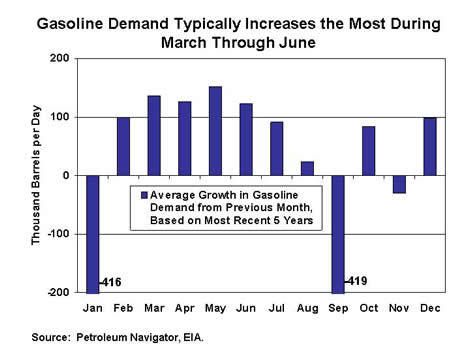
However, we're moving into the summer driving season when demand typically increases:

Finally, I have two words: India and China. Simply put, US demand is no longer the only driving force of the oil market. There are now over 2 billion more people who've seen their standard of living increase.
U.S. drivers are doing something they haven’t done for nearly two decades — consume less gasoline.
Gas consumption so far this year is down about 0.2 percent compared to last year, according to the Energy Information Administration. The federal agency is predicting that gasoline demand will be down 0.4 percent this summer and 0.3 percent for the year.
That may not sound like much, but it would be the first time since 1991 that there’s been a decline in annual gas consumption. And it would be only the eighth year since 1951 in which demand for gasoline has declined.
The federal agency noted that the decline was occurring in part because of a slowing economy. But it also said that higher gas prices were having an effect on demand.
“Sustained higher gasoline prices are beginning to show up in lower gasoline consumption,” said Tancred Lidderdale, an analyst for the Energy Information Administration.
Both gasoline and diesel prices are now at record levels.
Here are two charts from This Week in Petroleum to show where retail prices are:


Notice that instead of falling in the winter, both gas and diesel prices remained at high levels. I think this is an important contributing factor to the slowdown that occurred in the fourth quarter.
Also consider the following graph of oil prices:

Oil has been in a rally for almost a year and a half. Notice the market has continually advanced through previous resistance levels, consolidated gains and then moved higher.
However, we're moving into the summer driving season when demand typically increases:
Since last fall, the average U.S. retail price for regular gasoline has been close to or above $3 per gallon in large part due to high crude oil prices. High crude oil prices are expected to remain an important reason why retail gasoline prices are projected to stay above $3 per gallon for some time to come. As the chart below indicates, we are now in the “time of the season” when gasoline demand begins to increase. As seasonal demand increases, prices tend to rise as well, all else equal. Even though U.S. gasoline demand has been lower than year-ago levels so far this year, EIA still expects that rising gasoline demand over the next few months will drive retail prices higher. So, while gasoline prices have risen above $3 per gallon mostly due to high crude oil prices, increasing gasoline demand will likely take retail gasoline prices to $3.50 per gallon and above, even if year-over-year gasoline demand is negative. The simple fact that more and more gasoline will be used over the next few months will probably be enough to cause retail gasoline prices to increase, even if crude oil prices begin declining, as EIA is currently projecting. Additionally, the cost of making “summer-grade” gasoline (“summer-grade” gasoline produces less smog) is significantly more than making “winter-grade” gasoline, helping to raise retail prices even further during the summer months, all else equal.

Finally, I have two words: India and China. Simply put, US demand is no longer the only driving force of the oil market. There are now over 2 billion more people who've seen their standard of living increase.
Monday, April 21, 2008
Oil Still Rallying
From the AP

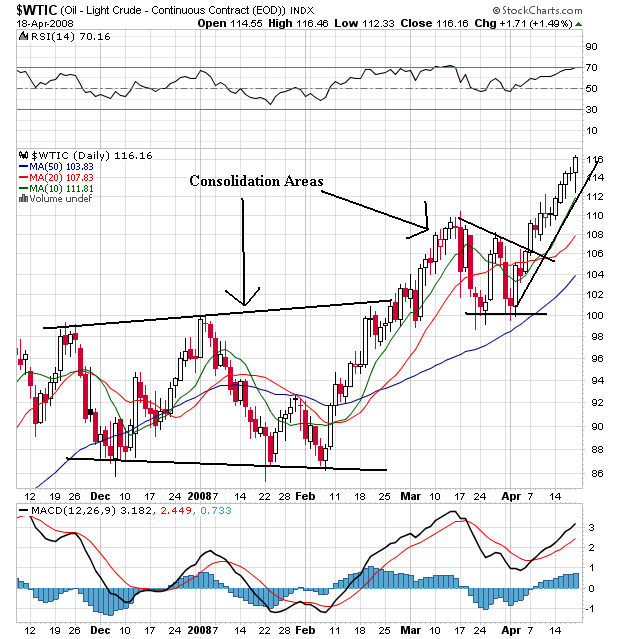
On the daily chart, notice the following:
-- All the SMAs are moving higher
-- The shorter SMAs are above the longer SMAs
-- Prices are above all the SMAs
-- Prices have rallied and consolidated which is a very health bull market formation

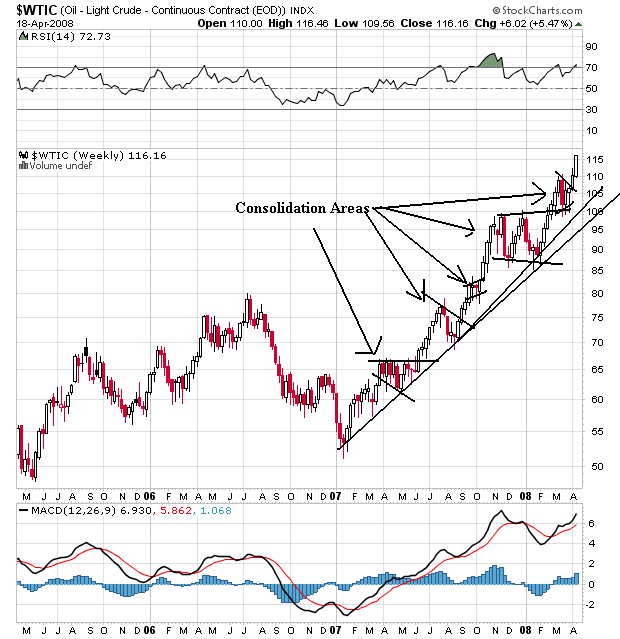
On the weekly chart, notice we've had an incredibly strong rally. Prices have been rising for the last year. As they have risen they have consolidated their gains which allows some traders to take profits and others to get in. This is a bull market chart.
Oil prices spiked to a record $117.40 a barrel after a Japanese oil tanker was hit by a rocket near Yemen and militants in Nigeria claimed two attacks on pipelines.
The 150,000-ton tanker Takayama was attacked about 270 miles off the east coast Yemen coast in the Gulf of Aden while it was heading for Saudi Arabia, its Japanese operator, Nippon Yusen K.K., said in a statement.
None of the ship's 23 crew members was injured. Hundreds of gallons of fuel leaked before a 1-inch hole in the tanker's stern was repaired, the company said.
Kyodo News agency reported that the Japanese tanker was fired on by a rocket launcher from a small boat.
Light, sweet crude for May delivery reached $117.40 a barrel but fell back to $116.88 by midday in Europe, up 19 cents from Friday's closing price.

On the daily chart, notice the following:
-- All the SMAs are moving higher
-- The shorter SMAs are above the longer SMAs
-- Prices are above all the SMAs
-- Prices have rallied and consolidated which is a very health bull market formation

On the weekly chart, notice we've had an incredibly strong rally. Prices have been rising for the last year. As they have risen they have consolidated their gains which allows some traders to take profits and others to get in. This is a bull market chart.
Friday, April 18, 2008
What Inflation?
From the WSJ:
Let's look at the chart to see what's going on.

The above chart shows a strong rally. Notice the following:
-- Prices have almost double since last September
-- All the SMAs are moving higher
-- Prices are above the SMAs
-- The shorter SMAs are above the longer SMAs
-- There is a strong uptrend in place

However, the multi-year chart shows the natural gas market is especially prone to price spikes. So, that's what we could be dealing with here.
Americans feeling the pain of record gasoline prices now face the likelihood of another fuel shock, from natural gas.
Prices in the U.S. have risen 93% since late August as power-hungry nations like South Korea and Japan compete in a global natural-gas market that scarcely existed a half-decade ago. Still, U.S. prices are as low as half the level of some overseas markets, suggesting they have much further to rise.
The global appetite for natural gas has profound implications for a U.S. economy already tipping toward recession and struggling against inflation pressures. The fuel heats half of U.S. homes, generates 20% of the country's electricity and is used to make everything from fertilizer to plastic bags. In March, rising natural-gas prices contributed to a higher than expected 1.1% increase in producer prices, according to the Labor Department.
U.S. natural-gas output has actually been rising in recent months, and not everyone agrees that prices are destined to surge. However, a significant number of financial players are now betting on an increase.
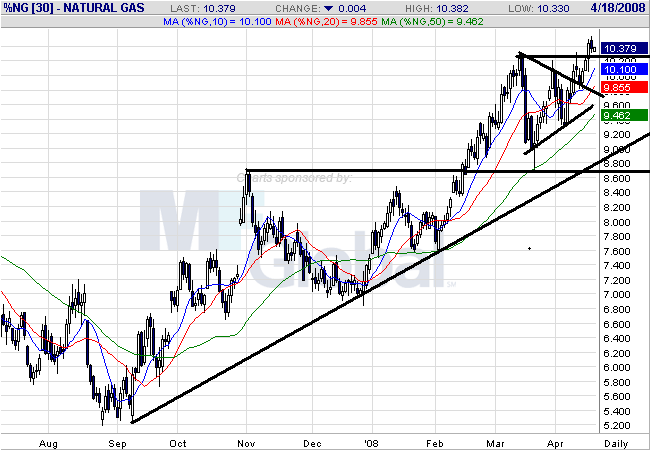
Let's look at the chart to see what's going on.

The above chart shows a strong rally. Notice the following:
-- Prices have almost double since last September
-- All the SMAs are moving higher
-- Prices are above the SMAs
-- The shorter SMAs are above the longer SMAs
-- There is a strong uptrend in place

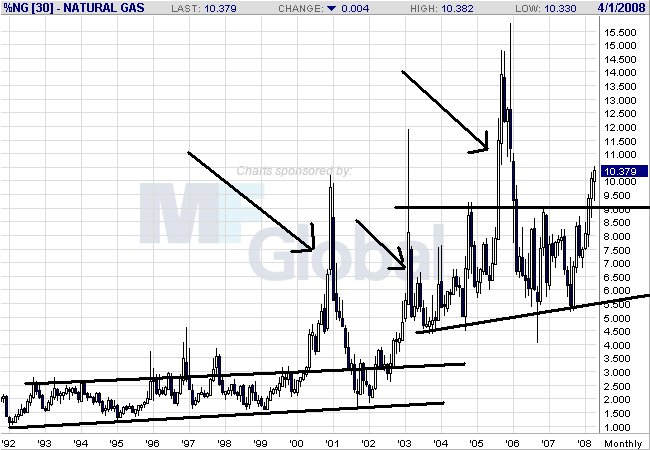
However, the multi-year chart shows the natural gas market is especially prone to price spikes. So, that's what we could be dealing with here.
Wednesday, April 16, 2008
What Inflation?
From Bloomberg:
First, notice that at least we're not the only country that is dealing with spiking inflation.
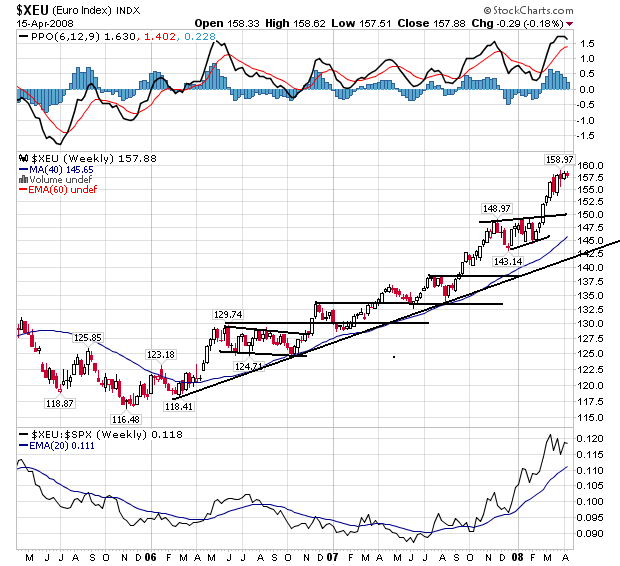
Secondly, notice the European Response -- not raising rates. The reason is the European Central Bank (ECB) is less concerned with preventing a recession. Instead, they view their mandate as inflation fighters or as promoters of price stability as extremely important. As a result, the euro is rallying:
On the chart, notice the following:
-- Prices have been rallying since 2006
-- Prices have continually moved through previous levels of resistance to hit new levels.
-- After hitting new levels prices consolidate, shaking out some players who take profits and inviting new players in to take new positions.
From Bloomberg:
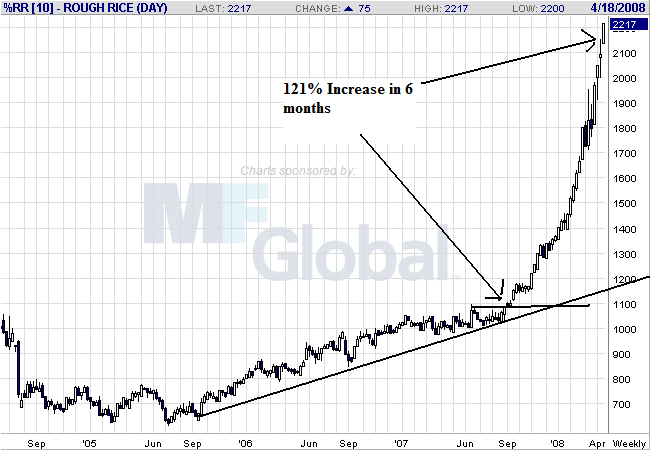
Here's a chart:

Notice the extreme price spike in rice's price. This is an unsustainable move up in the long run -- meaning prices are really over-extended. But the problem is there is panic buying going on which will really spike prices hard in the short run. As a result, don't be surprised to see rice continue to move higher.
But it's not just rice:
Here is a chart of corn:

Notice prices are in a solid uptrend; they have moved through previously established resistance to establish new highs and then have sold-off to previously established upward sloping trend lines. This is a bullish chart.

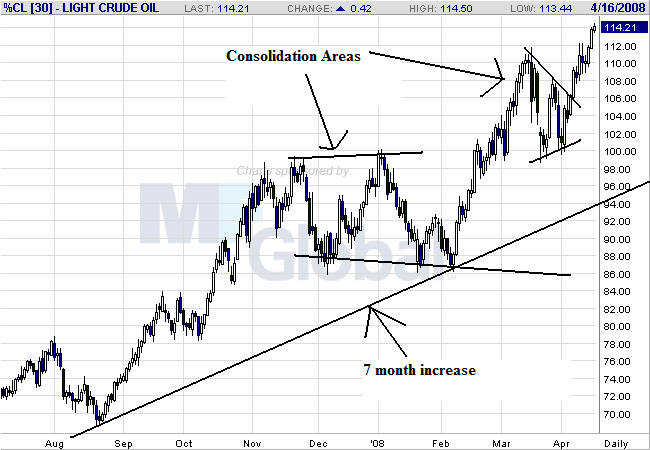
Notice that oil has the same pattern as corn; prices have continued to rise, consolidate gains and then continue to move higher. Oil has a clear support level as well.
European inflation accelerated more than initially estimated in March, reinforcing the European Central Bank's resistance to cutting interest rates even as economic growth cools.
The inflation rate rose to 3.6 percent last month, the highest in almost 16 years, the European Union's statistics office in Luxembourg said today. The March figure is up from 3.3 percent in February and exceeds an estimate of 3.5 percent published on March 31.
Food and energy prices stoked inflation in March, and the euro extended its gains after the report, rising to a record against the dollar. ECB Executive Board member Juergen Stark yesterday said interest rates may not be high enough to contain inflation, while Greek colleague Nicholas Garganas said price pressure ``is more intense than previously foreseen.''
``Concerns about upside risks to the inflation outlook are unlikely to ease quickly, leaving little, if any, scope for the ECB soften its interest-rate stance,'' said Martin van Vliet, an economist at ING Group in Amsterdam. ``This may help push the euro-dollar to $1.60 in the short term.''
....
Food-price inflation accelerated to 6.2 percent in March from 5.8 percent in February, the highest since Eurostat began the current series in 1997. Rice climbed to a record $22.67 per 100 pounds today on rising demand and as floods delayed planting in the U.S. Wheat, corn and soybeans also have risen to records.
Energy-price inflation accelerated to 11.2 percent from 10.4 percent, the highest since May 2006. Crude oil has risen 79 percent in the last 12 months and reached a record above $114 a barrel yesterday.
First, notice that at least we're not the only country that is dealing with spiking inflation.
Secondly, notice the European Response -- not raising rates. The reason is the European Central Bank (ECB) is less concerned with preventing a recession. Instead, they view their mandate as inflation fighters or as promoters of price stability as extremely important. As a result, the euro is rallying:

On the chart, notice the following:
-- Prices have been rallying since 2006
-- Prices have continually moved through previous levels of resistance to hit new levels.
-- After hitting new levels prices consolidate, shaking out some players who take profits and inviting new players in to take new positions.
From Bloomberg:
Rice climbed to a record for a second day as the Philippines, the world's biggest importer, sought 1 million metric tons and floods delayed planting in the U.S., increasing concern of a global shortage.
The Philippines will hold a tender tomorrow for 500,000 tons of rice, with another to follow on May 5. A March tender filled just 61 percent of requirements at prices double those six months earlier. Last year, the country imported 1.9 million tons of rice, equivalent to about 15 percent of annual needs. Food lines have formed as people wait for rice.
Rice in Chicago surged 2.3 percent today to $22.67 per 100 pounds on rising demand and export curbs from some producing nations, stoking global concern about inflation and the potential for social unrest. Rice, the staple food for half the world, has more than doubled in a year. Wheat has gained 93 percent in that time, while corn is up 61 percent.
``We've seen an unprecedented bull run in rice prices,'' Luke Chandler, senior commodities analyst at Rabobank Group, said in an interview today with Bloomberg Television. ``It's almost becoming like a supply shock because the countries that rely on the imports aren't able to access the available sources.''
Here's a chart:

Notice the extreme price spike in rice's price. This is an unsustainable move up in the long run -- meaning prices are really over-extended. But the problem is there is panic buying going on which will really spike prices hard in the short run. As a result, don't be surprised to see rice continue to move higher.
But it's not just rice:
U.S. rice, corn and crude futures soared to record highs Tuesday on supply concerns, in turn boosting gold on inflation worries.
On the New York Mercantile Exchange, the front-month crude settled up $2.03, or 1.82%, at $113.79 on a combination of supply issues, rising diesel demand in China and persistent dollar weakness. Crude futures later rose to a record high of $114.08 after settlement.
Rice and corn futures rocketed to all-time highs on tight world grain supplies and planting delays, with the rally in crude providing an additional boost to grains.
Chicago Board of Trade rice prices have doubled since last September, with Asian prices soaring even more sharply since January as big importers have rushed to build stocks on fears that supplies will become scarce as exporters clamp down on shipments.
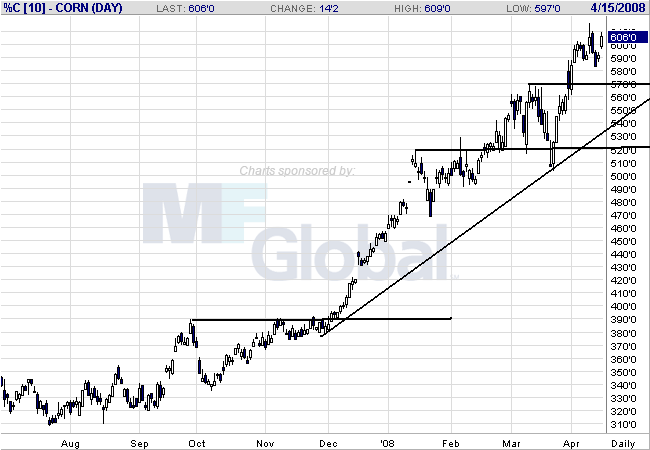
Here is a chart of corn:

Notice prices are in a solid uptrend; they have moved through previously established resistance to establish new highs and then have sold-off to previously established upward sloping trend lines. This is a bullish chart.

Notice that oil has the same pattern as corn; prices have continued to rise, consolidate gains and then continue to move higher. Oil has a clear support level as well.
Subscribe to:
Posts (Atom)