Saturday, September 17, 2022

Weekly Indicators for September 12 - 16 at Seeking Alpha


 - by New Deal democrat

My Weekly Indicators post is up at Seeking Alpha.

Gas prices have continued to decline, with almost the entire Ukraine war spike gone. Meanwhile Tuesday’s core CPI reading sent the bond market into a tizzy, with interest rates going back up to their highs.

The decline in gas prices is good news for the immediate short term. But the increase in interest rates just adds to the evidence that a 2023 recession is likely.

Suddenly there are a lot of things for me to write about; including not just if there will be a recession, but also how deep and how long it might be. The longer the Fed goes on raising rates, the more I think it may turn into a bad, deep recession.

As usual, clicking over and reading will bring you up to date, and bring me a little compensation for my efforts.

Friday, September 16, 2022

Real aggregate payrolls and recessions


 - by New Deal democrat

One of my favorite indicators for the overall economic health of the American working and middle classes is real aggregate payrolls for non-supervisory workers. This is kind of self-explanatory; rather than measure hourly wages, this is the *total* amount of wages paid to non-supervisory workers, adjusted for inflation. It tends not to be noisy, i.e., there is a lot of signal compared with noise. And its growth, or lack thereof, is a good short leading indicator for recessions. Since I didn’t update this earlier in the week when inflation was reported, let’s take a look at it now.


Here is the long term view for the past 55+ years:


During that time period, real aggregate payrolls for non-supervisory workers tends to sharply slow down, and even roll over, 6-12 months before the onset of recessions, with the possible exception of the 2020 pandemic.

Here is the close-up view of the last 18 months:


The sharp slowdown began in September 2021, 12 months ago.

Looking at the YoY% change in the data gives us further insight:


With the sole exception of one month in 1992, and the 2002-03 “jobless recovery,” real aggregate payrolls have been declining, and been negative YoY *only* during recessions, and *always* during each recession, although they may not turn negative until several months into the recession. In short, they are an excellent coincident marker for recessions.

Here is the close-up view since May 2021:


Real aggregate payrolls have shown decelerating growth at the rate of -0.3%/month during that time. *If* that rate were to continue, they would be negative by the beginning of next year, almost certainly signifying recession.

Finally, let’s compare real aggregate payrolls with another of my favorite markers of consumer health, real retail sales. Below I’ve split the series into 2 periods so that the trends are easier to see:


Real retail sales have either shortly led or else been coincident with real aggregate payrolls for over the past half century, but are somewhat more volatile, with more false positive recession signals (see, e.g., 1966).

Here is the comparison for the past 15 months:


Real retail sales turned slightly negative YoY this spring, before recovering slightly.

In summary, although the decline in gas prices in the past 3 months has been very helpful, the consumer remains in a really dicey situation. Any further deterioration is likely to signal either that a recession is nearly imminent, or that one has already begun.

Thursday, September 15, 2022

August industrial production declines; overall decelerating trend consistent with recession in 2023


 - by New Deal democrat

Finishing today’s data dump, industrial production, the King of Coincident Indicators, declined -0.2% in August, while manufacturing production increased 0.1%. July’s sharp gains in both were revised slightly (-0.1%) downward: 


While July remains the high water mark for overall production, manufacturing has not made a new high since April.

What I see is a decelerating trend which will probably continue to worsen as the Fed raises rates. This adds to the evidence that a recession is likely next year.

Positive real retail sales in August, but YoY flatness continues


 - by New Deal democrat

Retail sales, probably my favorite monthly economic datapoint, increased 0.3% in August. Since consumer prices rose 0.1%, real retail sales rose 0.2%:


That’s certainly good news. Now here’s the bad news: July’s retail sales were revised downward by -0.4%, so that real retail sales, reported last month as +0.1%, are now shown down by a little less than -0.4%. 

Thus as shown above real retail sales are still -1.1% below their April peak.

Ex-autos, retail sales were down -0.3%, and unchanged ex-autos and ex-gas, reversing July’s initially reported gains - which in the case of autos were revised down sharply to -0.4%.

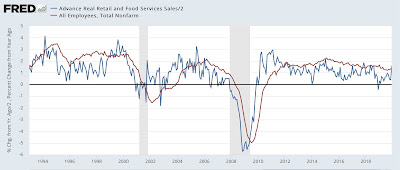
As I note almost every month, real retail sales (/2) are a good short leading indicator for employment. Here’s the long term view from 1993-2019:


While real retail sales were down YoY for several months, this month they are up 0.8% YoY, the second positive yearly comparison in a row. Here is the updated above comparison with payrolls since June 2021:


Retail sales continue to forecast a deceleration in monthly payroll gains. Here’s the monthly % change in payrolls for the past year:


Last autumn’s Booming payroll gains are a thing of the past. Payrolls gains averaging 0.2% (about 300,000) or less are what we should expect for the rest of this year. 

Improvement in initial jobless claims continues


 - by New Deal democrat

Initial jobless claims continued their reversal from had been in an almost relentless uptrend from spring through early August.

This week initial claims declined another -5,000 to 213,000, and the 4 week average declined another -8,000 to 224,000. Continuing claims, which lag somewhat, increased 2,000 from a heavily revised 1,401,000 the previous week  (it had been initially reported at 1,473,000):


As I wrote last week, continued claims lag initial claims. I expected them to reverse lower, and they have, from a revised high of 1,437,000 on August 20.

I put this down to a positive effect of lower gas prices, which I also expect to positively influence consumer confidence and also Biden’s approval ratings.

The long term outlook in next year remains negative; but I only expect this to reassert itself once the effects of lower gas prices are fully reflected in the coincident and short term data.


Wednesday, September 14, 2022

PPI, without the lagging phantom of Owners Equivalent Rent, declines in August, decelerates YoY


 - by New Deal democrat

What a difference it makes that PPI does not have a concept like “owners equivalent rent!”


Overall PPI declined by -0.1%, following a -0.4% reading in July, together the two lowest readings since the pandemic lockdown months:


Core PPI increased by 0.5% (blue in the graph below), which while historically high, was the lowest reading in 16 months, excluding last August, in contrast to the continued elevation in core CPI (gold):


Notice that core PPI has been decelerating since April.

PPI’s primary housing component is residential construction materials. Here are the absolute values in both flavors of that reading:


Note that both have declined in the last few months, with construction materials essentially flat all year. Here is what the YoY% changes in each look like:


Both are still very elevated, but at least construction materials are down from the stratosphere to within the range of high readings in the prior 20 years.

Now let’s compare owners equivalent rent (black) with the Case Shiller housing index (blue) and PPI for residential construction materials (red):


While there is no close historical relationship between the cost of construction materials and the house price index, since the pandemic they have moved in tandem, with both rising sharply and then plateauing almost simultaneously. Since the house price indexes have only been reported through June, we don’t know yet whether they will follow the sharp YoY deceleration already apparent in construction material costs (but I strongly suspect they will).

In other words, there is every reason to believe that both core and overall PPI will continue to slow, even as owners equivalent rent pulls core CPI skyward.

Unfortunately, the lagging phantom of OER will almost certainly cause the Fed to keep stomping on the brakes.

Tuesday, September 13, 2022

August CPI: sharp gains in housing and new cars offset declines in used cars and gas


 - by New Deal democrat

Following up on yesterday’s post, let’s cut to the chase:


Total CPI +0.1%
Energy -5.0%
Used vehicles -0.1%
New vehicles +0.8%
Owners’ equivalent rent +0.7% (biggest monthly gain since 1990)

YoY inflation declined to +8.3% from its recent +9.0% peak:


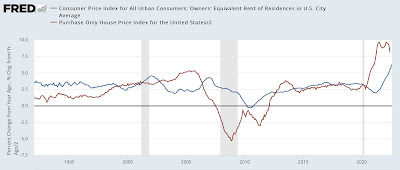
The 0.7% increase in owner’s equivalent rent was the biggest monthly gain since 1990. YoY OER increased to 6.3%, the highest since the series started in 1984, with the exception of two months in 1986. Here it is YoY in comparison with the FHFA house price index (/2 for scale) since the latter series started in 1993:


OER lags house prices by 12-18 months. House price appreciation peaked in June 2021, so we should be approaching the peak in OER as well, but if it rises proportionately to house prices as it did in the 2000s housing bubble, it could continue to rise to 7.5% or 8% before declining. And since OER plus rents (which also rose 0.7% for the month) is 40% of core inflation, it would take an absolute decline in everything else in the core measure just to get it down under a 0.4% increase per month (vs. 0.6% in August).

And new vehicle prices didn’t help at all. While their YoY increases are down from their peak, they are still up 10.4% YoY. Used vehicle prices are up 7.8% YoY, and have stopped decelerating in the past several months:


The one silver lining here is that used vehicle prices have not risen at all since last December (although that’s at a level that is 50% higher than when the pandemic hit):


As anticipated, energy prices declined even more in August than in July. YoY energy is up 23.9% (but well below its peak earlier this year):


Energy prices are still up 9.4% since February, just before the Ukraine invasion:


In essence, inflation at this point is primarily a function of the fictitious and lagging measure of housing that is used by the Census Bureau (keeping in mind that the house price indexes are still up over 15% YoY, although they may be shown to have peaked during the summer), plus the shortage of computer chips for manufacturing vehicles.

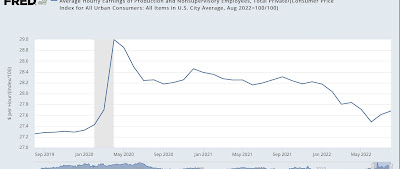
Let’s finally update real wages. These rose 0.2% in August. But that has done little to offset their decline since late 2021. YoY they have declined -2.2%:


To emphasize again, this loss is mainly about housing, plus supply issues for new cars, and the now-resolving Ukraine invasion spike in gas prices.

I will voice an opinion that I believe is well out of the mainstream at this point: so long as mortgage rates stay at 5% or higher, there is no reason for the Fed to raise rates further. It is chasing a horse that is 3 counties away from the barn, and has stopped running.

Monday, September 12, 2022

Previewing CPI


 - by New Deal democrat

No economic news today. Tomorrow the August CPI will be reported. Recall that in July there was no inflation whatsoever. In August last year prices increased 0.3%, so any number lower than that will lower YoY CPI from its July level of 8.5% (June’s 9.0% YoY inflation having been the peak).


The big bugaboos for consumer inflation have been housing, vehicles, and gas. So let’s take a look at each.

Yesterday, for the first time, Prof. Paul Krugman acknowledged something I’ve been pounding on for nearly a year:


I.e., the official measure of inflation, which drives Fed policy, lags the real world badly - by 12 to 18 months, by my best calculation.

Krugman made this observation by way of noting that monthly apartment rents, per Apartments.com, may be peaking:


The official CPI measurement of rents includes that for *all* apartments. But since leases typically last a year, the leading wedge of rents is for those apartments the leases for which renewed this month. 

The best measure I’ve found is from ApartmentList. Here’s their cumulative and YoY measure as reported by realtor.com:


Note by my rule of thumb, that measures peak roughly when their YoY rate of increase decelerated by 50%, rents have not quite peaked yet. 

A better view is their monthly % change measure:


Note that before the pandemic, the typical seasonal pattern was that the biggest increases were in the spring, with declines in the last 4 months of the year. Last month’s increase was significantly more than the August increases in 2018, 2019, and 2020.

For contrast, here are the FHFA and Case Shiller house price indexes measured YoY over the same period of time:


House prices started accelerating YoY well before apartment prices. Both apartment and house prices *may* have hit their YoY peaks simultaneously this past March. But there’s not enough of a history of the comparative data to make any further statements with confidence.

Because the CPI measures of rent lag, we will probably see continued significant increases tomorrow.

While there’s little information on new vehicles, Wolf Street had a good article on used car prices, using data from Mannheim auto auctions. Here’s his graph of prices paid:


Note the peak in prices was 7 months ago.

Here’s the YoY graph:


The YoY peak was 9 months ago.

Now here is CPI for used vehicles, both in absolute terms (blue) and YoY (red, right scale):


This measure of CPI seems to track Mannheim’s data fairly well. Since prices declined about 5% in August, per Mannheim, I am looking for a similar decline in used vehicle prices in tomorrow’s CPI.

Finally, here’s the monthly change in gas prices from the E.I.A. (blue), /16 for scale, and adding .15%, which has been the long term average of “core” cpi growth monthly, compared with total CPI:


Gas prices declined even more in August than they did in July.

So we will probably see continued upward pressure on CPI from shelter prices tomorrow, offset by a softening in used car prices, and a decline in energy prices. Add this up and it would not be surprising at all to see an actual *decline* in CPI for August, which needless to say would bring down YoY CPI growth to something like 8%. 

This, unfortunately, will not be enough to stop the Fed from another big rate hike later this month.