Saturday, March 22, 2014
Weekly Indicators for March 17 - 21 at XE.com
- by New Deal democrat
This week's edition is up at XE.com.
Appropriately for the week of the vernal equinox, the high frequency indicators sprung to life.
Friday, March 21, 2014
No Oil Premium For Ukraine Situation
Above is a chart for West Texas Intermediate Crude. It rallied a bit in the first part of the year, but prices broke support and are now trading right around the 200 day EMA. Notice the sell-off occurred during the heightened tensions in the Ukraine, indicating the oil market is not pricing in a "Ukraine" premium.
Thursday, March 20, 2014
Soft patch in production may be over, but beware outright losses in employment in coming months
- by New Deal democrat
I have a new post up at XE.com.
While the important February data all looks positive so far, the 1% decline in real retail sales caused in part by the cutoff of extended unemployment benefits is likely to feed through into employment in the next few months, and may include significant outright monthly declines.
Grains and Softs Break Out On Weekly Charts
Above are the weekly charts for grains (top chart) and softs (bottom chart). Both show clear downward trends for most of the past three years. However, starting in late January, both started to rally strongly, breaking downside resistance. The grains have moved through the 200 week EMA as have the softs, although the latter are consolidating recent gains.
The MACD indicates both of these ETFs have plenty of room to run this spring.
Wednesday, March 19, 2014
The loosening Oil choke collar, declining unemployment may give us a new high in real wages by year end
- by New Deal democrat
Not surprisingly, the loosening of the Oil choke collar appears to be having a number of virtuous side effects. The price of gas continues to be lower than it was in 2013, 2012, and even 2011 at this time.
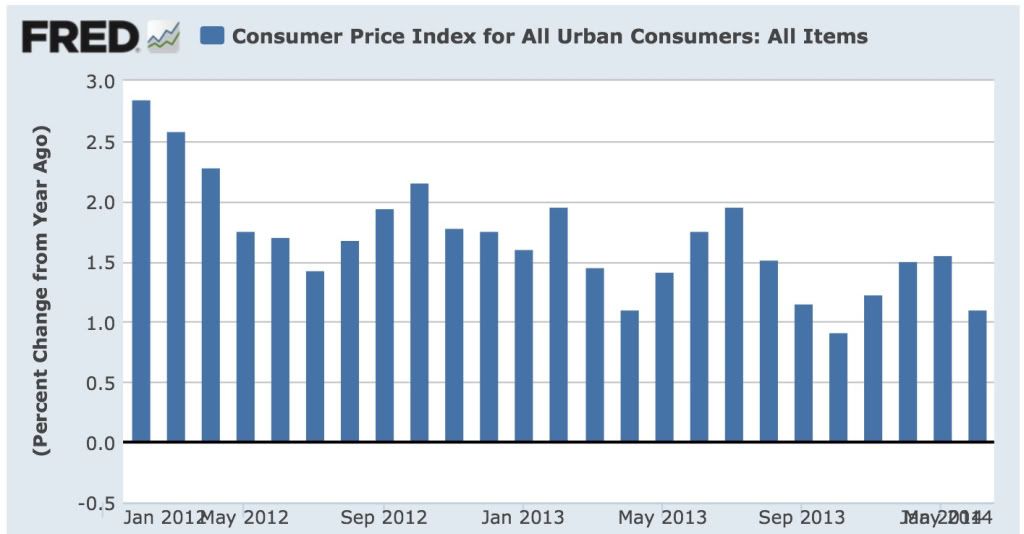
Since changes in the price of gasoline are almost entirely responsible for the month to month deviations from the "core" inflation rate of roughly 1.5% a year, the YoY slow decline in gas prices has caused YoY consumer inflation to decline from nearly 3% 2 years ago, to between 1% and 1.5% recently.
Here's the graph of YoY CPI siince January 2012 showing that decline:
And here is an overlay of gas prices (red), adjusted by 1.5% core inflation and scaled for easier comparison:
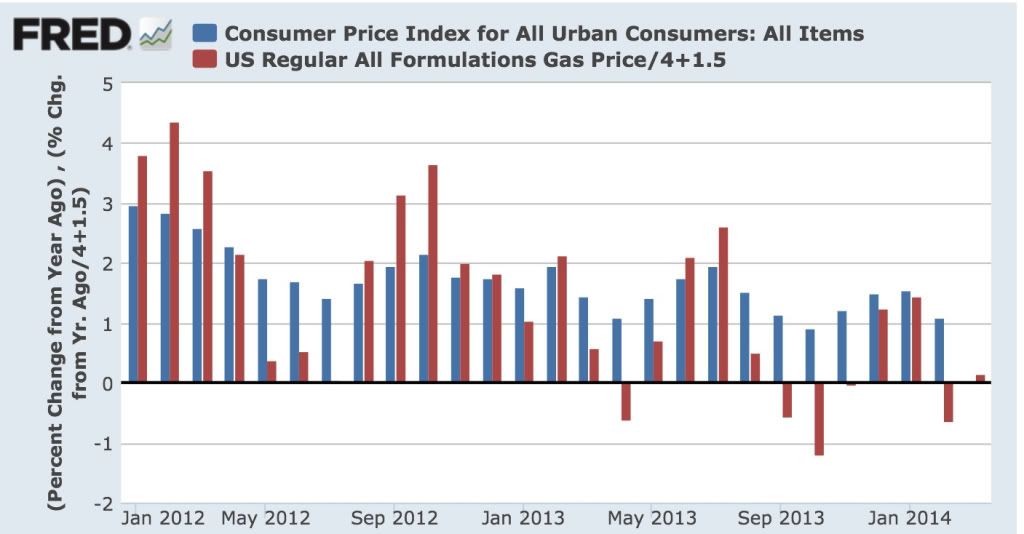
The correlation between the slow fade in gas prices and the deceleration in the CPI is obvious.
Now, let's take a look at the month over month percentage change in the nominal (i.e., not inflation adjusted) average wage of nonsupervisory workers over the last 2 years:
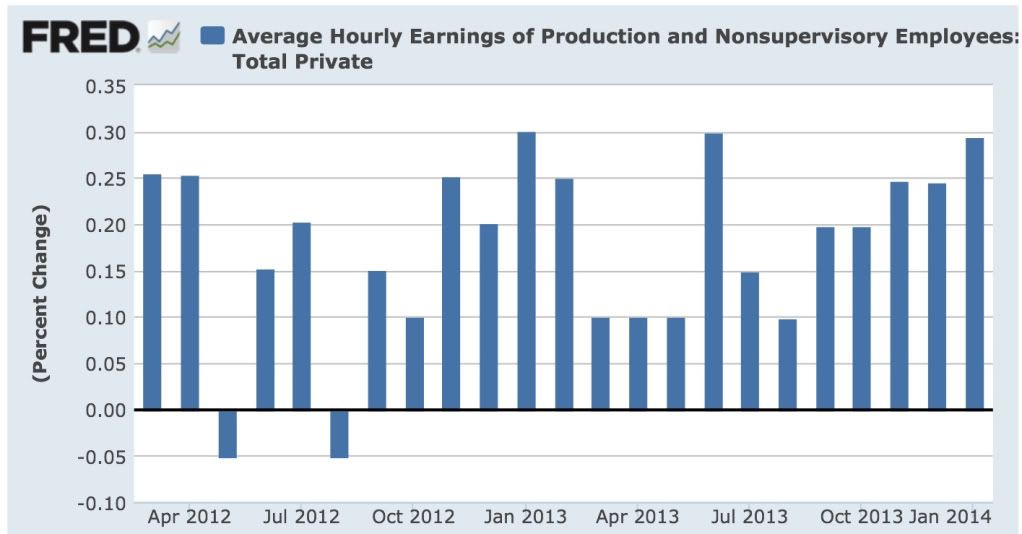
Over the last 5 months in particular, the monthly increase in average wages has signficantly picked up. This suggests that the decline in the U3 unemployment rate to nearly 6% is real, since there is evidence at last of some slight upward pressure on wages.
This upward pressure on wages (to a whopping 2.5%, still over .5% less than at its worst point before the last recession), is evident on this next graph, which shows the YoY% change of both the CPI and average nonsupervisory wages since October 2010:
![]()
Finally, as both a result of the deceleration in consumer inflation due to the loosening of the Oil choke collar and the recent acceleration in nominal nonsupervisory wages, here is average wages for nonsupervisory workers, normed to 100 at their peak in Octrober 2010:
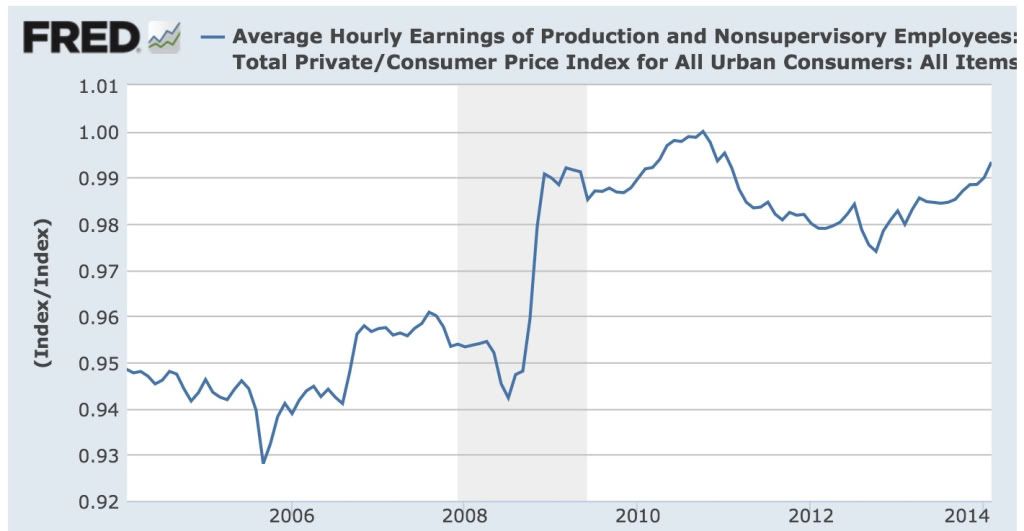
Since last summer there has been marked improvement in the trajectory of real wages. We are within 1% of the October 2010 peak, and if the current trend continues. we may finally set a new record high for real wages by the end of this year.
Maybe not worth 3 cheers, but 1 1/2 cheers at least.
Not surprisingly, the loosening of the Oil choke collar appears to be having a number of virtuous side effects. The price of gas continues to be lower than it was in 2013, 2012, and even 2011 at this time.
Since changes in the price of gasoline are almost entirely responsible for the month to month deviations from the "core" inflation rate of roughly 1.5% a year, the YoY slow decline in gas prices has caused YoY consumer inflation to decline from nearly 3% 2 years ago, to between 1% and 1.5% recently.
Here's the graph of YoY CPI siince January 2012 showing that decline:

And here is an overlay of gas prices (red), adjusted by 1.5% core inflation and scaled for easier comparison:

The correlation between the slow fade in gas prices and the deceleration in the CPI is obvious.
Now, let's take a look at the month over month percentage change in the nominal (i.e., not inflation adjusted) average wage of nonsupervisory workers over the last 2 years:

Over the last 5 months in particular, the monthly increase in average wages has signficantly picked up. This suggests that the decline in the U3 unemployment rate to nearly 6% is real, since there is evidence at last of some slight upward pressure on wages.
This upward pressure on wages (to a whopping 2.5%, still over .5% less than at its worst point before the last recession), is evident on this next graph, which shows the YoY% change of both the CPI and average nonsupervisory wages since October 2010:
Finally, as both a result of the deceleration in consumer inflation due to the loosening of the Oil choke collar and the recent acceleration in nominal nonsupervisory wages, here is average wages for nonsupervisory workers, normed to 100 at their peak in Octrober 2010:

Since last summer there has been marked improvement in the trajectory of real wages. We are within 1% of the October 2010 peak, and if the current trend continues. we may finally set a new record high for real wages by the end of this year.
Maybe not worth 3 cheers, but 1 1/2 cheers at least.
Industrial Metals ETFs Trading Near Yearly Lows
Above is a chart of the industrial metals ETF. Since midway through last summer, it has been trading in a descending triangle formation. Prices have not only hit resistance at the upper descending boundary, but also at the 200 day EMA, indicating the chart is remaining in a bear market. Prices broke through the downside in mid-March when Chinese export data dropped sharply.
Tuesday, March 18, 2014
Cattle ETF Rallying Strongly
Above is the weekly chart for cattle. The ETF was in a downtrend for two and a half years, continually printing lower lows and lower highs. However, prices broke through resistance in October of last year, fell back to trend, then moved higher in February of this year. Over the last 6 weeks, we've seen an incredibly strong rally, moving from 28.5 to 32.5. Several of the weekly bars are incredibly strong, indicating very strong demand.
Housing permits and starts for February: permits up, starts down -62,000 YoY
- by New Deal democrat
As you all know, based on 60 years of history, almost always when interest rates have moved up 1%, housing permits at some point soon thereafter have been -100,000 lower YoY.
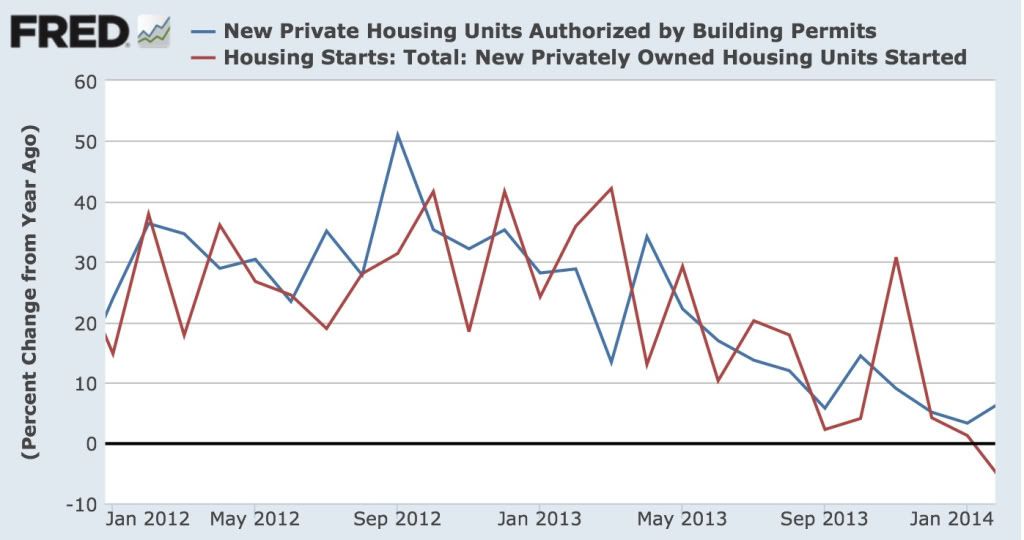
This morning permits rose 63,000 from January to 1.012 million, for a YoY 6.3% increase. Starts fell -2,000 to 907,000 from January, but are -62,000 less than they were a year ago, or -6.4% YoY. Here's the graph, starting from January 2012, of the YoY% changes in permits and starts:
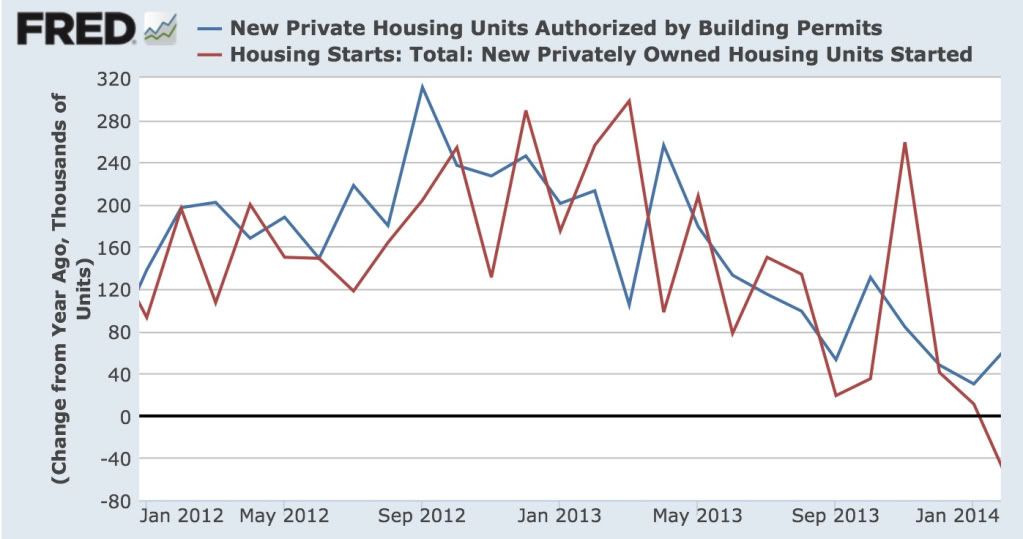
Here is the same information, represented by 100,000s of units:
Finally, here are both permits and starts, normed to 100 as of September 2012 (when the decelerating trend began):
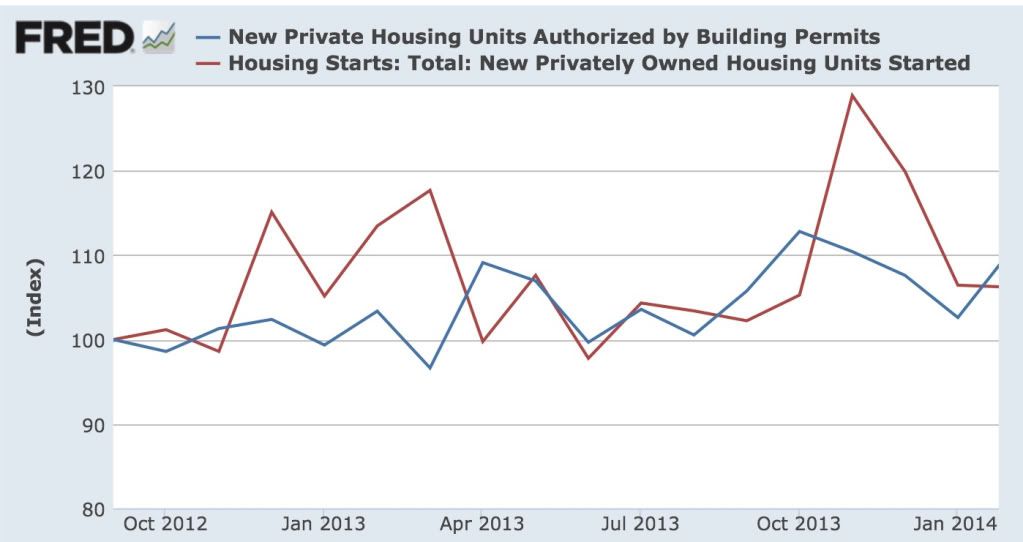
At first blush, it looks like the decelerating trend in housing has continued (granting that permits are at the top of their trend channel), and in the case of starts, we have had an outright YoY decline. While we haven't hit my -100,000 target, I wonder how many people thought there would be a -62,000 YoY decline a few months ago when I first made my forecast?
Monday, March 17, 2014
BRICs All In The Red
Above is a chart of the BRIC indexes and ETFs. All are in the red for the last year, some in a big way.
Russian ETF Tanks
Even before the Crimean situation, the Russian ETF was in trouble. After peaking at 29.47 in October of last year, the ETF has been continually moving lower. Price broke the 200 day ETF for the first time in December of last year and again in January 2014. As the situation in Eastern Europe has intensified, so has the strength of the downward move.
Sunday, March 16, 2014
The missing Malaysia airliner: an intriguing "hybrid" possibility
- by New Deal democrat
I just wanted to follow up my post yesterday, in which I indicated that once a mid-air explosion is ruled out, only 3 possibilities appear to be left.
There's been some interesting discussion today that opens up a "hybrid" of the three.
First of all, the abrupt changes in altitude have been suggested to indicate a struggle for control in the cockpit. Secondly, it has been suggested that an aborted 9/11 style attack against a city in India fits the evidence.
I don't buy that a pilot would go through all kinds of exquisite machinations just to let the plane go 5 hours on autopilot till it ran out of fuel as a means of committing suicide. But if, after the plane was intentionally diverted, some passengers and/or remaining crew struggled for control of the cockpit, as happened on flight 93 on 9/11, in the course of which the cockpit and passenger cabin were suddenly decompressed, then the flight might very well have continued on its most recent setting, a la the case of Payne Stewart, until it ran out of fuel.
If so, once the "black box" is found, then all we will hear over the 2 hours of tape is, literally, dead silence.
[P.S.: But I still hope the world's anti-terrorist agencies are preparing against the worst case scenario I laid out yesterday.]
A thought for Sunday: society is most vulnerable to those things of which it has no firsthand memory
- by New Deal democrat
A theme of several political and economic articles I have read in the past few days is the notion of an inflection point, where suddenly the paradigm shifts.
For example, Atif Mian and Amir Sufi wrote that there was a increase in household credit debt before the Great Depression, a discovery sufficiently profound that Mark Thoma included it in his daily links. Which is interesting, because I wrote all about the 1920s credit bubble over six years ago, explaining how changed social attitudes about credit led to an explosive increase in installment debt in the 1920s, whereby furniture and appliances were purchased on time, where even one missed payment would give rise to repossession. When the downturn of 1929 hit, households cut back on purchases en masse in order to protect their existing possessions -- which only created a vicious cycle.
Similarly, the New York Times today has an article applying game theory to the Crimea/Ukraine crisis, in which it is explained that
In a recent blog post, Jay Ulfelder, a political scientist, noted that for the last 25 years the world has seen less violent conflict than might have been expected, given local conditions. Lately, though, peaceful settlements have been harder to find. This change may just reflect random noise in the data, but a more disturbing alternative is that conflict is now more likely.Why? The point from game theory is this: The more peacefully that disputes are resolved, the more that peaceful resolution is expected. That expectation, in turn, makes peace easier to achieve and maintain. But the reverse is also true: As peaceful settlement becomes less common, trust declines, international norms shift and conflict becomes more likely. So there is an unfavorable tipping point.
Back when I blogged at Economic Populist, Rob Oak used to tell me that my posts on the Kondratiev cycle drew the least reads. Which is a shame.
Because the Kondratiev cycle, the credit bubble of a the last several decades, and the Ukraine crisis are all demonstrations of the same long term phenomena. That is, that society is most vulnerable to shocks of the type of which it has no firsthand memory.
World War 1 occurred after a century of nearly complete European peace. The only major war after the Napoleonic War that ended in 1815, was the Franco-Prussian War of 1870, and that was both brief and decisive.
By the time 1914 came around, nobody in Europe had any living memory of a protracted, destructive, major war. Since the living memory was gone, governments made all the mistakes that those who actually lived through a major war would have avoided.
Similarly, by the 1990s and 2000s, the living memory of the 1920s credit bubble was gone. Yes, there might be some old codgers who would lecture their grandchildren about the evils of too much debt, but what did they know? Times had changed. Except of course, as it turned out in 2007-09, they hadn't.
Back in the 1970s, graphs showing how the sky-high interest rates then current "demonstrated" that the Kondratiev wave had no value, were published in investment books. Except right on time in 1981 interest rates peaked, almost exactly 60 years after their prior secular peak. This is treated by most as strictly chance, although since then we probably had a secular low in 2012, 64 years after the prior secular low in 1948. We won't have a serious threat of inflation until the 2030's, by which time those of us who remember the 1970s will be old codgers shouting at clouds, or will have passed this mortal coil.
And the last naked major land-grab in Europe took place in 1945, as Stalin de facto annexed Eastern Europe to the Soviet Union. Of course, it was Hitler's land grabs in Austria, the Sudetenland in Czechoslovakia, and finally Poland, which ultimately caused World War 2. That was 70 years ago, and nobody under the age of 75 has any living memory of that event.
Which means I disagree with Jay Ulfelder. Peaceful resolutions beget peaceful resolutions only up to the point that enough of the prior generation which remembers a major war is gone. Once that point has been reached, many or most of the players will put their collective guards down, leaving them flatfooted in the face of the first major old-fashioned aggressive annexation. Now that Putin has successfully annexed several smaller pieces of the old Soviet Union without meaningful consequence, and is about to annex Crimea, Europe and the US are shouting about economic sanctions. If I were Putin, I would be thinking, "they are already going to their maximal response. I have nothing to lose by also annexing part or all of the remaining (militarily helpless) Ukraine."
The Millennial generation well understands the problems of excess credit and of laissez faire capitalism. Those problems will not advance further and are likely to be pushed back dramatically during their watch. But they don't remember inflation. And no living generation today except for the very old remember World War 2.
Which is exactly why the world is becoming increasingly vulnerable to acts of naked aggression, and a resulting conflagration.
Subscribe to:
Comments (Atom)


