Saturday, December 9, 2006

The Long View: Current Account (BruceMcF)


This post could be seen as following up on a number of good posts connected to the state of play with the most recent current accounts numbers and events in US$ foreign exchange markets. However, that would be an illusion ... indeed, as you can see above, "2006" is not even in view here. The focus here is on the long term.

And I will stress, this is the long term not the long run. The long run is about the logical implications if we take hold the current framework of technology and institutions constant and let all short run market fluctuations to run their course. The long term is about the long lasting, durable impacts of historical processes that take time to unfold, which most definitely involves technology and institutions not remaining constant.

However, I am going to try to avoid dwelling on this kind of academic distinction and focus on the historical process at hand ... and before this week's numbers had been released, I chose the Balance of Payments as a topic. Why? ... well, you'll see why.

That figure up there gives 5-year sequential averages, ending in the listed year, for the three main "memorandum item" summaries listed in the US Balance of Payments. The numbers are from the Bureau of Economic Analysis. They are percents, because they are current-dollar values from the U.S. International Accounts Data
(Table 1. U.S. International Transactions), divided by annual US current GDP.

This is sequential 5 year averages precisely because I want to take the long view. The solid line shows the overall current account balance, made up of the trade balance (goods and service), income balance and balance on unilateral transfers.

As you can see, while there are interesting stories in the last two parts, the big splash headline story is all in the trade deficit.

This is what a trade deficit blow-out looks like. Just in case someone asks you for an example, you can send them that graph. And remember -- this is a 5 year sequential average,. The actual values in current US$:
  • 2001, -$389b current (-$363b trade)
  • 2002, -$472b current (-$421b trade)
  • 2003, -$528b current (-$495b trade)
  • 2004, -$665b current (-$611b trade)
  • 2005, -$792b current (-$717b trade)
So it is both very bad, and getting worse at a rapid rate.

The two main cross-sections for this are by industry and by country or region that we trade with, and I plan to look at each of those in more detail in upcoming weeks. However, right now I want to think a bit about what this massive trade deficit blow out means for the overall state of the USofAmerican Economy.

Impact On Savings

First there's savings. Gross new saving in a year is the same as net assets created by the main sectors of the economy: consumer borrowing, business investment in newly produced assets (eg, equipment), government borrowing from the private sector (domestic finance of the budget deficit), and our net private lending abroad.

Consumers going deeper into debt are "dissaving", so that when we look at net savings, growth in consumer debt has already been netted out.

And the effect of the trade deficit on the rest? We need to borrow from abroad to finance this massive trade deficit. In the aggregate, the trade deficit is sending all of the financial wealth created by government borrowing and sending it overseas, topped up by hefty chunk of the financial wealth that is claiming benefits from business investment in productive capacity.

Or, from an income-flow perspective, the Saving can not take place because the income from which to save flowed overseas instead of reciruclating inside the US.

And since the trade deficit is getting very bad, very quickly, saving in this country is collapsing (US savings improves, but still negative). Household savings rates are already negative, so that the net saving that is taking place is restricted to growth in corporate retained earnings. It is an open question how much "negative saving" (net borrowing) by households the financial sector can sustain ... but if we begin to reach a limit there, attention will shift to the financial footing of US-based corporations.

Impact on Industrial Development

Most technological progress is embedded in the equipment we use to produce and the techniques we use to organize the production process. This means that a lot of the productivity gains from technological progress arises from learning by doing.

And for more and more goods and services, we ain't the ones doing it. When the doing occurs overseas, that is where the gains from technological progress occurs. And those productivity gains are the bedrock foundation for providing ongoing real income growth ... growth in terms of the purchasing power of the normal hourly wage.

There is also a positive feedback relationship between private productivity gains and public contributions to productivity, from education, basic infrastructure, and basic research -- that is, between private productivity gains and government investment.

When industry gains in productivity, that increases the ability of the economy as a whole to meet government demands for goods and services without inflation. And when those government demands include a substantial amount of government investment spending, it both lays the foundation for new rounds of learning by doing in those industries, but also helps to spread opportunities for productivity gains in other parts of the economy.

Social Insurance and the Dependency Ratio

An issue that we will be facing over the next twenty years, as the Baby Boomer generation retires, is the dependency ratio. How many dependents are there for each full time worker (or equivalent)?

Many African nations have long had very high dependency ratios, with children representing almost all the dependents. Family planning and other population control measures were the standard policies offered to cope with the problem. However the dependency problem on the continent of Africa has become even more severe in the past decade due to the HIV AIDS epidemic.

The problem is supporting dependents out of the goods and services produced by workers and providing adequate rewards to those workers at the same time.

However, for national retirement schemes like Social Security, there has long been an upside that helps balance this out. When Social Security checks are spent, that provides a stimulus to the economy. As long as we have a technologically progressive economy, boosting production leads to productivity gains, and productivity gains makes it easier to share income between workers and dependents ... because there is more to go around.

Why doesn't the same happen in many African nations? There is a clear problem: a very large share of the goods bought are imported, so that the productivity gains from learning by doing are not happening within the African nation. Instead, they are happening overseas, primarily in Europe, the US, Japan and China.

And there's the problem: the trade deficit blow-out means that we are becoming less and less like the US of the 1950's, and more and more like a developing nation in Africa. We are becoming more and more dependent on imports. And so the extra income paid for the imports by Social Security recipients flows overseas, and the productivity gains occur over there.

The dependency ratio will rise, inexorably. So this is a problem that will grow even faster than the trade deficit itself. That is, the problem is getting more serious per dollar of trade deficit, and we have a trade deficit blowout.

Waddya We Do About It?

So, its a serious problem ... and it is entangled in most of the other serious problems we facing, making them worse. What do we do about it?

I'm not going to set out any policy proposals today. That would be premature, before I have a closer look at the cross-sections by industry and by trading relationship. But the general menu that policy proposals will be taken from include:
  • Boosting exports by making our products more attractive
  • Cutting imports with some form of tarrif
  • Cutting imports with some form of non-tarriff barrier
  • Depressing the US exchange rates to make exports cheaper and imports more expensive
  • Boosting balanced trade, to grow the economy relative to the trade deficit
And without giving the game away prematurely, four of those five those options will almost certainly show up. I'm not a big fan of non-tarriff barriers to trade, because they tend to create industries that rely on political favors for their profits, rather than relying on productivity gains. But all four of the others are going to show up, in one form or another.

This is a good time for y'all to jump in, since I am now marking this entry, to be continued ...
Dollar Rebounds For the Week

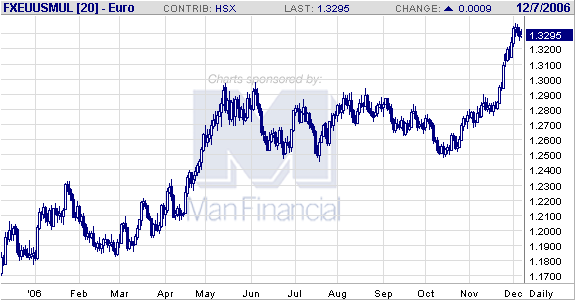
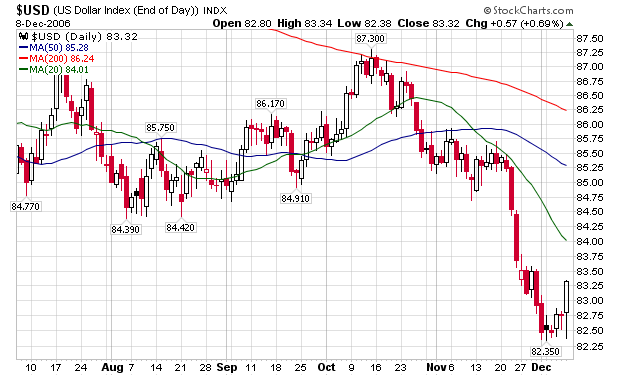
I mentioned we should watch the dollar at the beginning of the week. The dollar rebounded, as this chart shows.

Photobucket - Video and Image Hosting

Friday's job's report helped the rally

The dollar rose after data released this afternoon showed solid US jobs growth in November.

At 1.34 pm, the euro fell to 1.3260 from 1.3275 usd just before the data were released, while the dollar rose to 115.76 against the yen from 115.68 previously. The pound also dropped to 1.9576 usd from 1.9591 previously.

Data from the Labor Department showed US non-farm payrolls rose by 132,000 in November, above market expectations for a gain of around 100,000. Revisions to back data were broadly positive, with October's payrolls revised down to show a gain of 79,000 from the previous estimate of 92,000, but September's reading was revised up substantially to 203,000 from 148,000 previously.


Friday's jobs number gave a boost to the soft landing economists, who are arguing we'll see a slowdown without a recession.

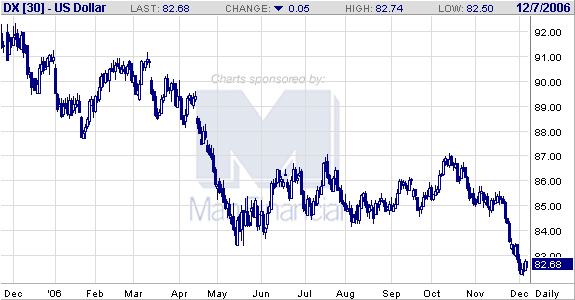
Earlier in the week, the dollar index traded in a very narrow range from $82.50 to $82.75. Narrow trading ranges are signs of accumulation and/or distribution, where supply and demand are roughly equal.

In other words, dollar traders were doing two things this week. First, they were consolidating their positions after the late November sell-off. Secondly, traders were waiting for the jobs report to see what it would imply about the future direction of US interest rates.

So, where do we go from here? The last month of trading has made (roughly) $82.50 a key short-term support area and (roughly) $83.50 a key resistance area. Any move and close above or below these respective levels will possibly indicate a move. However, if prices remain between the above mentioned levels, the dollar index will again be consolidating its respective gains as traders await more clues as to where they sould allocate their money.

Friday, December 8, 2006

Payrolls Come in at +132,000

From the BLS

ftp://ftp.bls.gov/pub/news.release/empsit.txt

Nonfarm payroll employment rose by 132,000 in November, and the unemployment
rate was essentially unchanged at 4.5 percent, the Bureau of Labor Statistics
of the U.S. Department of Labor reported today. Job gains continued in several
service-providing industries, including professional and business services, food
services, and health care. Employment declined in construction and manufacturing.

Looking into the numbers, we have:

Construction down (-29,000)
Manufacturing down (-15,000).

The construction drop is from the housing drop (big surprise). The manufacturing bleed has been going on for the last 4 years. The US is going through a transition to high tech manufacturing and losing lower tech manufacturing. The auto companies poor business decisions aren't helping here.

Education/health +41,000. Leisure and hospitality +31,000. 54% of jobs created are in lower paying industries.

Business/professional services increased (+43,000). Not bad. This sector has been doing well for the last few years.

From Bloomberg

Employers in the U.S. added a greater- than-expected 132,000 workers to their payrolls in November, giving the economy a much-needed charge to help it recover from downturns in housing and manufacturing.

The gain in employment followed a 79,000 increase in October that was less than previously estimated, the Labor Department reported today. The jobless rate rose to 4.5 percent from 4.4 percent the previous month.


From CBSMarketwatch:

Job growth continued at a steady moderate pace in November, the Labor Department said Friday. Nonfarm payrolls expanded by 132,000 in November higher than the 112,000 expected by economists surveyed by MarketWatch. The unemployment rate ticked higher to 4.5% in November from 4.4% - a five year low - in the previous month. Job growth in October and September were revised higher by a net 42,000 jobs. The increase in the unemployment rate was expected. Average hourly earnings increased 3 cents, or 0.2% to $16.94. Economists had been expecting a 0.3% gain. Earnings are up 4.1% in the past year. The average workweek held steady at 33.9 hours, also in line with Wall Street expectations. The factory workweek and overtime both declines in November.


From Reuters:

The U.S. economy added a stronger-than-forecast 132,000 jobs in November, the government reported on Friday, though the unemployment rate edged up slightly from October.

The Labor Department said the unemployment rate was up to 4.5 percent from the 5-1/2-year low of 4.4 percent it reached in October. The new-jobs total last month topped Wall Street economists' forecasts that 110,000 jobs would be created.

All the hiring occurred in service industries, where 172,000 jobs were added, while goods-producing industries shed 40,000 jobs. Some 29,000 construction jobs were lost in November on top of a 24,000-job reduction in October, reflecting the reduced level of activity in homebuilding and other construction.


It looks like the general consensus is a net positive.

Thursday, December 7, 2006

Consumer Credit Falls

From the AP

Consumer borrowing fell in October by the largest amount in 14 years, reflecting a big drop in auto loans.

The Federal Reserve reported Thursday that borrowing declined at an annual rate of 0.6 percent in October following a revised 2 percent increase in September. It was the biggest drop since a 1 percent plunge in October 1992.

Analysts cautioned against reading too much into the one-month change, noting that the consumer credit figures can be subject to major revisions. The 2 percent rate of increase in borrowing in September had originally been reported as a 0.6 percent decline.

However, economists said they are forecasting a slowdown in the rapid pace of borrowing of the past two years as consumers start to feel less wealthy now that housing prices are no longer surging to record levels.

"The wealth effect from rapidly rising home prices is gone now and that should mean that consumers will be less willing to take on debt," said Bill Hampel, chief economist for the Credit Union National Association, an industry trade group.


First, let's note these numbers are pretty wild and can change. However, this is the second month in a row where the initial number has been negative. At some point the first number will be right.

Thanks to record low interest rates consumer debt has exploded during this expansion, rising from 74% of GDP in the fourth quarter of 2001 to over 90% in the third quarter of 2006. Blogger Calculated Risk has calculated that without home equity extraction US GDP growth would have been half as high for this expansion. In other words, consumer debt has been exceedingly important as a funding source for this expansion. There is no bright line economic rule about how much consumer debt is too much. But, I do feel fairly certain that when household debt is greater than 90% of GDP and over 120% of national income, there is a problem.

Also note Hampel's statement above regarding the wealth effect from decreasing housing values. What's important about this statement is the negative impacts of a slowing housing market may just be starting. Instead of being an outright hard landing crash, housing's slowdown may cause death by a thousand cuts. Lack kof equity extraction here, less consumer spending there etc....


Weekly Unemployment Claims Drop

From the Department of Labor

In the week ending Dec. 2, the advance figure for seasonally adjusted initial claims was 324,000, a decrease of 34,000 from the previous week's revised figure of 358,000. The 4-week moving average was 328,750, an increase of 3,500 from the previous week's revised average of 325,250.


Last week there was a large jump in claims, largely as the result of construction lay-offs in several states. This week the massive construction lay-offs are absent.

The 4-week moving average still increased by 3500, but that is to be expected considering last week's jump.

EU Raises Rates 25 BP

From FX Street

The Governing Council of the ECB decided to raise 25bp its bid rate to 3.50% as it was widely expected. This decision has not surprised analysts nor the markets, which have shown almost no reaction to the result of the meeting. This hike is aimed to combat inflation, at a 1.6% y/y rate.

Analysts now turn their attention to the 1330 GMT press conference where JC Trichet is expected to confirm the ECB's strengthening bias without giving any clues of its possible interest rate movements for 2007.


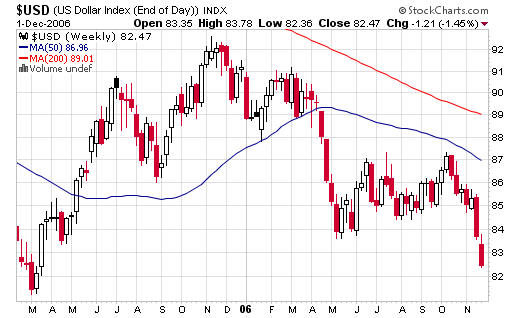
The interest rate differential between the dollar and various currencies has been a boost to the dollar for the last year. That differential is going away, making the dollar less attractive relative to the euro. Here's the chart:

Photobucket - Video and Image Hosting

This drop in the dollar euro trade is one of the primary reasons for the drop in the overall dollar index.

Photobucket - Video and Image Hosting

From May until November, both charts were in a trading range. This indicates traders were accumulating positions. The great trade W.D. Gann said the longer the accumulation pattern, the longer the ensuing run. If that adage holds, the dollar is in for a lower value.

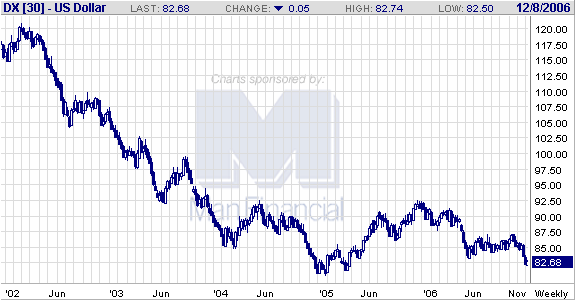
Here's the monthly dollar chart:

Photobucket - Video and Image Hosting

This chart shows the dollar is near multi-year lows. If the dollar crosses below those levels and maintains the trend for a bit after crossing, we're in for a lower dollar for awhile.

Wednesday, December 6, 2006

Home Depot Finds Option Back Dating From 1981

From Bloomberg:

Home Depot Inc., the world's largest home-improvement retailer, said it ``routinely'' backdated option grants to benefit employees for 19 years and had unrecorded expenses of about $200 million related to past practices.

The company's five-month internal probe, which found no evidence of ``intentional wrongdoing'' by company managers or its board, discovered several errors on how the company handled option grants dating back to 1981, Atlanta-based Home Depot said today in a statement.

The retailer is among more than 160 companies that have disclosed government or internal probes into whether it inflated the value of options by retroactively granting them on dates when their stocks were trading lower, according to data compiled by Bloomberg. That made the options worth more than if they had been approved on the grant date.

``It's impossible to state how pervasive the backdating issue is across all of corporate America, but the Home Depot announcement clearly indicates that it's not just a Silicon Valley problem,'' said Mark Edwards, a compensation specialist for Compensia Inc.


There is never any intentional wrongdoing in these matters; it's always an "accident" of some sort. Somehow I bet the executives who benefited hit the grants literally hit the lotto on their option grants.

The person who originally discovered this problem did a statistical analysis of option grants for the last 5 years. He described the timing of the grants as the option lotto, which is where that term above comes from.

Also, let's look at two other points from the article. First, the option grants were $200 million worth since 1981. That's a lot of money, even though it's spread over 20+ years.

Secondly, this quote should cause concern: "It's impossible to state how pervasive the backdating issue is across all of corporate America, but the Home Depot announcement clearly indicates that it's not just a Silicon Valley problem,''

Somehow I think that is the understatement of the year. I think we are going to find a large number of grants like this as the SEC combs through corporate records.

How to Transition the US From a Debt to An Equity Economy

The US’ current economic trajectory is unsustainable in the long run. The domestic economy is dependant on foreign capital to finance consumption beyond our production. The US government has issued over $550 billion dollars in net new debt per year for the last 4 years, indicating the budget deficit is not under control in any meaningful way. The US consumer has taken on an enormous amount of debt to finance the latest economic expansion. In other words, debt saturates every level of the economy to a harmful degree.


What I am about to propose is a radical departure from the overall current economic policy of the United States. Implementing this policy will require an incredibly difficult debate and policy application. The application of this program will hurt many people. Ideally, we should spread the pain out among as many people as possible. However, the pain cannot be avoided. In addition, implementation will take a great deal of time. The method of paying for this plan will be extremely controversial, especially among Democratic circles. Implementation will take consistent effort and sacrifice.


THERE ARE NO EASY ANSWERS TO THE OVERALL PROBLEM. The sooner we accept the reality there will be some pain for everyone, the better off the process will be. As a country, we have lived beyond our means for far too long; it’s time to pay the bill. We have a very bitter pill to swallow. The best thing we can do is swallow the pill and move on.


The short version of this plan is simple: The US must move from a debt to an equity economy.

Overview of the Problem


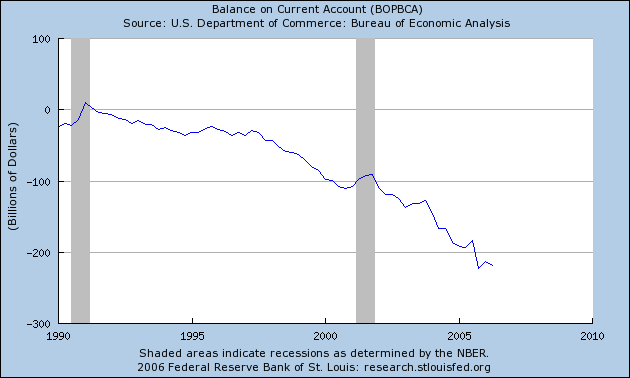
The US international trade deficit has trended to a more negative position over the last 15 years. The following chart is from the St. Louis Federal Reserve:


Photobucket - Video and Image Hosting


A trade imbalance indicates a country is consuming more than it produces. The country with the trade deficit must borrow money too fund the difference between consumption and production. At the current level, the US must import roughly $2 billion/day to finance its consumption. At some point, creditors will demand a higher interest rate for the increased risk associated with holding US debt. In addition, it is also possible for the host country’s currency to drop in value. Should the currency drop in value, the host country has a greater likelihood of importing inflation. Neither possible scenario – an increase interest rates caused by increased perception of risk or a devaluation of the host country’s currency – is beneficial for the host country.


The federal debt situation is just as dire. The problem started with the implementation of supply-side economics in 1981. While the Reagan administration loved cutting taxes, they did not cut spending. As a result, the Federal government issued a large amount of debt, increasing the debt/GDP ration from roughly 30% in 1980 to over 60% in 1988. Bush 43 implemented the same policies with the exact same result. According to the Bureau of Public Debt, the US has issued over $550 billion in net new debt each year for the last 4 years. (For a complete listing of government and revenue and expenditures, please go the historical budget data (PDF) at the Congressional Budget Office.) As a result of Reagan’s and Bush’s policies, the US federal government has issued debt to pay for growth. Here is a graphical representation of the situation.


Photobucket - Video and Image Hosting


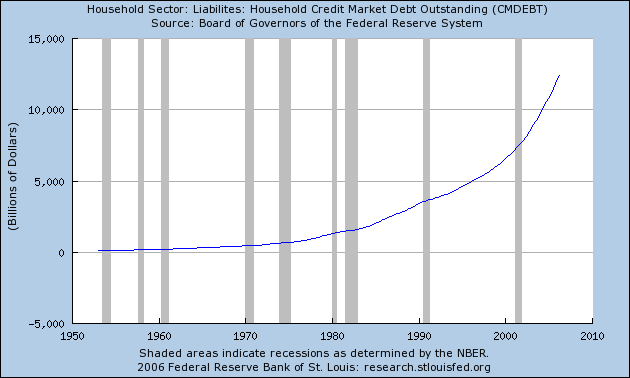
At the household level, we have seen the exact same situation develop over the last 20 or so years. As wages have largely stagnated for a large percentage of the population, households have increased the use of debt to finance their lifestyle. As a result, household debt has continually increased, as the chart below from the St. Louis Federal Reserve indicates.


Photobucket - Video and Image Hosting


So, why is all of this debt bad? To quote Dave Ramsey, you’re making someone else rich. The person that lent you the money gets some of the benefits of your growth. As the amount of debt increases, the lender receives more benefits in the form of higher interest payments. Eventually, the borrower must pay an amount so large that growth is almost painful. While current payments on US debt are not a large amount of money, we have also been the beneficiary of historically low interest rates. It’s only a matter of time before lenders realize the US may not pay its debts and ask for a higher interest rate on their respective debt. This is when we will run into big trouble.

So, we’ve outlined the problem. That’s the easy part. Let’s move into how to solve this problem. This is where a great deal of pain comes in, because there are no easy answers. In fact, there are only difficult answers that must be implemented.


Priority 1. Balance the Federal Budget.


Here are the benefits of a balanced budget.


It prevents crowding out. This is a fancy way of saying money that would finance the federal budget deficit is instead invested in private capital. Let me use the current situation as an example. According to the Congressional Budget Office, the US had a $318 billion budget deficit in 2005. That means $318 billion dollars was not invested in the private economy, but instead invested in US government bonds. The larger the deficit, the less money available for private investment.


Psychology and uncertainty. A budget deficit detracts from individual's confidence in the market and the overall economy. As individual's look to the federal deficit, they understand that at some time the government must pay back the money it borrows. That means the government will probably have to either raise taxes (more likely) or decrease spending (far less likely whichever party is in control of the government). ;Deficits create psychological uncertainty. The larger and more persistent the deficit, the less happy people are and the less prone they are to take economic risks.


One of the primary reasons for the economic expansion of the 1990s was the prevailing sentiment among business leaders that Washington was finally in control of the deficit. This created an environment of confidence which increases economic potential. It’s that simple.


So, how do we balance the budget? First, we either let the 2003 tax cuts expire naturally with their built-in sunset provision or we raise them. I would argue against raising taxes immediately because of the current slowing of the overall economy. I would argue we wait until at least the 3rd quarter of the next economic expansion before we consider this. We also need to look at several other options on the tax front, including reforming the estate code, increasing the maximum amount of income subject to social security taxes and certain corporate giveaways. This is all subject to Congressional give-and-take. But, the bottom line is that if we want to balance the budget we first need to increase government revenue.


In addition, spending has to be cut. And honestly,all programs must be on the table. That does not mean all programs will be negatively impacted to the same degree. However, the Federal government spends a lot of money; we have to decrease the rate of spending to a large degree. For the last 6 years, federal spending has increased an inflation adjusted 35%. That level of spending growth is simply unsustainable.


This process of balancing the budget will take awhile. I would guess at least 6 years if not longer. It will take constant concerted effort. And it will mean a lot of people will catch a lot of flack for the consensus decisions reached in the process. This is where political skill comes into play – the ability to sell this achievement to the electorate in a away that allows Dems to continue the process. It will be a difficult sell – especially after the Republicans have won elections on easy, something-for-nothing themes. I do not envy any political consultant’s job in this task.


OK – that’s the federal side of the deficit. As promised, it is not a pretty picture. However, it is what must be done. Now, how do we deal with the consumer debt?


The first point to make is consumer debt is really a problem of poor wage growth. Save the 1990s, wage growth for most Americans have been stagnant for some time. What has made the “standard of living” bearable is the cost of many things has come down, allowing consumers to feel richer without really being richer. In other words, the central issue is how to create better paying jobs which actually increase wages for most Americans. So, how do we do that?


We take a page from Asian development which has a track record of success. We coordinate three different policies: education, domestic investment, and industrial policy
Priority 2: Education


American manufacturing has undergone a fairly radical transformation over the last 20 years. We have moved from (for lack of a better phrase) a pure brawn model to a brawn and brains model.


But manufacturers, regardless of size, specialty or location, across the USA are reporting a dire shortage of skilled workers: people such as welders, electricians or machinists with a craft that goes beyond pushing buttons or stacking boxes but does not require a degree.


In a survey of 800 manufacturers conducted by the National Association of Manufacturers (NAM) last year, more than 80% said they were experiencing a shortage of skilled workers. In October, manufacturers surveyed by the Federal Reserve Bank of Philadelphia said "finding qualified workers" was their biggest business problem.


The shortage of skilled workers is the result of a number of factors. One of the biggest is that manufacturing in the USA is becoming more high-tech and skill-based as the more repetitive, less-skilled work is moving abroad. Such jobs require greater expertise.


Innovation in the manufacturing sector means that the jobs require greater skills than ever before. According to an analysis by economists Richard Deitz and James Orr at the Federal Reserve Bank of New York, employment in high-skilled manufacturing jobs rose 37%, or by 1.2 million jobs, from 1983 to 2002. At the same time, low-skilled factory jobs dropped 25%, or by approximately 2 million workers.


A paper titled The Changing Nature of Manufacturing in OECD Countries highlights the problem as well. On page 8, the paper notes, “The graph shows that most of the decline in manufacturing employment over the past three decades has occurred in only two activities: textiles and metal products.” The bottom line is the developed world is moving to increasingly high-tech manufacturing.


However, as the evidence from the Federal Reserve and NAM indicate, the US workforce is not ready to make this transition. This means, quite simply, that Americans must go back to school. And high school education must be expanded in important areas --especially math and science. This is what the Asian countries did and still do for the most part. They concentrate education in the primary areas – the American equivalent of K-12 – and make the program much more demanding than their American counterparts.


In addition, we need to improve access and the cost structure of trade schools in huge proportions. There are industries which are currently in their end—stage, at least in the US. Textiles lead the way, as do other more purely brawn-oriented manufacturing. Employees in these industries must be given the benefit to retraining if they are able to make the transition. If they aren’t, we must insure their respective pensions are secured so they can live-out their retirement in dignity.


Priority 3: Targeting high-growth industries


This is the final area to discuss, and frankly it won’t take long. The bottom line is there are several industrial areas that everybody knows show high-promise as industries of the future. Alternate energy development probably tops the list. The world’s energy resources – particularly oil – are either at their peak or near their respective peaks. The world market is in desperate need of a true alternative to oil/petroleum as a means of energy. And it’s time a country spent the capital necessary to develop one or all of the possible alternatives. I cannot speak to the possibilities. However, I know they are out there.


Two of my personal pet projects are stem cell research and nano-technology. I am sure there are others.


The primary way we target these areas is with money – as in massive amounts of federal dollars going into think tanks, research groups and universities to develop these ideas. Pure research has consistently demonstrated itself to be the mother of most of the greatest inventions. Therefore, funding pure research is the best way to develop these industries.


Paying for all of this.


I mentioned above that this would be the most controversial aspect of this idea. I guarantee I wasn’t lying. However, before we get there, let’s sum up the basic problem. At a time when the US economy needs a large infusion of cash for investment, it doesn’t have it. The Federal government is in debt up to its eyeballs. Foreigners are financing our trade deficit. And consumers have already taken on debt in near-epic proportions.


So where do we get the money?


We open up Alaska and the Coastal reefs for drilling. I realize the controversy this idea will generate in Democratic circles. However, governing is about difficult choices. And we have a ton of them to make. Just as importantly, the US economy stands near a very dangerous precipice. We are completely dependant on foreign investors to finance our way of life. The federal government is facing serious financial problems. The US consumer hasn’t seen a meaningful pay raise is some time. In other words, we have very serious problems. Weighing all of these problems against environmental interests is difficult. However, the long-term benefit of this program (as in 50 years from now) outweighs the drawbacks.


However, we do the following. First, we earmark a large amount of the proceeds from this specifically for investment in the above-mentioned programs. We do this through higher royalty fees and a high tax structure on the companies that develop these areas. Secondly, we put in place stringent environmental regulations. Finally, we put in place provisions about using American resources – as in American manpower resources – to perform the work.


So – why should we do this? Frankly, we have little economic or financial choice. The US economy must make the transition to the 21st century. We have little national savings to pull on. We have a government issuing debt like a drunken sailor. And, we have a set of resources that can develop the cash flow to allow us to pay for the above ideas. Just as importantly, as we make the transition we create a large amount of high-paying jobs. The bottom line is this solves a lot of problems.

Tuesday, December 5, 2006

ISM Up (sort-of); Manufacturing Shipments Down

From the ISM

Business activity in the non-manufacturing sector increased at a faster rate in October 2006, say the nation's purchasing and supply executives in the latest Non-Manufacturing ISM Report On Business®.


OK -- but there are issues in the report that I don't like. First, new orders dropped .7 and employment dropped 2.6. That doesn't look good. More importantly, inventories increased 2.5. This might slow activity in the coming few months.

From the Census

New orders for manufactured goods in October, down three of the last four months, decreased $19.3 billion or 4.7 percent to $390.3 billion, the U.S. Census Bureau reported today. This was the largest decrease since July of 2000 and followed a 1.7 percent September increase. Shipments, up two of the last three months, increased $0.4 billion or 0.1 percent to $389.9 billion. This followed a 4.2 percent September decrease. Unfilled orders, up seventeen of the last eighteen months, increased $8.2 billion or 1.2 percent to $666.5 billion. This was at the highest level since the series was first stated on a NAICS basis in 1992 and followed a 4.1 percent September increase. The unfilled orders-to-shipments ratio was 4.56, up from 4.46 in September. Inventories, up twelve of the last thirteen months, increased $1.8 billion or 0.4 percent to $481.1 billion. This followed a 0.6 percent September increase. The inventories-to-shipments ratio was 1.23, unchanged from September.


Now, the backlog of orders increased again. That could be a good sign. IN addition, the report notes "This was at the highest level since the series began and followed a 4.1 percent September increase." However, there are no numbers for the percent of cancellations in the report.

In addition, "Inventories of manufactured durable goods in October, up nine of the last ten months, increased $2.2 billion or 0.8 percent to $293.8 billion, unchanged from the previously published increase. This followed a 1.2 percent September increase." That's a long string of increases to think about.

Productivty Revised Upwards, But Still Slowing

Productivity has been a big factor in this expansion (even though pay increases have not kept up with productivity). However, productivity growth is slowing. From the Bureau of Labor Statistics:

Business sector productivity grew at an annual rate of 0.4 percent
during the third quarter of 2006, as output increased 2.2 percent and hours of all persons engaged in the sector rose 1.8 percent (tables A and 1). When the third quarter of 2006 is compared to the third quarter of 2005, labor productivity rose 1.5 percent. This is the smallest four-quarter increase since a similar rise in the second quarter of 1997. In the second quarter of 2006, output per hour increased 1.1 percent.

Output per hour of all persons in the nonfarm business sector rose 0.2 percent during the third quarter of 2006, reflecting increases in output and hours of 2.3 percent and 2.1 percent, respectively (tables A and 2). The 1.4-percent increase from the third quarter of 2005 to the third quarter of 2006 was the smallest four-quarter gain in nonfarm business productivity since the second quarter of 1997 (1.3 percent). In the second quarter of 2006, productivity in nonfarm businesses had increased 1.2 percent as output grew 2.7 percent and hours increased 1.5 percent.

Housing Soft Landing Continues....

With a big drop in Toll Brothers Profits


Toll Brothers Inc., the largest U.S. luxury-home builder, said fiscal fourth-quarter profit fell 44 percent as orders tumbled and the company wrote down expenses for land.

Net income in the three months ended Oct. 31 dropped to $173.8 million, or $1.07 a share, from $310.3 million, or $1.84, a year earlier, the Horsham, Pennsylvania-based company said today in a statement. Fiscal 2007 earnings will decline by as much as 62 percent from the 2006 figure of 687.2 million, Toll forecast.

A housing slump in the U.S. prompted Chief Executive Officer Robert Toll to reduce the company's land holdings. In an effort to increase sales of its homes, which on average cost more than $700,000, Toll has advertised no mortgage payments for up to six months.

I simply don't see how a soft landing or the "worst is over" is possible at this point. Inventories of new and existing homes are at decades' high levels. The consumer is is heavily indebted. I don't see a happy ending to this situation.


Sunday, December 3, 2006

Watch the Dollar This Week

Photobucket - Video and Image Hosting


This chart does not look good. There is technical support at roughly 81.5 and 81. We'll have to see how it holds.


There are a lot of reasons for this. But, the main reason is the US economy is slowing.

The Commerce Department dealt the first blow against the dollar when it reported that construction activity in October dropped 1 percent, the largest amount since the recession in 2001. Home building fell for a record seventh consecutive month.


The Institute for Supply Management followed with an equally bleak report showing that the U.S. manufacturing sector contracted in November for the first time since April 2003.


U.S. economic data are being watched closely for pointers on the Federal Reserve's interest rate course. Higher rates, a weapon against inflation, tend to strengthen a currency by making investments in it more attractive.


The employment report on Friday could make this very interesting.

Lighter Week Ahead

Last week there was a deluge of data hitting the street. This week we have far fewer items. Productivity, factory orders and non-ISM numbers are on Tuesday. Weekly jobless claims come on Thursday. Last week we say a big increase in construction related losses. We'll have to see if that trend continues this week. Most people will probably be waiting for Friday's employment report to see where the economy stands.