Saturday, July 6, 2024

Weekly Indicators for July 1 - 5 at Seeking Alpha


 - by New Deal democrat


My “Weekly Indicators” post is up at Seeking Alpha.

A recurring theme for the last month or two has been how the high frequency data, updated every week and frequently from private sources, has not confirmed the softness that has cropped up in some of the monthly data.

That was true this week as well.

As usual, clicking over and reading will bring you up to the virtual moment as to the state of the economy, and reward me a little bit for my efforts.

Friday, July 5, 2024

One more time: bifurcation in the jobs report, as Establishment Survey shows continued jobs growth, while Household Survey comes close to triggering the “Sahm Rule”


 - by New Deal democrat


In the past few months, my focus has been on whether jobs gains are most consistent with a “soft landing,” i.e., no further deterioration, or whether deceleration is ongoing. In particular: 


Last month I wrote that “There is a common thread in the above answers: the three good results all came from the Establishment Survey, which as we’ll see below, was very strong. The one very poor result came from the Household Survey, which for the third time in four months was frankly recessionary.”

Importantly, since then I wrote at length about the issue created by the surge in immigration since 2020. To summarize, “The cause of the underestimate of growth in the Household Survey seems most likely to be a big undercount of post-pandemic immigration…. In the past two years through May, according to the Census Bureau, the US population has grown by a little over 1%. But according to the Congressional Budget Office, it has grown slightly over 2%. That’s over a 3,000,000 difference!
….
“If we make the reasonable assumptions that this big surge of immigrants has been from Latin America, and much more closely resembles the prime working age demographic of 25-54 years than the native population, applying those adjustments yields an estimate of an additional 2,000,000 employed through May 2024 vs. official Household Survey numbers.”

“But as the economy has cooled from “white hot” in 2021-22 to memerly “hot, “*new* entrants to the labor force who fail to find their first job will not show up in unemployment claims; but they will show up in the unemployment rate.”

I think that explains most of what we have seen this morning as well.

Below is my in depth synopsis.


HEADLINES:
  • 206,000 jobs added. Private sector jobs increased 134,000. Government jobs increased by 70,000. 
  • April  was revised downward by -57,000, and May was revised downward by -54,000, for a net decline of -111,000. This continues the pattern from nearly every month in the past 18 months of a steady drumbeat of downward net revisions.
  • The alternate, and more volatile measure in the household report, showed an increase of 190,000 jobs. On a YoY basis, in this series only 195,000 jobs, or 0.1%, have been gained. This is not just the lowest YoY increase since the pandemic lockdowns, but with rare exception, it has always and only occurred during recessions.
  • The U3 unemployment rate rose 0.1% to 4.1%, another new 2+ year high. That’s because while employment rose, as per the above, but the number unemployed also rose, by 162,000.
  • The U6 underemployment rate was unchanged at 7.4%, 0.9% above its low of December 2022.
  • Further out on the spectrum, those who are not in the labor force but want a job now declined -483,000 to 5.234 million, vs. its post-pandemic low of 4.925 million in early 2023.

Leading employment indicators of a slowdown or recession

These are leading sectors for the economy overall, and help us gauge how much the post-pandemic employment boom is shading towards a downturn. These were more  positive than negative:
  • the average manufacturing workweek, one of the 10 components of the Index of Leading Indicators, rose 0.1 hours to 41.0 hours, but is still down -0.5 hours from its February 2022 peak of 41.5 hours.
  • Manufacturing jobs declined -8,000.
  • Within that sector, motor vehicle manufacturing jobs declined -100. 
  • Truck driving declilned -100.
  • Construction jobs increased 27,000.
  • Residential construction jobs, which are even more leading, rose by 3,100 to another new post-pandemic high.
  • Goods producing jobs as a whole rose 19,000 to another new expansion high. These should decline before any recession occurs.
  • Temporary jobs, which have generally been declining late 2022, fell by another -48,900, and are down about -500,000 since their peak in March 2022. This appears to be not just cyclical, but a secular change in trend.
  • the number of people unemployed for 5 weeks or fewer declined -181,000 to 2,128,000.

Wages of non-managerial workers
  • Average Hourly Earnings for Production and Nonsupervisory Personnel increased $.10, or +0.3%, to $30.05, for a YoY gain of +4.0%. This continues the decelerating trend in YoY growth in wages since their post pandemic peak of 7.0% in March 2022. Keep in mind that this is still significantly higher than the inflation rate YoY as of last month.

Aggregate hours and wages: 
  • the index of aggregate hours worked for non-managerial workers declined -0.2%, and is up 1.3% YoY, basically in trend for the past 12+ months.
  •  the index of aggregate payrolls for non-managerial workers rose 0.2%, and is up 5.3% YoY. These have been slowly decelerating since the end of the pandemic lockdowns. But with the latest YoY consumer inflation reading of 3.3%, this remains powerful evidence that average working families have continued to see gains in “real” spending money.

Other significant data:
  • Professional and business employment declined -17,000. These tend to be well-paying jobs. This series had generally been declining since May 2023, but earlier this year had resumed increasing again. As of this month, they are only higher YoY by 0.3% - a very low increase that has *only* happened in the past 80+ years immediately before, during, or after recessions.
  • The employment population ratio remained steady at 60.1%, vs. 61.1% in February 2020.
  • The Labor Force Participation Rate increased +0.1% to 62.6%, vs. 63.4% in February 2020. It had been growing sharply from late 2021 through 2023, but has completely stalled this year.


SUMMARY

This month’s report continued the theme of much of this year: a fairly strong Establishment Survey, and a weak Household Survey. Turning to the latter first, there was yet another uptick in the unemployment rate, and the pathetic YoY growth in the number of employed as noted above was also consistent with an imminent or even ongoing recession. 

But the Estabslishment Survey remained generally strong, although there were some more cracks in it this month. Aside from the headline growth, most of the leading sectors, as well as manufacturing hours, also showed growth. The nominal gain in average hourly earnings and aggregate payrolls was also decent. The aforesaid “cracks” included a pronounced problem in the (non-)growth in professional and business jobs, the continued decline in temporary help, and the small declines in motor vehicle manufacturing and trucking employment.

There will probably be lots of chatter in the next few days as to whether the “Sahm Rule” has been triggered. It has not, because the 3 month average in the unemployment rate is 4.0%, and the lowest 3 month average in the last year is 3.6%. Additionally, Claudia Sahm herself has indicated that the same immigration issue I have highlighted may also make her metric signal a false positive this time.

Unless there are very large downward benchmark revisions in the Establishment Survey, what I see is continued if less strong growth in the number of jobs, but with fewer new entrants successfully landing those jobs, and several important weak spots, particularly in professional and business employment.

Wednesday, July 3, 2024

ISM weighted manufacturing + non-manufacturing indexes warrant hoisting a yellow caution flag for the economy


 - by New Deal democrat


I’ll spare you the introductory graphs this month, but let me reiterate my opening comments from last month:


I never used to pay much attention to the ISM non-manufacturing report. That is partly because it only has a 20 year history, and partly because it seems to be more coincident than leading, but because manufacturing has faded so much as a share of the US economy, with at least two false recession signal in the past 10 years (2015-16 and 2022-23), there is no choice but to pay more attention.

In particular, it does seem that when we include this as part of a weighted average (75%) along with the ISM manufacturing index (25%), it has generated a much more reliable, and still timely, reading over this Millennium.

On Monday, the ISM manufacturing index, and its more leading new orders component, continued to be negative. In May, the non-manufacturing index this morning completely outweighed that in its strength.  

But not today, as the non-manufacturing index and its new orders component both fell below 50 for the first time since December 2022:


 Here are the last five months of both the manufacturing (left column) and non-manufacturing index (center) numbers, and their weighted average (right):

JAN 49.1. 53.4. 52.3
FEB 47.8  52.6. 51.4
MAR 50.3. 51.4. 51.1
APR 49.2  49.4.  49.3 
MAY 48.9. 53.8. 52.5
JUN 48.5. 48.8. 48.7

And here is the same data for the new orders components:

JAN 52.5. 55.0. 54.4
FEB 49.2  56.1. 54.4
MAR 51.4. 54.4. 53.6
APR 49.1. 52.2. 51.4
MAY 45.4. 54.1. 51.9
JUN. 49.3  47.3. 47.8 

This is the second time in three months that the weighted average for the total indexes came in below 50. The more leading new orders index was also below 50 for the first time.

To generate a reliable signal, we would need the 3 month average to be below 50. The weighted average for the total is 50.2. For new orders it is 50.4. 

In other words, the signal for the combined weighted ISM indexes remains expansionary - but just barely - in its forecast for the next few months. If it were just a little bit worse, it would be enough, in conjunction with what has been happening with building construction, to hoist a recession watch (note: NOT “warning”!). But it is enough to hoist a yellow caution flag for the economy.

Jobless claims appear to show both signal and post-pandemic seasonality noise


 - by New Deal democrat


Since tomorrow is the Big Holiday, initial and continuing claims were reported today. [Also, on a programming note, later this morning I will also post about the ISM non-manufacturing survey once it is published, since it now plays an increased role in my forecasting].


Initial claims rose 4,000 last week to 238,000, while the four week average increased 3,250 to 238,500. Continuing claims, with the usual one week delay, also increased, by 26,000 to 1.858 million, the highest level since the end of November 2021:


I continue to suspect that unresolved post-pandemic seasonality is playing a role in these numbers, since we had a similar spike last year. And on that score, the YoY% changes in initial claims continued to be down, by -4.0%, and the four week average by -5.3%. Continuing claims are higher YoY by 5.1%:


While for forecasting purposes the YoY declines mean they are positive, it is also noteworthy that the YoY trends are “less positive” for initial claims and “slightly more negative” for continuing claims. So in addition to unresolved seasonality, there probably is some signal of relative weakness in the recent increase in claims.

Finally, on Friday we will get the employment report. Here is the update of initial and continuing claims vs. the unemployment rate:


As I’ve written many times, there is nearly a 60 year reliable history of initial and continuing claims leading the unemployment rate. The few exceptions happened coming out of recessions when the labor force increased sharply. That may be what is happening now, as I wrote several weeks ago. There has been a huge influx, on the order of 6 million, immigrants in the past several years. The employment market has likely cooled enough that it cannot absorb all of them any more.

So, it would be *extremely* unusual for the unemployment rate to continue moving higher even as initial and continuing claims declined this spring. In short, the historical record says the unemployment rate should move down, or at least be flat. If it moves higher, it is almost certainly about the aforesaid immigration issue, and would likely be an exception to the “Sahm rule.” We’ll see on Friday.

Tuesday, July 2, 2024

JOLTS report shows stabilization in almost all metrics for May


 - by New Deal democrat


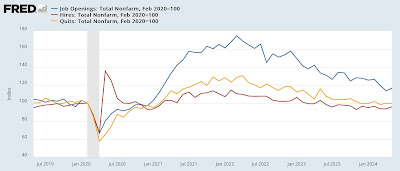
The JOLTS report for May showed most metrics continued to show a slight rebounding from their March lows. The overall picture for now appears to be one of stabilization, consistent with the fabled “soft landing.”

To the data: job openings (blue in the graph below), a soft statistic that is polluted by imaginary, permanent, and trolling listings, rose 221,000 from its downwardly revised post-2020 April low  to 8.140 million (vs. a pre-pandemic peak of 7.594 million). Actual hires (red) rose 141,000 from their second-lowest post-2020 level to 5.756 million (vs. a pre-pandemic peak of 6.0 million). Voluntary quits (gold) rose 7,000 from downwardly revised near-post 2020 lows in April 3.459 million. In the below graph, they are all normed to a level of 100 as of just before the pandemic:


For the past six months quits have been essentially even with their pre-pandemic levels, and for the past eleven months hires have been below those levels.

A similar situation remains the case with layoffs and discharges (blue in the graph below), which increased sharply from their 12 months low in April to 1.654 million, but continue to run roughly 20% below the level they had been at *any* point before the pandemic, and well within their overall flat trend for the past year:


The more leading weekly initial jobless claims (red), which have increased signficantly in the past month, suggest that layoffs and discharges may similarly increase out of this trend in the next several months.

Finally, the quits rate was unchanged at 2.2% for the seventh month in a row. I won’t bother with the long term graph this time around, but since, as I have noted for a number of months now, the quits rate (blue in the graph below, right scale) tends to lead average hourly earnings (red), this suggests that the deceleration in nominal wage growth may come to an end in upcoming months - which overall is probably a positive:


My big concern over the past year has been if a further deceleration in wage growth were to coincide with an upturn in inflation, because that would likely cause a decline in real consumer income and spending. Thus if the rate of wage growth is stabilizing, this is a good thing for workers, especially if inflation continues to gradually subside.

Monday, July 1, 2024

June manufacturing rebounds, May construction spending declines to (only) slightly negative


 - by New Deal democrat


As usual, the month starts out with important data on manufacturing and construction. There was bad news and good news. The bad news is that both were negative. The relatively good news is that they were so slightly negative as to be essentially flat.


First, the ISM report on manufacturing declined very slightly - by -0.2 - further to 48.5. This is the third month in a row that this index has been under the equipoise point of 50. On the other hand, the more leading new orders subindex recovered by 3.9 from last month’s dismal 45.4 to 49.3:


While this is a mildly negative report, manufacturing has not been nearly so important in the Millennium as it was in the post-WW2 period, so negative readings, unless *very* poor, normally have still not meant recession. For the last 20 years the weighted average of the manufacturing (at 25%) and non-manufacturing (at 75%) indexes have been much better correlated with expansion vs. contraction. Last month the ISM non-manufacturing index came in at 53.8, and its new orders component at 54.1. Similar readings for June would mean continued overall expansion.

Turning to construction, total nominal spending declined -0.1% in May, but is higher 6.4% YoY. The more leading residential sector also showed a -0.2% decline, and is higher by 6.6% YoY:


Since producer prices for construction materials declined -0.1% in May and are down -1.4% YoY, the “real” residential construction numbers are unchanged for total construction and less than -0.1% negative for residential construction spending:


Finally, the Inflation Reduction Act, which conferred favorable tax benefits for “restoring,” led to a sharp increase in manufacturing construction spending, which rose another 1.3% for the month to another new record, and accelerated to 20.3% higher YoY:


To reiterate my big theme for this year: I am especially concentrating on these two leading sectors to tell us whether we are having a continued “soft landing” or not. That both sectors are now tilting to negative (construction had been holding up until recently) is definitely not good. But the negative numbers are so slight that they do not even merit a yellow caution flag yet.

Sunday, June 30, 2024

Weekly Indicators for June 24 - 28 at Seeking Alpha


 - by New Deal democrat

I didn’t do this yesterday, so let’s take care of it today ….

My “Weekly Indicators” post is up at Seeking Alpha.

The high frequency data continues to suggest an economy that is chugging along, not particularly hot but not particularly cool either.

As usual, clicking over and reading will bring you up to the virtual moment on the economic data, and reward me a little bit for organizing and presenting it to you in a coherent format.