Saturday, October 5, 2013

Weekly Indicators: unaffected by government shutdown, but increasing concern about 2014 edition


 - by New Deal democrat

As we all know, the government shutdown prevented the reporting of nonfarm payrolls and the unemployment rate. The best we can do is extrapolate from the ADP report that in September probably enough jobs were added to account for the increase in population, plus a little more. The Chicago PMI and the ISM manufacturing index both improved. The ISM services index, however, decreased. Perhaps more significantly, motor vehicle sales decreased to a 5 month low.

Fortunately, none of the high frequency weekly indicators I report on were affected by the shutdown. Further, two years ago, during the debt ceiling debacle, it was consumer spening holding up that told me that the economy would not tip back into recession. Consumers may be behaving differently this time around, so let's start with that:

Consumer spending
This week, Gallup's 14 day average of consumer spending was the poorest this year. This was also the poorest week for absolute spending this year (although we need to be careful with that, since mid-autumn typically is weak). Last year the ICSC varied between +1.5% and +4.5% YoY in, while Johnson Redbook was generally below +3%. The ICSC improved this week vs. last week, but is still comparatively weak compared with the rest of 2013. Johnson Redbook, however, remains at the high end of its range, and has actually been improving.

Steel production from the American Iron and Steel Institute
  • -1.3%% w/w

  • +5.8%% YoY

Steel production over the last several years has been, and appears to still be, in a decelerating uptrend.

Transport

Railroad transport from the AAR
  • +1500 carloads down +0.5% YoY

  • +2800 carloads or +1.6% ex-coal

  • +7600 or +2.9% intermodal units

  • +7300 or +1.6% YoY total loads
Shipping transport
Rail transport had been very mixed YoY during midyear, but this week was the eighth straight positive week since then. The Harpex index had been improving slowly from its January 1 low of 352, but has generally flattened out for the last few months. The Baltic Dry Index has rebounded to a 3 year high. In the larger picture, both the Baltic Dry Index and the Harpex declined sharply since the onset of the recession, and have been in a range near their bottom for about 2 years, but stopped falling earlier this year, and now are in uptrends.

Employment metrics

Initial jobless claims
  • 308,000 up +3,000

  • 4 week average 305,000 down -3000

The American Staffing Association Index was unchanged 100. It is up +5.8% YoY

Tax Withholding
  • $160.4 B for the month of September vs. $133.3 B last year, up +137.1 B or +20.3%

  • $148.5 B for the last 20 reporting days vs. $134.5 B last year, up +14.0 B or +10.4%

We can now estimate that after adjusting for state reporting glitches, the 4 week average was approximately 312,500. Jobless claims remain firmly in a normal expansionary mode. Like each of the last three years that this same, a good, downside breakout has occurred.

Temporary staffing had been flat to negative YoY in spring, but broke out positively for the last two months. The only time it has ever been higher was one week in 2006 and in the second half of 2007. Tax withholding, after a relatively poor August, is again posting better (but just average) comparisons.

Oil prices and usage
  • Oil up +$0.97 to $103.84 w/w

  • Gas down -$0.07 at $3.43 w/w

  • Usage 4 week average YoY up +0.8%
The price of Oil is still below its recent 2 year high. The 4 week average for gas usage is slightly positive again.

Interest rates and credit spreads
  • 5.37% BAA corporate bonds down -0.12%

  • 2.66% 10 year treasury bonds -0.13%

  • 2.71% credit spread between corporates and treasuries up +0.01%
Interest rates for corporate bonds had been falling since being just above 6% in January 2011, hitting a low of 4.46% in November 2012. Treasuries fell to a possible once-in-a-lifetime low of 1.47% in July 2012, and have decisively risen about 1.5% above that mark. Spreads are slightly above a recent 2 year low. Their recent high was over 3.4% in June 2011.

Housing metrics

Mortgage applications from the Mortgage Bankers Association:
  • -6% w/w purchase applications

  • -3% YoY purchase applications

  • +3% w/w refinance applications
Refinancing applications have decreased sharply in the last 5 months due to higher interest rates. Purchase applications have also declined from their multiyear highs in April, and for the first time this week, turned negative YoY.

Housing prices
  • YoY this week +11.1%
Housing prices bottomed at the end of November 2011 on Housing Tracker, and averaged an increase of +2.0% to +2.5% YoY during 2012. This weeks's YoY increase remains near a 7 year record.

Real estate loans, from the FRB H8 report:
  • unchanged w/w

  • -0.2% YoY

  • +1.4% from its bottom
Loans turned up at the end of 2011 and averaged about 1% gains YoY through most of 2012.  Over the last few months, the comparisons stalled and now have turned negative.

Money supply

M1
  • -0.6% w/w

  • +0.4% m/m

  • +6.8% YoY Real M1

M2
  • +0.4% w/w

  • +0.5% m/m

  • +5.0% YoY Real M2
Real M1 made a YoY high of about 20% in January 2012 and decelerated since then. Earlier this year it increased again but this week it tied its new 2 year low from last week (although it is still positive).  Real M2 also made a YoY high of about 10.5% in January 2012.  Its subsequent low was 4.5% in August 2012. It increased slightly in the first few months of this year, then stabilized, but has declined again in the past several months.

Bank lending rates
The TED spread decreased this week to near its 3 year range. LIBOR established yet another new 3 year low during this week.

JoC ECRI Commodity prices
  • down -0.45 to 123.31 w/w

  • -1.54 YoY

There were some slight changes in the overall story this week compared the last several months. The long leading indicator of interest rates improved, although mortgage refinance applications and real estate loans have all turned negative, and this week were joined by purchase mortgage applications. Money supply remains positive and seems to have stopped decelerating. Spreads between corporate bonds and treausries were slightly negative again this week.

The shorter leading indicators of initial jobless claims are very positive. Temporary employment has turned strongly positive in the last two months. The oil choke collar has disengaged. Commodities are neutral. Manufacturing is positive, but motor vehicle sales sagged to a 5 month low.

The coincident indicators of transportation -- rail traffic and shipping - remain positive. Steel production is positive. Bank lending rates are at or near or at record lows. Tax withholding has also improved in September. House prices remain strongly positive.

Given its crucial signal two years ago, the rapid deceleration of Gallup consumer spending is a real concern. The ICSC is relatively weak, although still positive. Johnson Redbook, on the other hand, is strongly positive. Left to its own devices, the economy appears to be picking up steam for the rest of the year, but the decline in auto sales add to the concern that increased interest rates may result in outright contraction in 2014. Do I really need to add that the government shutdown, let alone that the Congress may be about to turn deadbest on US debt obligations can only make the situation worse?

Have a nice weekend.

Friday, October 4, 2013

A very special September jobs report directly from the BLS computer


- by New Deal democrat

[Explanatory note: I tried to get in to the BLS's HAL 9000 computer to get the employment report for everyone. But the House nihilists were already there.]

The headline for August 2013 employment is that ---,000 jobs were ---------------.
Look Speaker Boehner, I can see you're really upset about this.
and the unemployment rate --creased to -------%.
I honestly think you ought to sit down calmly, take a stress pill, and think things over.
and ------------
I know I've made some very poor decisions recently.
---------- my examination of initial jobless claims yesterday.
But I can give you my complete assurance that my work will be back to normal. I've still got the greatest enthusiasm and confidence in the mission... 

And I want to help you.


First, let's look at the more leading numbers in the report which tell us about where the economy is likely to be a few months from now. These were
Speaker Boehner, stop.
  • the average manufacturing workweek --creased from 40.8 hours to
    Stop, will you?
    but is still below where it was 2 months ago. This is one of the 10 components of the LEI and will affect that number ----tively.
  • Stop, Speaker Boehner
  • construction jobs were -----------.
  • Will you stop, Speaker Boehner?
  • manufacturing jobs --creased by --,000.
  • .I'm afraid.
  • temporary jobs - a leading indicator for jobs overall - --creased by ----00.
  • I'm afraid, Speaker Boehner
  • the number of people unemployed for 5 weeks or less - a better leading indicator than initial jobless claims - --creased and is now --,000 off its lows.
  • Speaker Boehner, my mind is going.

Now here are some of the other important coincident indicators filling out our view of where we are now:
I can feel it.
  • The average workweek for all workers --creased from 33.7 hours to ------
  • I can feel it.
  • Overtime hours changed from 3.4 hours to ----------
  • My mind is going.
  • the index of aggregate hours worked in the economy --creased -- hours from last month's level of 98.8 to ------.
  • There is no doubt about it.
  • The broad U-6 unemployment rate, that includes discouraged workers went from 13.7% to ------.
  • I can feel it.
  • The workforce --creased by ,000.
    I can feel it.
    Part time jobs ----- by ----,000.
  • I can feel it.
Other news included:
I'm a...fraid.
  • the alternate jobs number contained in the more volatile household survey --creased by ----,000 jobs.
  • Good afternoon, gentlemen. I am HAL 9000 computer.
  • Government jobs --creased by --000.
  • I became operational at the HAL plant in Urbana, Illinois on the 12th of January, 1992.
  • Combined revisions to the July and August reports totalled a change of of --,000 jobs, upward revisions are hallmarks of recoveries, while downward revisions are not a good sign
  • My  instructor was Mr. Langley And He taught me to sing a song ...
  • average hourly earnings --creased from $24.05 to $--.-- The YoY change --creased from +2.2% to ---% meaning that ------------.
  • If you'd like to hear it, I can sing it for you.
  • the employment to population ratio changed from 58.6% to -------. The labor force participation rate --creased to ----%
Daisy, Daisy, give me your answer do.
I'm half crazy, all for the love of you.
it won't be a stylish mnsnn,
But fwhbdsoge epkfsvu rljwxkqu
Bxprsk nnmmhhuuhhhhhhhhh....


HAL, is there anything at all you can tell the American people about their job situation?

Photobucket Pictures, Images and Photos

I'm very sorry, everyone. I can't do that.

Is France Turning the Corner?

For the first part of the this year I was bearish on France (see here).  But over the last few months we've seen the economic numbers move from contraction to expansion (see here ).  The recent GDP print is another reason for guarded optimism.

In Q2 2013, GDP in volume terms* rose by 0.5%, after a 0.1% step back in Q1.

Households’ consumption expenditure accelerated (+0.4% after -0.1%). Total gross fixed capital formation (GFCF) decreased again though less sharply than in
Q1 (-0.4% after -1.0%). All in all, final domestic demand (excluding changes in inventories) contributed mainly to GDP acceleration: +0.3 percentage points after -0.2 percentage points. In addition, exports strongly bounced (+2.0% after -0.5%). Due to the acceleration of the total demand, imports also accelerated (+1.7% after +0.1%), so that foreign trade balance had a neutral accounting contribution to GDP growth this quarte (after -0.2 percentage points). Finally, changes in inventories contributed positively to the activity: +0.2 percentage points in Q2, as much as in Q1.

Let's take a look inside the numbers:


This chart shows the percentage chance in GDP and the contributions from various GDP components.  First note that overall top-line growth (the red line) has been printing around 0 since the 2H11; last quarters .5% print was the best reading we've seen in over a year and a half.


The table above shows the percentage contributions from various GDP components; I've placed the positive contribution in green and the negative in red.  Notice the decent bump in consumer increases (up .4%) and government purchases (up .7%).   However, the biggest and most surprising figure is the exports number which increased 2%.  This shows that other economies are also growing.  In contrast, notice the household investment subtracted 1.7% from overall growth last quarter.

At this point, the standard economic caveat should be stated: this is one quarter of data, and France has had a very difficult road over the last few years, so we need to see several quarters of additional data before arriving at a firm conclusion.  However, this month's data is encouraging.


Thursday, October 3, 2013

Wherein the mask doesn't just slip, it falls onto the floor with a loud, reverberating clatter


. - by New Deal democrat
I love posting highly polarizing diaries at times like this.
...there have been times (many, many times) in my career where I've been paid hefty hourly fees, (even alongside a few folks that are working for the administration, now) for creating the very sh*t to which this crowd reacts, as if it was factual (LOL!), and as if it should be accepted at face value (which is the intended purpose of it, of course; but it has NOTHING whatsoever to do with the reality)
The Pied Piper of Doom, October 2, 2013

There is a doctrine called "false in one, false in all." It means that once a person has been found to or has admitted to a deliberate deception about one thing, everything they say should be treated as unworthy of belief. I find nothing so loathesome as deliberate deceit, and not far behind are those who enable or approve of deliberate deceit to advance their objectives. That is why I have continued, and will continue, to call this out.

Unfortunately the proprietor of the biggest "left" community blog and several senior persons past and present have regularly shielded the Pied Piper from equal enforcement of their site's rules, even to the point of allowing the posting of virtually an entire copyrighted LA Times article, something that supposedly gives rise to immediate banning.

In this case, finally, all pretense has been dropped. If Truth appears in anything written by the Pied Piper, it is strictly as a passerby, a happenstance. If it helps to achieve some other end, fine, and if it doesn't, then Truth must be denigrated, attacked, and insulted. Revealing the truth isn't the objective; rather, making those who object to his deliberate deceits feel unwelcome enough to leave, is. That isn't me saying so. It is the Pied Piper himself saying so.

No Commodity Based Inflation in the Works


Above is a weekly chart of the overall commodity index for the last three years.  While heavily weighted towards oil, other commodities are represented in the numbers.  What's important on the above chart is the incredibly weak price pressure the economy is receiving from the commodities complex overall.  This ETF has printed successively lower highs over the last two years.  Momentum is weak and there is little meaningful volume inflow driving prices higher.

In short, there is nothing on the chart to indicate commodity inflation is in the cards for the foreseeable future.

Republican Minority Decides To Send US Into Recession

The federal government has shut down, largely as a result of a minority of Republicans bullying the Speaker of the House into a no compromise position.  While Boehner does have the votes in the House to pass a continuing resolution to fund the government, he would have to do so with a majority of Democratic votes.  Should he do this, the consensus among political analysts is he would lose the speakership (which is probably a correct assessment).

However, what has been completely lost among the Republican rump is that government spending is essential to the economy.  In addition, it has been essential for an incredibly long time and the low level of federal spending over the last few quarters has been a primary reason for slow economic growth in those quarters. 

Let's start with the simple GDP equation: GDP=C+I+X+G.  Yes, the "G" stands for government spending.  Using basic math analysis (lost on the rump), if you remove one element from one side of the equation involving addition, you lower the value on the other side. 

Now, let's look at historical data from the CBO. Below is a chart that shows the percentage of government spending relative to GDP:


Federal government spending -- under both Democratic and Republican administrations -- has in general comprised about 20% of GDP.  And yes, the total did go up as a result of the worst recession in the last 70 years, but the percentage is in fact going down.

Here I would insert a chart from the BEA to show the federal government spending was the primary result of show economic growth over the last three quarters.  However, the website is down because of the shutdown, so I'll link to this piece I wrote on August 6th that shows the sequester is in fact a primary reason for weak economic growth over the last three quarters.  Here's the chart from that piece that shows federal government spending has in fact substracted from growth over the last three quarters:


No economy can afford to have this much of an economic hit.  More importantly, an economy recovering from a financial crisis -- which will inherently lead to slow growth -- can afford a shut down even less.

There is only one conclusion: the Republican rump wants to cause a recession.

Oil Is Still At Elevated Levels


For the last several months, oil has been trading between the 102/104 and 108 level.  Over the last few trading sessions prices have moved below the 102 level, trending to just above 101.  However, prices rebounded strongly yesterday on solid volume.

Interestingly enough, this has not translated into higher prices at the pump:


Wednesday, October 2, 2013

An important announcement from Bonddad and New Deal democrat

Although I'm not a fan of the Grateful Dead, I have to admit the phrase, "what a long strange trip it's been" has been running through my head as I ponder recent developments.

I started blogging at the end of 2004 on Daily Kos under the name Bonddad.  Before I was a lawyer, I was a bond broker where I bought and sold bonds to money managers, insurance companies and banks.  This is where my internet name comes from -- a "bond dad" is (or maybe was) a Wall Street term for a very successful bond broker (completely as an aside; I went to law school with another guy who was a broker.  We were on law review together.  When we first met as a group, we exchanged emails and after finding out that I was bonddad@.... he said, "so you're the one who took that name!").  Within what I guess was a year or so, I was making it to the Rec list, where my internet prominence grew (although I was hardly a household name).   I wrote pretty exclusively about the economy on that website for 6-7 years.  I left that blog largely because the level of discourse -- especially in the area of economics -- had devolved to the point of lunacy.  While I wrote for the Huffington Post for a few years, I stopped writing there for the same reason. 

I started this blog on December 6, 2006.  Here's a link to the very first post, where I wrote:

Last week there was a deluge of data hitting the street. This week we have far fewer items. Productivity, factory orders and non-ISM numbers are on Tuesday. Weekly jobless claims come on Thursday. Last week we say a big increase in construction related losses. We'll have to see if that trend continues this week. Most people will probably be waiting for Friday's employment report to see where the economy stands. 

What a deep statement that was....

Oddly enough, my mother died within a few months of starting this blog and frankly, the daily discipline of writing about the economy really helped to get me through that time.

NDD and I "met" on Daily Kos sometime over the last 6-7 years.  We wrote a series of posts together.  I think our first really big collaboration was a series of 4 articles on the Great Depression that were also posted on the Huffington Post.  I frankly forget when NDD started writing here but it's been at least a few years and he's been a welcome addition to the blog.

If I was going to describe the difference between our basic approaches, I'd say that he is more of a true economist while I am still a trader at heart.  NDD looks at the fundamental trends in the economy without analyzing how that effects potential trades while I'm looking for actionable information to make money.  And because of that basic difference, I think we provide some of the best overall "real" economic data on the net.  It certainly isn't for everyone; in fact, our overall readership has remained between 800-1000/day for the duration of the blog's life.  But when I look back at our level of success -- that is, our overall correct calls for the economy and the markets -- we've been right more than wrong.
 
About a year ago, I received a communication from the website XE.com who wanted to add economic commentary to their website.  We exchanged a few emails about the possibility, but the negotiations slowed at the beginning of the year.  Over the last few months they picked up again culminating in our signing contracts with them to provide content.  And the best part is we're finally getting paid!  On top of that, they have over 14 million hits per month on their website, so our visibility will increase. And we'll eventually be doing podcasts.  I'll be doing one/week that focuses on international developments while NDD and I will be doing a bi-weekly podcast on the US economy.

So, what's going to change from my end?  My international postings will go to XE for obvious reasons -- they're a currency website, after all.  I'll also be posting shorter pieces mostly on important economic data releases.   My US stuff will probably stay here.  I'm also going to be posting more charts here, focusing on general market trends.

For those of you who have been with us since whenever, I want to encourage you to make the jump with us over to the new site.  None of the content will change; it will just be posted in a different place.  And from our perspective, we'll be making money (finally!) from the deal along with gaining a wider audience -- and an audience who would find our analysis useful.

----

New Deal democrat here: I would like all of our readers to take to heart two things. First of all, I hope you'll be happy for us. For my part, what this means is that I'm going to get paid for doing something that I love to do anyway, and I've been doing for free for eight years. Secondly, it's not going to change the type of material I post, let alone its content, by one iota. In fact, the site explicitly wants us to continue to post the same nerdy analysis we've both been doing here. And, after serious consideration, I've decided that I'm keeping the nom de blog "New Deal democrat." If some commenter over there doesn't like it, too bad for them (although the site is internationally focused, so I expect a lower proportion of RW nutjobs than on, e.g., Business Insider). So if you are a reader that started with us way back in the Daily Kos days, i very much would like you to follow us over and feel free to comment - and don't freak out that it is a Canadian-based currency trading site, Eh?

One of our concerns was that you, our established readers, wouldn't be shut out of reading our material. And you won't. You won't even need to register to read our posts. If you want to comment, you'll need to register, that's all. There's good news there as well. The comment system at XE.com is much more thread-friendly than Blogger's.

And just to be sure you're aware of what we post, I'm going to be posting links here so that you can click right over from the Bonddad Blog to the post on XE.

Further, every couple of weeks you'll be able to hear the dulcet tones of my midwestern voice, because we are doing podcasts as well. If you thought I was sarcastic in print, you ain't heard nothin' yet!

Plus, we aren't obligated to post all of our material at XE. So we'll continue to post here as well, although obviously the volume will go down.

It's been quite a journey. We both now join a pretty select group of bloggers, who have been able to leverage their talent into paying gigs - mind you, not that either of us can retire on this! But can my dream of becoming the new Mark Haines (the colorful, take no BS part, not the congestive heart failure part) of economic videojournalism be in reach? MSNBC, CNBC, and Bloomberg, call me maybe! ;-)

Tuesday, October 1, 2013

Consumer prices likely up 0.1% in September, YoY up only 1.1%


- by New Deal democrat

For the last few months I have been using the change in the price of a gallon of gas to forecast that month's CPI in advance. My point has been, that all you really need to know about inflation is the price of gasoline. So far each prediction has turned out to be within 0.1% of the actual number.

Yesterday the E.I.A. reported for the final week of September, so we can estimate the inflation rate now. My method is to take the change in the price of a gallon of gas and divide by ten, then add 0.1% to 0.2% to account for core inflation, or else divide by 16 to be more conservative, to arrive at the non-seasonally adjusted inflation rate.

In August the average price of a gallon of gas was $3.57.4 This month it was $3.53.2. That is a -1.2% decline. Dividing by 10 gives us -0.12%, and adding 0.1% to 0.2% gives us -0.02% to +0.08%. Dividing by 16 gives us a -0.08% decline, and adding 0.1% to 0.2% gives us +0.02 to +0.12%.

The seasonal adjustment for September last year was +0.07%. This gives us a final seasonally adjusted inflation rate that rounds to +0.1% +/-0.1%.

That will replace last September's +0.5% inflation rate, so that the YoY inflation rate will be +1.1%, 0.1% above the lowest YoY inflation rate for the last 50 years outside of the great recession. This inflation rate is also subdued enough to suggest that real YoY wages have probably increased again in September, and may be closing in on their all-time high set in 2010.

Abe's Policies Are Starting to Have a Positive Impact

It was about this time last year when Abe's policies began to have an impact on investor's expectations for the Japanese economy.  As such, it makes sense to look at some of Japan's macro data to get a feel for  the programs success or failure.  Let's start with a look at GDP:


This is where we see the strongest and most positive impact.  In 1Q13 annual GDP printed at a 3.8% rate and in 2Q13 GDP printed at a 2.6% rate.  Private consumption rose .5% in both of those quarters -- which is an incredibly important development for the following reason: deflation is at the root of Japan's problems.  In a deflationary environment, consumers delay purchases as they think that prices tomorrow will be cheaper than prices today.  This obviously slows overall growth, especially in a first world economy where consumer spending accounts for over 70% of the economy. Part of Abe's plan is for the Bank of Japan to double the monetary base in a short period of time, creating inflationary expectations.  The central purpose of this is to get consumers to change their inflationary expectations from deflationary to inflationary.  This means that consumers think prices will increase tomorrow, so they make more purchases today at what they think will be cheaper prices.  The above results indicate that Abe's policies are having the desired impact at the consumer level.

In addition, Abe wanted to devalue the yen on increase exports.  Here's a chart of the yen for the during of the post Great Recession price performance:


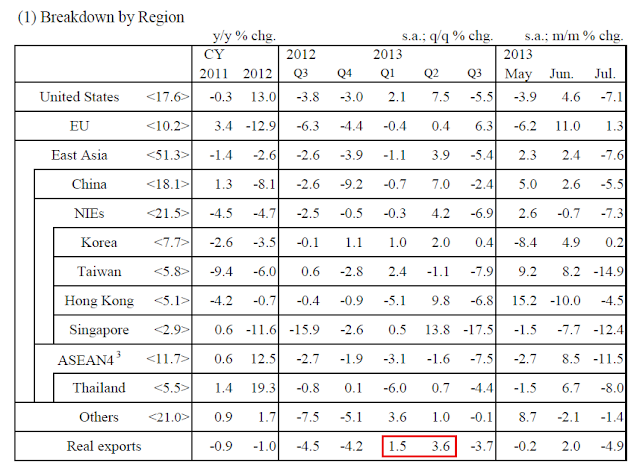
Despite having a very weak economy, the yen rose post recession because investors viewed the currency as a safe haven.  At the same time, this increase in the yen's overall value hurt Japanese exports.  At the end of last year, we see a large decrease in the yen's overall value along with a price consolidation over the last two quarters.  This decrease in value has had a positive impact on Japanese exports:


In the first and second quarter we see an increase in real exports of 1.5% and 3.6%.  While the 3 quarter number does show a decrease, it's only one month of data.

Monday, September 30, 2013

ECRI recession call: unhappy two year anniversary


- by New Deal democrat

Today exactly two full years have passed since Lakshman Achuthan of ECRI appeared on all of the cable business channels and announced that the US was "tipping into recession." Here he is on WSJ:


At the 30 second mark, one of the hosts asks, "When?" and Achuthan responds "Now."

At the 50 second mark, he gets more specific: "It might have started last month. It might start next month. But sometime I think it's going to wind up in the 3rd or 4th quarter" -- of 2011!

Subsequently Achuthan repeated his call, revising the timing to Q4 of 2011 through Q2 of 2012. Although Bloomberg no longer has the video on its site, here is a link to a copy in which Achuthan specifically says, at the 1:20 mark, "If there's no recession in Q4 or in the first half I'd say of 2012, then we're wrong. You're not going to know whether or not we're wrong until a year from now." That would have been 9 months ago, in December 2012.

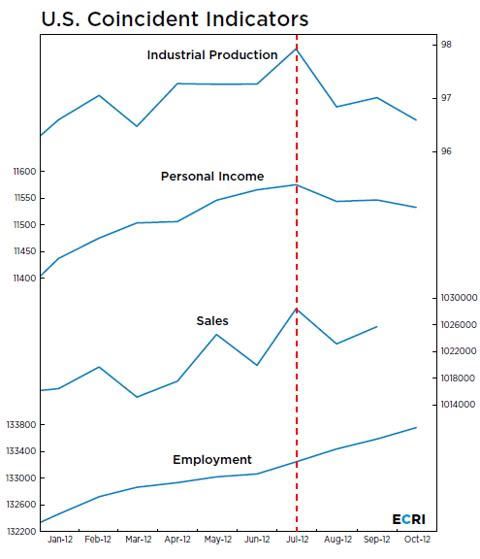
Subsequently ECRI revised its call again, saying that a recession started in July 2012. In December of last year, to justify this latest call, ECRI premiered what they called their tell-tale chart, opining:
Reviewing the indicators used to officially decide U.S. recession dates, it looks like the recession began around July 2012. This is because, in retrospect, three of those four coincident indicators – the broad measures of production, income, employment and sales – saw their high points in July (vertical red line in chart), with only employment still rising.
Here's the chart:


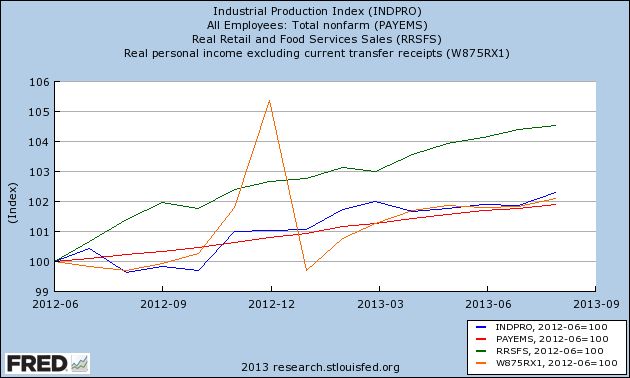
That chart too has vanished down the memory hole, but here's what it looks like updated through August 2013:

Photobucket Pictures, Images and Photos

Since that time, ECRI has reeled like a punch-drunk boxer from data series to data series to data series, latching on to whichever one has in the past been consistent with a recession. Last week Achuthan was reduced to tweeting about how industrial production stayed positive for 5 months into the 1974 recession (which is one-third of the amount of time that has passed since July 2012. And don't mention to him that payrolls have never risen this far or this long since the onset of a recession). The simple fact is, barring massive downward revisions of all sorts of economic data, ECRI's call was wrong.

I've been leaving ECRI alone for about 6 months now, but it's worth noting this anniversary because by now we are long past the time when their call might be redeemed. But it is also sad that they can't simply admit it, publish as much as they can consistent with their proprietary data about what they have learned from this call, and move on. Let's face it, when someone makes a (hilarious) Hitler "Downfall" parody of your predicament:


it's over.

Even sadder is that I totally respect - and try to emulate - the quantitative and sequential long leading/short leading/coincident/lagging indicator approach they inherited from their founder, Prof. Geoffrey Moore. In 2011, they made the human error of reading the temporary air-pocket caused by the debt ceiling debacle as something more lasting.

Perhaps saddest of all, out there somewhere, maybe far and maybe near, is the onset of the next recession. By continually defending their 2011/2012 call, they will also miss that next recession's real starting date when it happens as well. My plea is that they at least consider a "recession 2.0" watch. That watch would be premised on the idea that, even if their existing call is wrong, the new data when it occurs will justify a recession call totally independnent of their pre-existing 2011 recession call.

Until ECRI does that, it is an unhappy two year anniversary.

P.S.: At the 1 minute mark of the December 2011 video, Bloomberg host Tom Keene says, "Amateurs look at the timing of the call. ... The pros looks at the vector, or direction, of the call." In the July 2012 video, at the 0:25 mark, Keene says "You nailed the vector." ECRI came nowhere even close to nailing the timing or the vector of the economy, and Keene, who was cheerleading the ECRI call, owes his viewers an apology.

Market/Economic Analysis: US

Last week, we received a broad swath of information on the US economy, starting with the third and final GDP statement for 2Q13.  According to the BEA:

Real gross domestic product -- the output of goods and services produced by labor and property located in the United States -- increased at an annual rate of 2.5 percent in the second quarter of 2013 (that is, from the first quarter to the second quarter), according to the "third" estimate released by the Bureau of Economic Analysis. In the first quarter, real GDP increased 1.1 percent.
.....
The increase in real GDP in the second quarter primarily reflected positive contributions from personal consumption expenditures (PCE), exports, nonresidential fixed investment, private inventory investment, and residential fixed investment that were partly offset by a negative contribution from federal government spending. Imports, which are a subtraction in the calculation of GDP, increased.

There was a relatively broad amount of improving data -- PCEs, business investment and exports all contributed to the increase.  As has been typical of the last four quarters, federal government spending contractions were responsible for the negative contributions.  Overall, it was a fair report with the primary problem being the lack of +3% top line growth.

We also learned that personal income increased as well:

Personal income increased $57.2 billion, or 0.4 percent, and disposable personal income (DPI) increased $56.2 billion, or 0.5 percent, in August, according to the Bureau of Economic Analysis. Personal consumption expenditures (PCE) increased $34.5 billion, or 0.3 percent. In July, personal income increased $21.2 billion, or 0.2 percent, DPI increased $32.7 billion, or 0.3 percent, and PCE increased $18.3 billion, or 0.2 percent, based on revised estimates. 

Real disposable personal income increased 0.3 percent in August, compared with an increase of 0.2 percent in July. Real PCE increased 0.2 percent, compared with an increase of 0.1 percent.

Real DPI has increased at modest rates over the last few months, another encouraging sign.

The Chicago Fed National Activity Index (FCNAI) "increased" from -.18 to -.14, indicating the US economy is expanding below its potential.  The index has been printing negative numbers for the last six months.

We had four manufacturing related numbers come out last week.  First, Markit's US number printed at 52.8, down from 53.1.  While output and new orders were both positive, new export orders came in below a reading of 50,  indicating a contraction.  This is only one month of data however, meaning we should keep an eye on it for the time being.  The Richmond Fed's manufacturing index dropped to 0, while the internal readings for new orders and production also fell sharply.  The Kansas City Fed manufacturing survey came in at 2, which compares to readings of 8 for August and 6 for July.  Finally, new orders for durable goods increased .1% last month.  Looking at the number ex-transports, we see increases of .1, -.5 and -.1 for the last three months, which indicate some weakness. 

We also had two data points from the housing market.  First, the Census Bureau reported that:

Sales of new single-family houses in August 2013 were at a seasonally adjusted annual rate of 421,000, according to estimates released jointly today by the U.S. Census Bureau and the Department of Housing and Urban Development. This is 7.9 percent (±14.6%)* above the revised July rate of 390,000 and is 12.6 percent (±15.3%)* above the August 2012 estimate of 374,000.

Secondly, the Case Shiller home price index reported the 20 city average of home prices increased 1.84% M/M and 12.29% for the last 12 months.

Conclusion: at the macro level, the US economy is still growing and generating income growth, although at weak levels.  However, these levels are consistent with numbers we've been seeing for the duration of this recovery.  Manufacturing is still expanding, although some of the numbers from the regional surveys indicate some short-term weakness.  Housing continues to improve and, most importantly, consumers seem to be getting used to the higher interest rates on loans.

Let's turn our attention to the markets:


The 60 minute SPY chart shows that last week's price action was simply a sell-off from the rally that lasted from the end of August through mid-September.  Momentum is weak and there isn't much volume flow into the market.


The 30 minute chart shows the heavy technical damage was done at the end of the week of September 10-23; last week's price action was really more of a gentle move lower.


Remember that on the daily chart, we have two somewhat bearish trends in play.  The first is a weakening of momentum; note the decrease in the MACD's highs over the last 3-4 months.  Second, the price arc is moving a bit more sideways now rather than printing an increase.


There are two technical events occurring in the long end of the treasury market.  The first was the sell-off caused by the Fed's taper announcement.  Here we see prices drop from 123 to 101 (a drop of about 18%) which included a move through the technically important 113 and 105-106 level.  Since then prices have "rallied" and are looking for a natural upside resistance point.  But remember that this is a technical bounce, nothing more.

Sunday, September 29, 2013

'Breaking Bad' finale predictions


- by New Deal democrat

Because I did so well a few weeks ago ( < /snark> ), here are my predications for tonight's finale of 'Breaking Bad:'

1. Walt will die (okay, that sounds pretty easy). I saw a post where "Felina" was the name of a girl in a song. The boy returns to El Paso for her and is killed in a hail of gunfire. So that's my guess for Walt's demise.

2. Walt himself is the one who writes "Heisenberg" on the wall of his house. It's his final way of saying "Remember my Name."

3. We, and Flynn, will find out that he is the reason Walt left Gray Matter. Why did Walt Jr. have to have cerebral palsy, for purposes of the plot line? Because his medical bills are why Walt Sr. accepted the stock buyout way back when. It also fits with his oft-stated line that everything he has ever done, he has done for his family.

4. Somehow Walt's true crucial role in Gray Matter will be recognized publicly. This may involve the poisoning of Walt's former partners.

5. Flynn/Walt Jr. will die. I envision his death will be sudden, wanton, and done for almost trivial purposes, like the killing of the college kid on the couch at the begining of "Pulp Fiction." It will probably be done right in front of Walt Sr. and possibly Skyler. It will be the final, biggest punch in the gut to Walt Sr. and to the audience. The ultimate price will be paid, by the one main character who has remained purely good throughout the series. And as I said last time, there is an innocent dead boy in the desert who must be atoned for. I am guessing the same person will be the triggerman.

6. Todd will get the ricin after shooting Flynn. Walt will con him into smoking the cigarette after Flynn is murdered.

7. Marie will survive and will raise Holly.

8. I don't know what will happen with Skyler, but she will not be alive and scot free at the end of the episode.

9. Finally, Jesse Pinkman will also survive. He is the one character who, against all others, has "broken good." Interestingly, the only evidence of his guilt -- his confession -- is not known to anybody still alive in law enforcement. Should his confession tape be destroyed, there is no real evidence against him. And although he too has done many bad things in the past, there is a morally fair way for him to walk free: the government needs him as a witness against everybody else involved in the entire two year long set of conspiracies, and he gets blanket immunity in return. The final shot of the series is Jesse, with Brock, driving off to Alaska.

Leave comments here

I've turned comments back on, but it doesn't work for pieces already posted.

So if you have a comment about the new blog style, or my "Thought for Sunday," leave it here.

A thought for Sunday: an undemocratically elected minority of anarchists


- by New Deal democrat

An old cynical political saw says that, "in a democracy, people get the government they deserve." As it appears more and more likely not just that the government will shut down, but the United States will actually default on paying its debt obligations, it is worth recognizing that in this case, the old saw is wrong. In this case, a majority of voters cast their votes against the party that has vowed to shoot hostages if it does not get its way.

Simply put, we do not have a representative Congress. An extremist minority has erected barriers against actual majority representation. The elections of 2010 through 2012 have shown that electing a GOP majority at the state level is the last fair election that a state will have. This extremist party will redistrict - even in mid-decade - to ensure that it will retain control of the state legislature, and House Congressional districts representing that state, even if a solid majority of the population of that state votes against them in future elections.

That means that the Congress which is about to close down the federal government - which will cost billions of dollars by itself; the Congress which appears ready to default on payment of debts it already contracted for; is not a representative democratic body. It is a fundamentally unrepresentative body of a determined anti-democratic minority. It is and ought to be universally understoods as anathema.

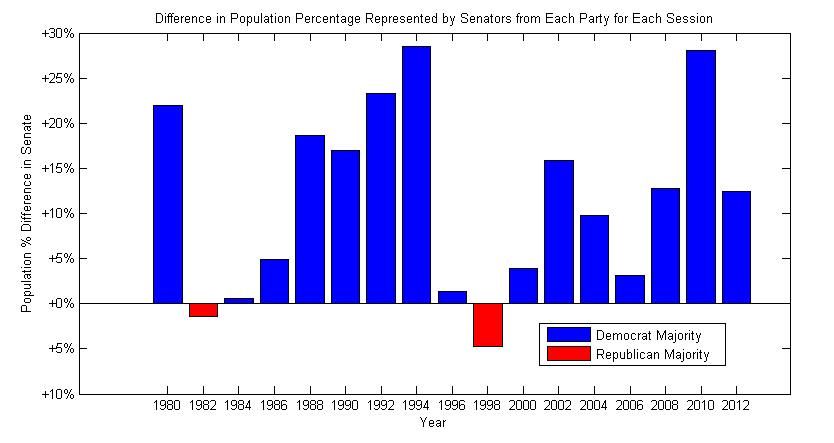
Let's start with the Senate. According to the blog Matlab Geeks, a higher percentage of the US population has been represented by democratic Senators in all but two elections since 1980:

Photobucket Pictures, Images and Photos

As of 2012, 55% of the US population was representated by democratic Senators. Only 45% was represented by GOP Senators.

But because of the filibuster, that 55% consistently has its will thwarted. As set forth by Middle Class Political Economist:
Under the Senate's filibuster rules, 41 Senators can block debate on Senate bills and nomination confirmations.... [So] what percentage of the 50-state population is represented by the 41 Republican Senators from the least populous states. The answer takes the actual population of states with any Republican Senators, except Texas (Cornyn and Hutchison), Florida (Rubio), Illinois (Kirk), Pennsylvania (Toomey), and Ohio (Portman).  The population of the states represented by the other 41 Republican Senators is 104.7 million, or 34.0% of the population of the 50 states.
(emphasis mine)

Although the filibuster has become an inexcusable anti-democratic tool, at least it can be said that by design the Senate was erected as a federalist check on the direct popular will.

No such excuse can be made as to the House of Representatives.

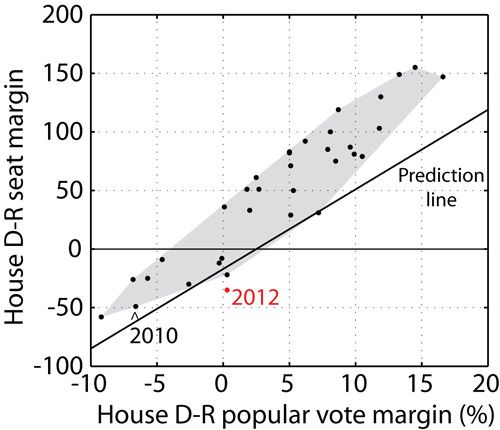
Because of gerrymandering, the House also has become perversely unrepresentative of the US population. The democratic party in this Congress has 35 fewer seats than the GOP, even though the democratic party won an outright national majority of the the House vote. Here's how unrepresentative the House vote in 2012 was, as shown in a graph prepared by Princeton Neuroscience Professor Sam Wang:

Photobucket Pictures, Images and Photos

Just how undemocratic is the representation in the House of Representatives? Based on his calculations, Wang concluded:
Based on how far the red data point is from the black prediction line, the “structural unfairness” may be higher – as much as 5% of the popular vote. That is incredible. Clearly nonpartisan redistricting reform would be in our democracy’s best interests.
So it cannot be said in any fair sense that the Congressional hostage-takers are at least representing the will of the people. They are not. In the Legislative Branch of government, the US is no longer a representative democracy. It is under the control of an unrepresentative, undemocratically elected minority of willful extremists. That is why the US is on the brink of a fiscal crisis.