Friday, December 22, 2023

Completing the housing market picture for November, sales decline bigly, and prices remain down YoY


  - by New Deal democrat

Our final important pre-year end release was also the final item of housing data for the month, new home sales.


To reiterate, the value of this metric is that it is the most leading of all housing metrics. Its big drawback is that it is very noisy and heavily revised.

In November, new single family home sales (blue in the graphs below) declined -82,000 annualized, or -12.2% month over month. This is in stark contrast to the much less noisy single family permits (red), which rose 0.8% to an 18 month high (note: permits *75 for scale in the graphs below):


Note that sales tend to lead permits by a month or two. Over the long run they have moved almost in unison:


Because interest rates (gold below, inverted) lead both sales and permits, below I show all 3 YoY:


Earlier this week I noted the anomaly of permits increasing so much YoY in the face of higher interest rates. Today’s decline in sales (if not revised away next month) suggests that single family permits are going to roll over, at least temporarily, in the next few months.

Meanwhile the median price of a new home (not seasonally adjusted) rose 19,800 in the month, but prices remain significantly below their 2022 levels:


Since prices lag sales, shown on a YoY basis to deal with the seasonality, prices are down -6.0%:


This was anticipated given the decline in sales throughout 2022.

The housing market is still in the process of digesting the higher mortgage rates that prevailed all this year until November. It is no surprise that in general mortgage applications, sales, total permits, and starts remain depressed compared with levels of several years ago before the Fed started raising rates. The contrary indicator has been, as I wrote earlier this week, that the total number of housing units under construction is still levitating at near record levels.

A holly jolly holiday season for income and spending as well


 - by New Deal democrat

Santa showed up with some more gifts in his bag this morning, in the form of a uniformly positive income and spending report for November.


Nominally income rose 0.4% in November. Nominal spending rose 0.3%. Although prices as measured by the PCE deflator actually declined -0.1% for the month, after rounding both real income and spending remained at the same levels. Since just before the pandemic real incomes are up 6.1%, and spending is up 9.8% (all graphs below normed to 100 as of February 2020 except as otherwise noted):


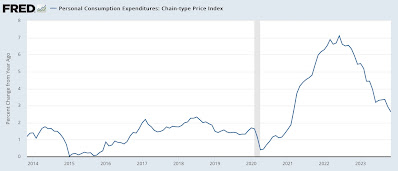
The decline in prices was only the first time since 2017, excluding the pandemic shutdown months of March and April 2020. On a YoY basis, the PCE price index is only up 2.6%, the lowest since February 2021, and almost back to the Fed’s target of 2.0%:


For the past 50+ years, real spending on services has generally increased even during recessions. It is real spending on goods which declines. Last month services spending rose 0.2%, and goods spending rose 0.9%:


As per form, real services spending has risen consistently since the pandemic, while goods spending have been somewhat of a mirror image of gas prices, which peaked in June 2022.

Since real durable goods spending tends to turn before non-durable goods spending, here is what they look like:


The former increased 0.9% for the month, while the latter increased 0.3%. Durable goods spending has been very much affected over the past several years by the shortage of new vehicle inventory, which has largely abated as this year has progressed.

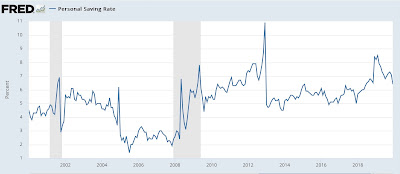
Another important metric for the near future of the economy is the personal savings rate, which increased 0.1% to 4.1%:


As I’ve noted for the past few months, this remains one of the lowest rates of savings ever. For comparison, here is the same metric from 2000 until just before the pandemic, including the lowest rates ever in 2005-07:


So, on the one hand, the 4.1% savings rate indicates consumer confidence. But it also indicates vulnerability to an adverse shock.

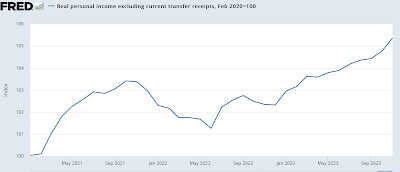
The NBER pays particular attention to several other aspects of this release. Real income excluding government transfers (like the 2020 and 2021 stimulus payments) continued to increase, up 0.6% for the month:


Once again, this has been something of a mirror image of gas prices, rising consistently since June 2022.

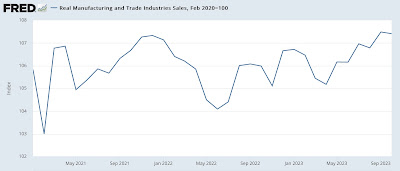
The only fly in the ointment wasn’t with income or spending at all, but rather real manufacturing and trade sales, which make use of the deflator. These declined -0.1% in November, but this does not distrurb the generally increasing trend since June 2022 as well:


This is a consumer economy which is doing very well. Inflation has turned relatively tame, and both incomes and spending are up substantially. As the shock of the big inflation of 2021-22 abates, it is no wonder that several measures of consumer confidence have improved in the past couple of months. For the moment, at least, you could call it a “Goldilocks” economy. A holly jolly holiday season indeed!

Thursday, December 21, 2023

A holly jolly holiday season for initial jobless claims


 - by New Deal democrat

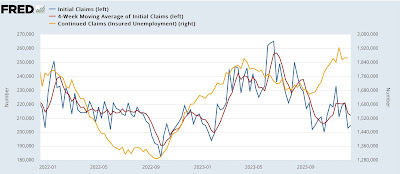
Initial jobless claims rose 2,000 last week to 205,000, while the four week average declined -1,500 to 212,000. With the usual one week delay, continuing claims declined -1,000 to 1.865 million:


No Christmas layoffs to speak of this year!

On the more important for forecasting purposes YoY basis, initial claims are down -3.3%, the four week average up 0.1%, and continuing claims higher by 16.5%:


Needless to say, these forecast continued expansion in the months ahead. There had been some notion that higher continuing claims meant a recession was imminent, but as usual they have followed initial claims lower with a delay. Their current YoY increase is the lowest since the beginning of April.

Finally, our usual comparison with the Sahm Rule, because initial claims lead the unemployment rate, indicates that unemployment is likely to peak this month or in the next several months and then drift back lower towards 3.6% or so:


Good news for the holiday season!

Wednesday, December 20, 2023

Existing home sales try to find a bottom, while severe bifurcation with new home market continues


 - by New Deal democrat

Existing home sales rose 3,000 on a seasonally adjusted annualized basis in November. They are likely in the process of bottoming, as they have been in the range of 3.79 million to 4.10 million for the past five months:


As a reminder, though, on a longer term basis, sales are down to nearly 30 year lows:


As many if not most homeowners remain frozen in place by 3% mortgages, inventory has remained very low, and this means that prices have remained at a premium, currently up 4.0% YoY (note: graph does not include this morning’s data):


YoY price growth has actually been increasing since July, when they were only up 1.7%.

This is in contrast new home sales and prices, where home builders have been aggressive with rebates, down-scaling amenities, and buying down mortgage payments. There sales have rebounded by 1/3rd from their bottom at the beginning of this year towards their 2020 highs, and YoY prices are down -17.6%:


It’s likely that we will start to see a rebalancing from here, as mortgage rates have declined by about 1% in the past month. If existing home sales stop falling and start rising, more inventory will mean more price competition. This in turn will draw some marginal buyers away from new homes (especially new condo units) towards existing homes. But if so we are just at the beginning of that process. For now the market remains severely bifurcated. 

Tuesday, December 19, 2023

Housing under construction continues to levitate


 - by New Deal democrat

Although they aren’t the most leading of housing metrics, because of supply-chain issues during the pandemic, housing units under construction has been the most important one, because they represent the actual economic activity of construction. With the exception of 2001, which was an investment-led downturn, they also have always turned down significantly before a recession has begun. Further, as I wrote there months ago and as shown in the below graph, “multi-family units under construction, which typically turn after single family units, have also usually (except for 2008 and the pandemic) turned down before recessions have begun:”


And this morning’s residential construction report for November showed that housing units under construction *still* have not turned down significantly. In fact, total units under construction (blue in the graph below) rose a seasonally adjusted 11,000, only 25,000 below their October 2022 peak. Almost all of that was due to an increase in single family construction (red), while multi-unit structures under construction (gold) declined 1,000:


This is not recessionary, especially keeping in mind that the manufacturing sector is not as important for forecasting purposes as it was before the China manufacturing shock that began in 2000, so construction has become more important.

The most leading of the construction metrics is permits (blue below), which declined 38,000 for the month, and the least noisy sub-sector is single family permits (red), which rose 7,000 and are 228,000 above their January 2023 low. On the other hand, multi family permits (gold) declined to a new three year low:


The likelihood is that single family permits will flatten or decline slightly in the immediate months ahead, as they typically follow the much more noisy single family home sales (blue below) by several months, and the trend there has turned down:


For completeness’ sake, below are total (blue), single family (red), and multi-unit (gold) housing starts, which are much noisier than permits and tend to lag a month or two behind them:


Starts rose sharply - by 191,000 and are 255,000 above their August lows, driven mainly by the upturn in single family permits. This simply confirms the increase in permits as shown above.

Finally, since housing follows interest rates, here is an update of the YoY change in Treasury interest rates (inverted, blue) vs. the YoY change in single family permits (/10 for scale):


The big increase in permits this year has not been supported by interest rates through November, which continued to be higher (hence suggesting lower activity) than one year ago. This is yet more reason to believe that the recent increase in permits will flatten out or decline in the near future.

To summarize, both interest rates and single family sales indicate that it is unlikely the recent increase in permits and starts will continue. Additionally, the big surge in the past several years in multi-family unit construction is likely to follow permits in turning down. But there is no recessionary import in the present trend.

Monday, December 18, 2023

Have wages “really” increased since before the pandemic?


 - by New Deal democrat

All of the remaining 2023 data - housing sales and construction, and personal income and spending, as well as the Index of Leading Indicators - will be reported this week. After Christmas, only initial claims will be reported next week.


Today there is no significant data. But over the weekend, a little tiff erupted on another site that I read, about whether real wages or earnings had increased since before the pandemic. This caused me to go back into the time capsule to when, about 10 years ago, I used to report quarterly on “four measures of real wages,” and take a look. Below is what I found.

There are a variety of economic data series to track both average and median wages:

Below are all 4, normed to 100 as of Q4 2019, the quarter before the pandemic hit, updated through Q3 of this year:


To cut to the chase, all of them except for the Employment Cost Index for wages, show increases since before the pandemic. Real average hourly earnings through September were up 2.7%, real hourly compensation for workers was up 2.3%, and real usual weekly earnings were up 0.8%. The employment cost index for wages, however, decreased -1.2%.

Normally this would be of some concern, because the employment cost index is designed to measured changes in wages for the same job, i.e., it adjusts for differences in the number of people employed in various sectors. And indeed, when we take out inflation and measure the quarterly *nominal* percent change in each index, only the employment cost index rose during the 2020 shutdowns, indicating that once we take out compositional changes in the labor force, wages continued to rise slightly:


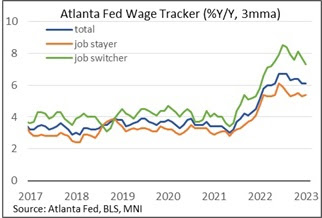
Just as significantly, though, note that the point where the employment cost index did not rise nearly as much as the others was during the 2021 jobs boom. Most likely what has happened is that the E.C.I., because of its composition, did not pick up the difference in wage gains between “job switchers” and “job stayers,” where the former have gotten much bigger wage increases than the latter: 


And with the extremely tight labor market of the last several years, there have been a record number of job switchers, as we know from the monthly voluntary “Quits” data in the JOLTS survey:


OK, but if the labor market is so tight, why haven’t wages grown even more?

To answer that, let’s take a look at the longer term trend in all 4 measures going back to the end of the Great Recession in 2009:


Real wages by all measures declined for several years into the recovery, even though the unemployment rate was decreasing, before picking up and continuing to increase for the rest of the expansion.

The answer to that, in turn, can be found by looking at the YoY% change in the inflation rate (blue in the graph below, right scale) and in particular picking out the change in gas prices (red, left scale):


At the bottom of the Great Recession, gas prices got as low as $1.60/gallon. As the economy began to expand, they rapidly recovered to $4/gallon, giving rise to what I called the “oil choke collar” restraining economic growth. Similarly, after the pandemic, and especially with Russia’s invasion of Ukraine, gas prices, as well as the big 2021 springtime stimulus spending spree, helped drive inflation sharply higher. It took a while for wages to catch up.

So the verdict is: yes, real wages have increased since before the recession. But a necessary part of that increase has been the massive switching of jobs from lower to higher paying positions by workers who, for once, had leverage.