- by New Deal democrat
As we close out 2022, let’s look back at the overall picture for COVID.
The best historical measure of actual infections is Biobot, which samples wastewater. This is because the advent of easy home testing one year ago meant that far fewer people have had “confirmed” cases this year in comparison to “actual” infections. The solid line in the graph below is the level of particles (left scale) from which actual case levels can be inferred (right scale):
Current levels are now higher than any other wave peak except for last winter’s Omicron.
Regionally the Northeast is faring the worst, although its current outbreak is not yet at the level of its first, disastrous, wave. The South is also increasing sharply, while for now the West remains in relatively good shape:
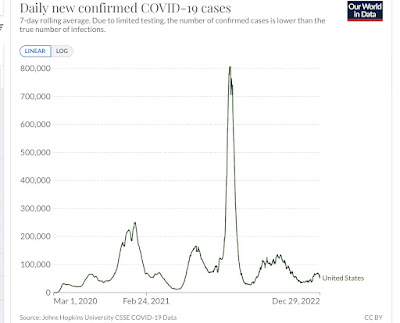
As you can see, this contrasts with “confirmed” cases, which while they have increased, are well below all previous waves:
But hospitalizations and deaths are much more reliable, since cases have always generally been confirmed.
Hospitalizations have increased 50% from their recent lows, but are well below all prior waves of infections at this point:
The same is true of deaths, which since March have varied between 300-500/day, well below their levels at any previous times during the pandemic:
Deaths continue to be concentrated among the unvaccinated or not-fully vaccinated:
And they also skew much higher with age:
Even fully vaccinated seniors should probably remain on guard, and in particular mask up whenever indoors in public places. Altogether, non-fully vaccinated people over age 50 account for nearly 3/4’s of all COVID deaths.
Vaccinations in the US hit a wall this year, only increasing from about 65% to 70% of the population fully vaccinated, and only increasing from 75% to 80% even partially vaccinated during the entire year:
Total deaths from Covid have increased by 100,000 in the past 9 months (i.e., at a 133,000 annual rate), to 1.1 million:
Total *confirmed* cases in the US have just topped 100,000,000, about 20,000,000 of which have been during the last 9 months:
Because *actual* cases were at least double confirmed cases before this year, and at least triple the number of confirmed cases this year after home testing became widely available, probably about 240,000,000 or more Americans (or about 75%+ of the population) have at one point or another been infected.
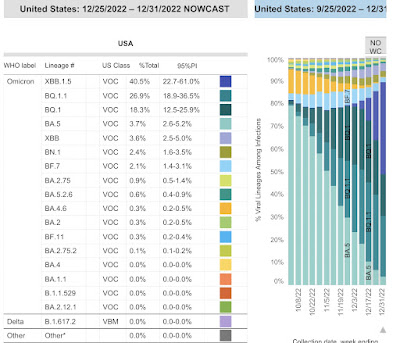
Finally, here is the what the prevalence of the Alphabet soup of newer variants looks like at the moment. XBB and its subvariant XBB.1.5 make up 44% of all cases, BQ.1&1.1 another 45%, with BA.5 down under 4% and the remaining variants in the soup 7%:
The biggest regional outbreaks showed by Biobot correspond with the highest prevalence of variant XBB:
Note that XBB%1.5. Is most prevalent, at 75%, the Northeastern regions, followed by roughly 20% in the Southern regions, and less in the Midwest and West, corresponding almost exactly to the Biobot data referenced at the beginning of this article.
Between previous infections and vaccinations, probably only 5%or less of the population is totally “naive” to the Covid virus, with no resistance whatsoever.
This, along with improved medical care, probably explains why Covid has become much less deadly on a per capita basis this year. It is well on its way to becoming endemic.
The bottom line is, we keep seeing ever more easily transmissible variants, with low hospitalizations and even lower deaths. In the last 9 months, deaths have tranistioned from 500,000/year to 133,000/year. The lion’s share of deaths skew to the under-vaccinated and the elderly. If people over age 50 were all fully up to date in their vaccinations and always masked in indoor public spaces (yes, this means *no* indoor restaurant dining), deaths would probably be down to about 35,000/year or about 100/day, a true flu-like comparison.


