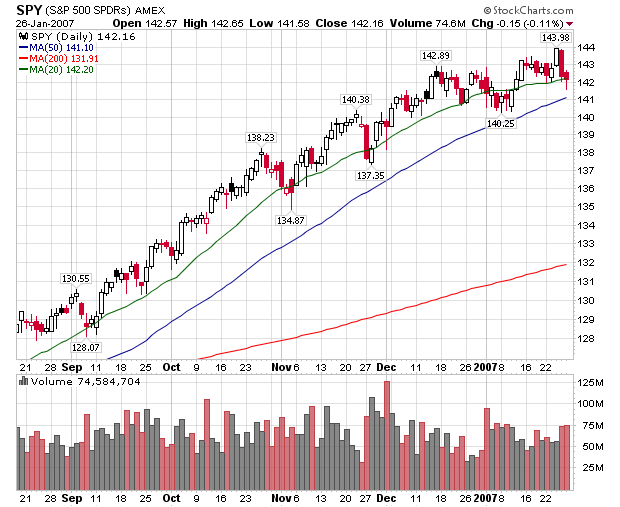
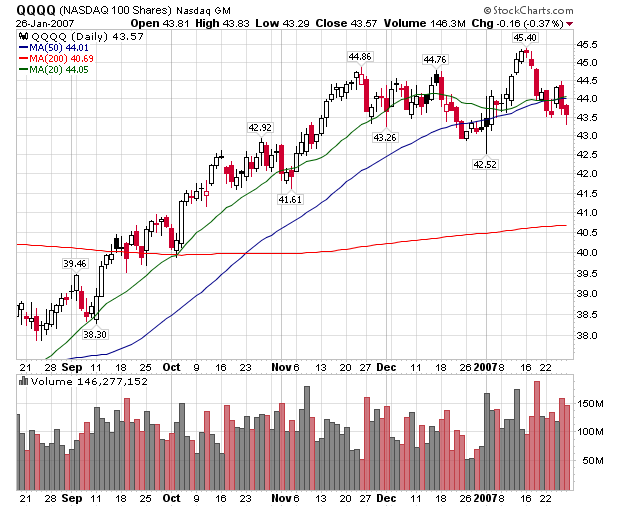
Here's a chart for the S&P and QQQQs, which both say the same thing.


We had two days of gains followed by two days of selling. However, the selling occurred on noticeably higher volume. In addition, the SPYs hit a higher level on Wednesday, then quickly retreated to lower levels -- again on higher volume. The QQQQ's looked like they were going to start moving up, but sold off the earlier in the week levels -- on higher volume. So -- short version is simple: last week there were more sellers than buyers in the market. In addition, market participants sold into the rallies. This is not a sign of confidence.
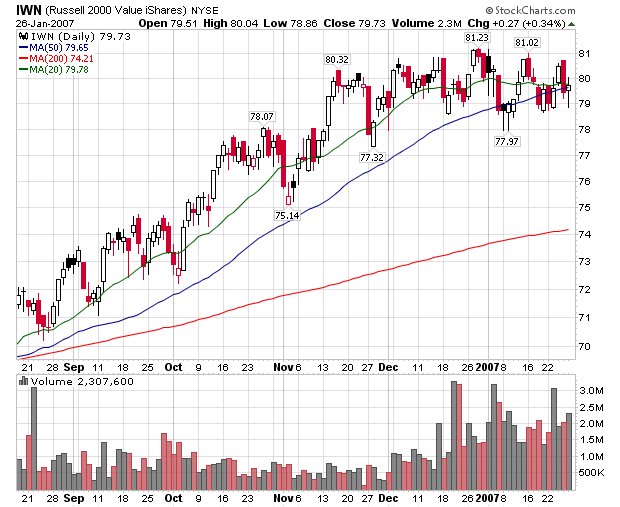
The IWNs were a little different.

This average has been trading in a range since the beginning of December. Last week we say a similar pattern to the SPYs and QQQQs, but the IWNs sold off to about 50% of the Tuesday-Wednesday rally. In addition, it looks like the IWNs may be forming a triangle trading pattern, which usually means consolidation before a move in wither direction.
In summation, traders were concerned about the market last week, with an emphasis on selling rather than buying. Before I speculated that the decreased likelihood of an interest rate cut may be acting as a ceiling on the market. With the numbers from Friday showing strength, that may still be the case.