Friday, October 24, 2008

Weekend Weimar and Beagle

Aren't you glad that week is over? I know I am.

It's that time of the week -- do anything except think about the market. I'll be back on Monday. Or you can catch me tomorrow morning at 9AM CST on KTLK.

Until then....


A Quick Word On the Markets

While the markets opened down in a big way they have been rallying all morning. As of this writing the SPYs are down 3.83%.

The big issue is the last hour or so of trading. If traders are really concerned about any possible bad news that could come out over the weekend, expect heavy volatility and lots of sales.

In addition, there may be some traders who are playing the intra-day gap fade day. That simply means day traders are trading in the opposite direction of the market's open. If that is a big reason why the market is moving higher, then look for possible sales to lock in profits.

More On Employment

First, see Employment numbers getting worse from yesterday. It has very relevant graphs.

From the WSJ:

Spreading layoffs could further exacerbate weakness in consumer spending, the largest driver of U.S. economic growth, and delay any recovery. "A weak labor market makes consumers and businesses even less creditworthy and causes lenders to pull back even further," says Barclay's Mr. Pandl.


While this is pretty basic stuff, it's important to reiterate why job losses are so important. No job = no money = no spending. This is vitally important because consumer spending accounts for 70% of US GDP growth.

Many manufacturers, meanwhile, says they have seen a sudden drop in orders and are quickly moving to cut jobs to avoid building up inventories. Makers of construction machinery, powerboats, appliances and copper pipe are among those shedding workers.


This shouldn't be too surprising. As the world slows down people will by less stuff. Less stuff purchased = less need to make more stuff.

Meanwhile, at the center of the economic crisis, financial companies continue to lay off thousands of workers. Cleveland-based National City Corp. said this week it would eliminate 4,000 jobs, or 14% of its work force. Goldman Sachs Group Inc. is preparing to lay off 10% of its 32,500 employees, according to people familiar with the matter. And Bank of America Corp. is expected to lay off thousands of workers as it completes its acquisition of Merrill Lynch & Co. The financial-services industry has lost 172,000 jobs since December 2006, according to the Labor Department.


The financial industry is in big league turmoil; shedding jobs shouldn't be surprising.

In another ominous sign, UPMC, the big Pittsburgh-based hospital system, said this week it was laying off 500 employees as part of continuing cost-savings initiatives. The layoffs are almost entirely "nonclinical" and are coming from all parts of the hospital network, which employs about 50,000.


Uh-oh. Health care -- a reliable growth for jobs -- is shedding them. That's not good.

Drug makers, which have been paring costs for years, are now broadening the scope to include executives and researchers.

Merck, which has eliminated 10,400 jobs over the past three years, said Wednesday it will cut 7,200 positions, or 12% of its work force, by the end of 2011. The layoffs will touch every part of the company, from sales representatives to researchers, and a quarter will be mid- and senior-level executives. The company is closing labs in Seattle, Japan and Italy.

Chief Executive Richard Clark said the latest cost-cutting wasn't a reaction to the company's 28% decline in third-quarter profit but part of longstanding efforts to reposition Merck for a new era.


The drug makers are cutting -- that's also not good. It indicates there are concerns every where right now.

In a sign of weakness in the consumer economy, Coca-Cola Enterprises, the world's largest soft-drink bottler, said on Thursday it has laid off more than 1,000 people, primarily from management ranks, in its North American operations since Labor Day. The bottler has been struggling to revive soft-drink sales in the U.S.


Not good at all.

Forex Friday

Wow -- the dollar is in the middle of a really strong rally now. This is largely because -- despite all of our problems -- the dollar is still seen as a calm port in the storm.


On the weekly chart, notice the following:

-- All the SMAs are moving higher

-- The shorter SMAs are above the longer SMAs

-- Prices are above all the SMAs

-- Prices have continually moved through previously established resistance levels

-- Prices are using the SMAs as technical support

Bottom line: this is a bullish chart


On the daily chart, notice the following:

-- All the SMAs are moving higher

-- The shorter SMAs are above the longer SMAs

-- Prices are above all the SMAs

-- Prices have continually moved through previously established levels of resistance

Bottom line: this is a bullish chart.

Thursday, October 23, 2008

Today's Markets

Photobucket

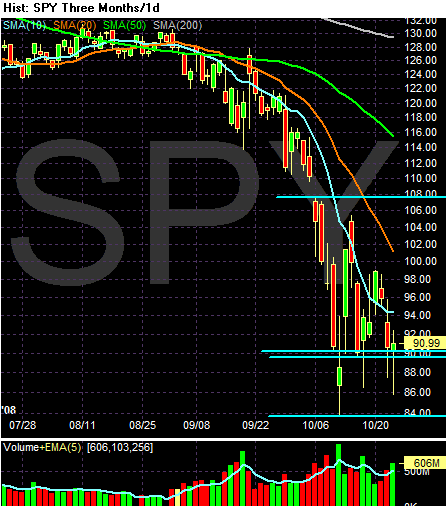
Remember -- I'm looking for a broad consolidation range on the SPYs between 90 and 108. While the action today was wild (there was a roughly 6 point swing on the SPYs), we closed at 90.99 one point above my preferred low. However, it's also important to remember that the chart is still very bearish. Prices are below all the SMAs and the shorter SMAs are below the longer SMAs.

BUT

The 10 day SMA went neutral today, which is something.

Employment Numbers Getting Worse

From the Washington Post:

In September, there were more mass layoffs -- instances in which employers slashed 50 or more jobs at one time -- than in any month since September 2001, the Labor Department said yesterday. And nearly half a million Americans have filed new claims for unemployment benefits in each of the past four weeks, the highest rate of such claims since just after the terrorist attacks seven years ago.

Anecdotal reports suggest that the hemorrhaging in the job market has only begun. Companies that announced plans this week to cut jobs include Internet company Yahoo (1,500 positions), pharmaceutical company Merck (7,200), National City bank (4,000) and Comcast, the cable company (300).

.....

Villella and others who work with employers said that for many companies, the pullback in hiring is not a direct result of tightening credit. Rather, firms simply don't know whether their own customers will be affected by the financial crisis; as a result, they want to hold their breath and delay hiring decisions until they have a better sense of the future.

The nation has shed jobs every month this year, but at a slower overall pace than in past economic downturns. The slide accelerated in late summer, with declines similar to those in past recessions. Last month, employers shed 159,000 jobs, the most this year and more than the average number of monthly job losses in the terrible labor markets of 2001 and 2002.

More obscure indicators monitored by economists at the Federal Reserve and in the private sector also show an inflection point in late summer. For example, employers had 214,000 fewer job openings in August than in July, according to a Labor Department report. Over the past year, the number of openings dropped by a more modest average of 74,000 per month.

Indeed, many companies are imposing hiring freezes. Such moves don't often get the kind of headlines that layoffs do, but because they shrink the number of places people can turn to for jobs, they still hurt the economy.
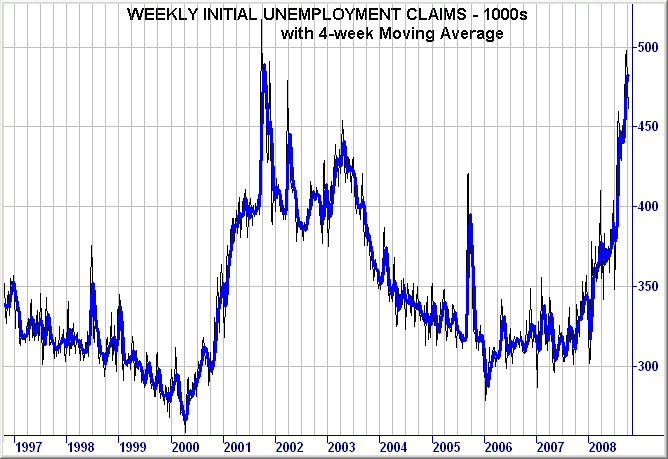
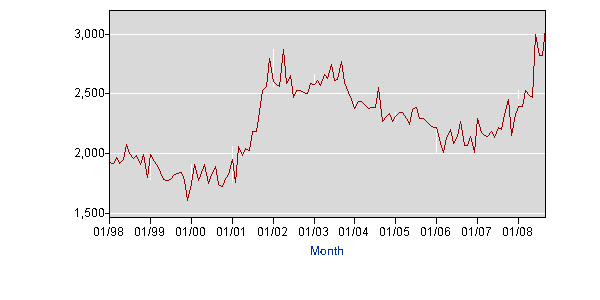
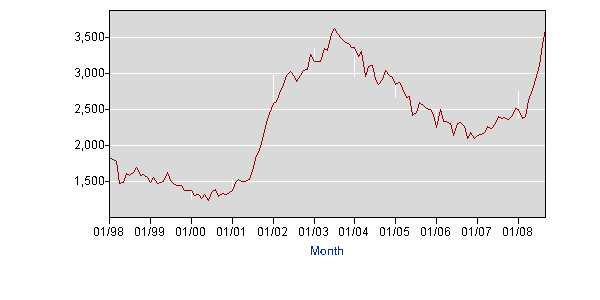
Let's look at the data. First we have unemployment claims from Martin Capital:

Photobucket

Notice we're at the same level as the 2001 recession.

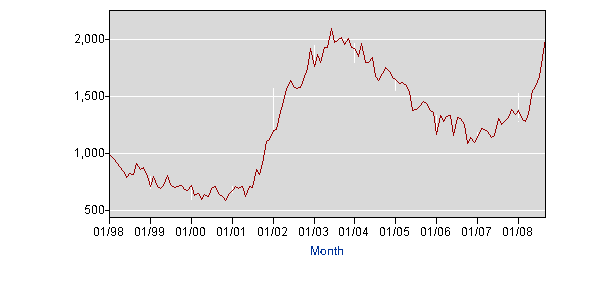
Number of people unemployed for 5-14 weeks

Photobucket

Number of people unemployed for 15+ weeks

Photobucket

Number of people unemployed for 27+ weeks:

Photobucket

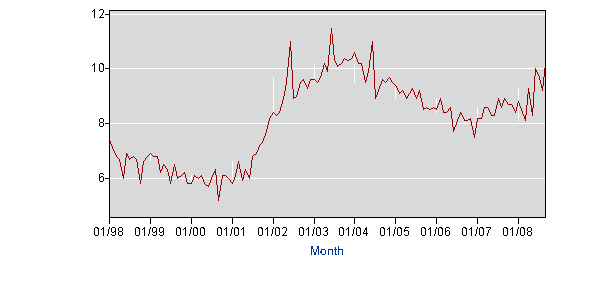
Median weeks unemployed:

Photobucket

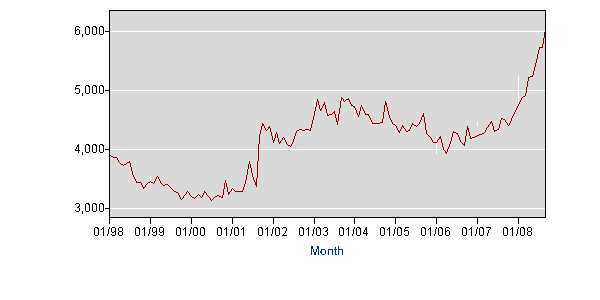
Number of people working part-time for economic reasons:

Photobucket

Notice that all of these measures of unemployment are ticking up. That's not good.

Hat tip to Blah3 for the weeks unemployed idea.

Greenspan Admits Deregulation Didn't Work

From Bloomberg:

In May 2005 speech, Greenspan said that ``private regulation generally has proved far better at constraining excessive risk-taking than has government regulation.''

.....

Greenspan opposed increasing financial supervision as Fed chairman from August 1987 to January 2006. Policy makers are now struggling to contain a financial crisis marked by record foreclosures, falling asset prices and almost $660 billion in writedowns and losses tied to U.S. subprime mortgages.

Today, the former chairman asked: ``What went wrong with global economic policies that had worked so effectively for nearly four decades?''

Greenspan reiterated his ``shocked disbelief'' that financial companies failed to execute sufficient ``surveillance'' on their trading counterparties to prevent surging losses. The ``breakdown'' was clearest in the market where securities firms packaged home mortgages into debt sold on to other investors, he said.


Who would have guessed this would happen. I'm a big fan of admitting when you're wrong. Alan did. Good.

So Much for De-Coupling....

From Bloomberg:

Developing nations' borrowing costs jumped to the highest in six years as Belarus joined governments seeking a bailout from the International Monetary Fund to help weather the credit crisis and slump in commodities.

The extra yield investors demand to own emerging-market government bonds instead of U.S. Treasuries rose 25 basis points to 8.27 percentage points, the most since November 2002, according to JPMorgan Chase & Co.'s EMBI+ index. The annual cost to protect Russia's bonds from default soared 1.3 percentage points to 10.8 percent of the debt insured, the highest in at least eight years, according to CMA Datavision.

``There is now no safe haven globally other than a deeply indebted U.S. government,'' said Jim Reid, head of fundamental credit strategy at Deutsche Bank AG in London. ``The events of the last few days are categorical evidence of the globalization of the credit crunch and its subsequent problems.''

Ex-Soviet Belarus followed Iceland, Pakistan, Hungary and Ukraine in requesting emergency loans as the global financial crisis limits its ability to borrow, the IMF said yesterday. Argentina's lawmakers are attempting to stop President Cristina Fernandez de Kirchner seizing pension funds from money managers, as the country risks defaulting for the second time this decade.

Emerging-market stocks, bonds and currencies are getting battered as the financial crisis that began with U.S. mortgages last year pushes the global economy toward a recession, crimping the demand for the commodities that sustain most developing nations' finances. The IMF forecast global growth will slow to 3 percent in 2009, from 3.9 percent this year, signaling a global recession.
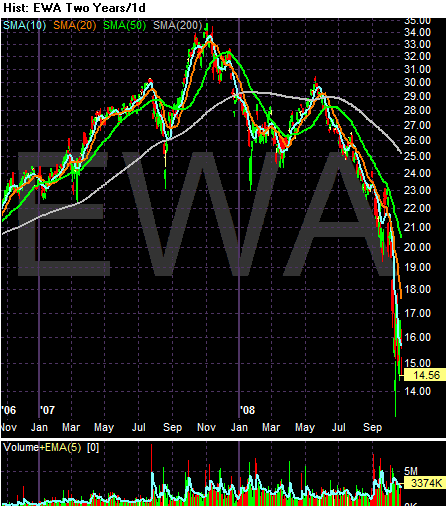
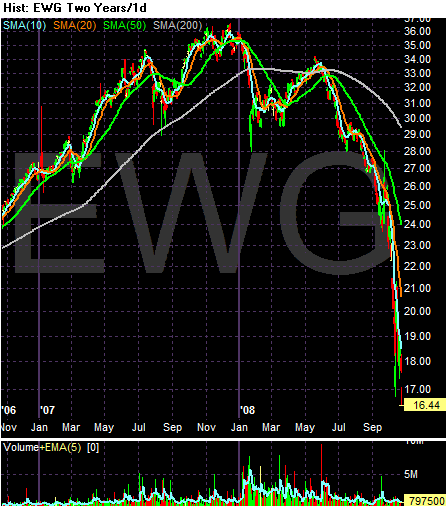
If memory serves, the general arguments against a protracted and deep financial crisis went something like this.

1.) There is no housing bubble

2.) The housing bubble exists, but only in a few markets

3.) There is a housing bubble, but housing only represents 5% of the economy

4.) Only the US' housing bubble is a problem

I may be missing a few steps and/or arguments along the way, but you get the idea. For the last few years the arguments of people who tried to downplay what was going on in the economy have been laughable. I had an email conversation with a colleague a bit ago and we were talking about all of the great rationalizations used to defend the poor fundamentals of the latest expansion. She commented, "whatever happened to dark matter?" -- the theory that the US trade deficit didn't matter because of this substance called "dark matter". It was a ludicrous argument yet people bought into it hook line and sinker.These are people who literally have no idea about the depth of the interconnectedness of the economy. Simply put, things do not happen in isolation. It's a classic case of "when a butterfly flaps his wings in China it effects Washington."

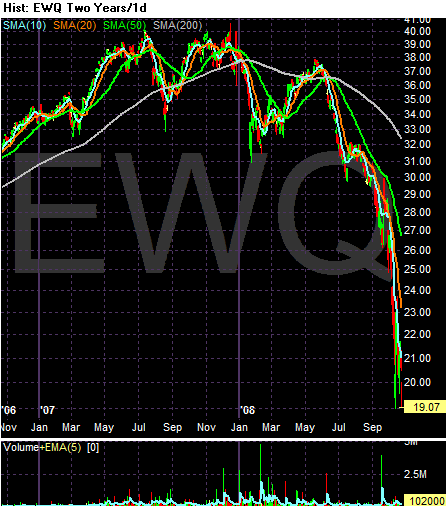
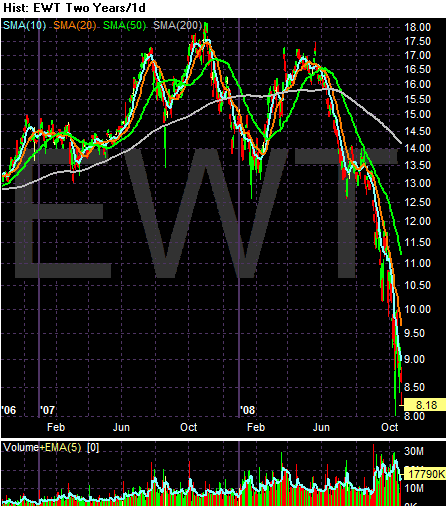
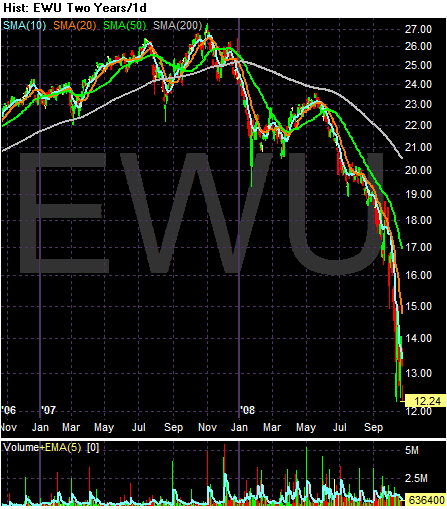
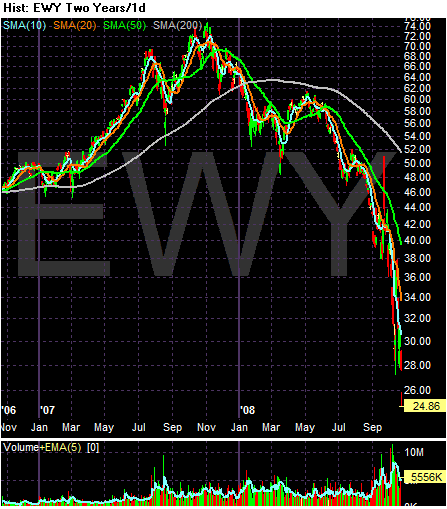
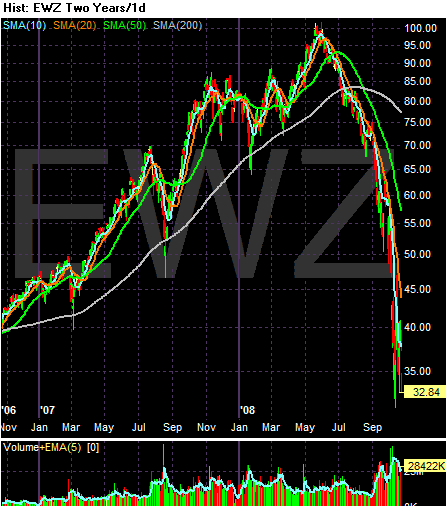
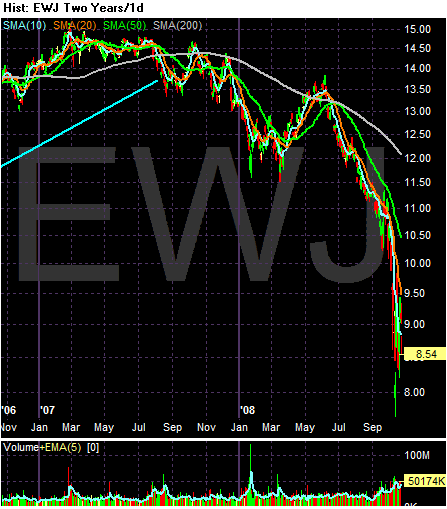
To that end, here are charts of some ETFs of world markets. Notice we're all in the same boat -- everyone is getting hammered. There are no exceptions.

Australia

Photobucket

Germany

Photobucket

Japan

Photobucket

Mexico

Photobucket

France

Photobucket

Taiwan

Photobucket

UK

Photobucket

South Korea

Photobucket

Brazil

Photobucket

For what it's worth, misery loves company.....

Thursday Oil Market Round-Up


Click for a bigger image

On the weekly chart, notice the following:

-- Prices are continually moved through support levels

-- Prices are now at levels from the 2Q 2007

-- Prices are below all the SMAs

-- All the SMAs are moving lower

-- The 10 day SMA has moved through the 50 day SMA

Bottom line: this is a bearish chart


Click for a bigger image.

On the daily chart, notice the following:

-- Prices are continually moved through support levels

-- Prices have been dropping for three months

-- All the SMAs are moving lower

-- The shorter SMAs are below the longer SMAs

-- Prices are below all the SMAs

Bottom line: this is also a bearish chart. It reminds me of the dollar chart that existed for most of this year.

Wednesday, October 22, 2008

Today's Markets

Photobucket

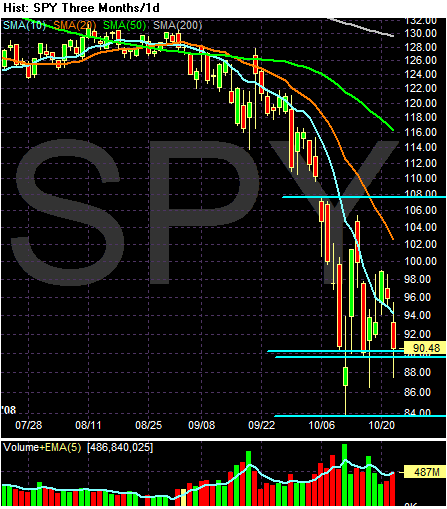
Despite the large move today (SPYs down 5.61%), we're still within my range which is roughly 90-108. However, the overall tenor of the chart is still negative -- all the SMAs are moving lower, the shorter SMAs are below the longer SMAs and prices are still below all the SMAs.

Photobucket

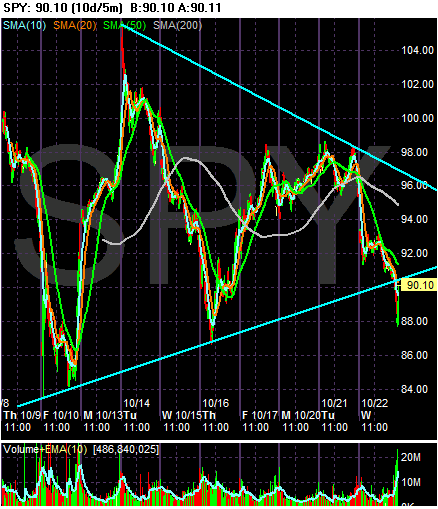
Both Trader Mike and Afraid to Trade are looking at the SPYs as a triangle consolidation pattern. I don't disagree with this read. The chart above demonstrates a triangle is very clear.

Photobucket

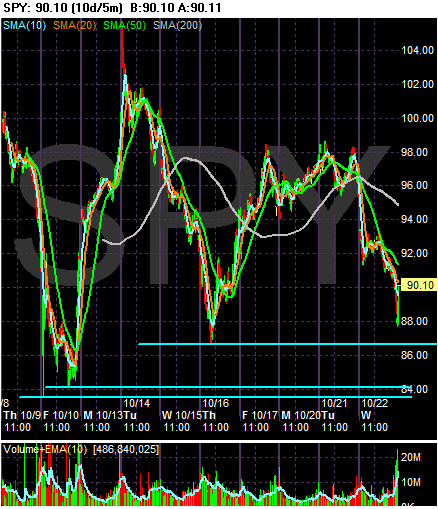
However, given the high volatility of the market right now along with the wide-open nature of the economy and overall situation, I'm more comfortable looking at this solely from a trading range pattern. I'm also more concerned with the chart's lows. I still think 90 is the most important low -- if we move through that level I don't think the lower points near 84 are nearly as strong. That means the market really needs to hold at the 90 level.

In the "Very Responsible For This Current Mess" Department...

From Bloomberg:

Former executives from Standard & Poor's and Moody's Investors Service told lawmakers today that credit raters relied on outdated models in a ``race to the bottom'' to maximize profits.

Jerome Fons, a former managing director of credit policy at New York-based Moody's, told the House Oversight and Government Reform Committee today that originators of structured securities ``typically chose the agency with the lowest standards, engendering a race to the bottom in terms of rating quality.''

Representative Henry Waxman, the committee chairman, said that the recent history of the credit rating companies ``is a story of colossal failure.'' ``The result is that our entire financial system is now at risk,'' Waxman said.

The House panel is reviewing the role played by S&P, Moody's, and Fitch Ratings in the global credit freeze. The Securities and Exchange Commission in a July report found the firms improperly managed conflicts of interest and violated internal procedures in granting top rankings to mortgage bonds.

The top executives of the credit-rating companies said in written testimony that they were unprepared for the sharp drop in home prices and that their systems failed.

``Events have demonstrated that the historical data we used and the assumptions we made significantly underestimated the severity of what has actually occurred,'' said Devan Sharma, president of New York-based S&P.


And there's more from a different article:

Employees at Moody's Investors Service told executives that issuing dubious creditworthy ratings to mortgage-backed securities made it appear they were incompetent or ``sold our soul to the devil for revenue,'' according to e-mails obtained by U.S. House investigators.

The e-mail was one of several documents made public today at a hearing of the House Oversight and Government Reform Committee in Washington, which is reviewing the role played by Moody's, Standard & Poor's and Fitch Ratings in the global credit freeze.


I place a great deal of the blame for the current mess at the feet of the ratings agencies. They gave crap paper great ratings thereby insuring the largest number of investors would buy the paper. That's one of the primary reasons for the current mess: so long as bonds had an "investment grade" rating everyone was happy. And the testimony above indicates the people/companies seeking a rating knew how to game the system.

If the paper had been properly rated only more speculative investors would have purchased it, thereby limiting the number of people who were exposed to credit issues to people who knew what they were doing (or at least had a better possibility of knowing the real risks they were getting).

A New Addition -- The Donation Button

You will note the addition of a donation button on the right side of the blog. These are entirely voluntary; I will keep blogging no matter what. But, hey, a few extra bucks would be nice if you can afford it and you think the analysis is worth it.

We're Nowhere Near A Bottom in Housing

From CNBC:

About 12 million U.S. homeowners owe more than their homes are worth, compared with 6.6 million at the end of last year and slightly more than 3 million at the close of 2006, said Mark Zandi, chief economist at Moody's Economy.com.


Will this end anytime soon? Not likely. The following charts are from Calculated Risk. Click on the image for a larger image.

Inventories are still sky in in absolute numbers:


And in months of available supply:


As a result, prices are dropping like a stone:


Now ask yourself this question: are people going to buy more or fewer homes right now? The job market has been tanking all year (and has been dropping year over year for far longer):


And unemployment has been rising:


Oh yeah -- the credit markets are in complete turmoil making it really hard to get a loan right now.

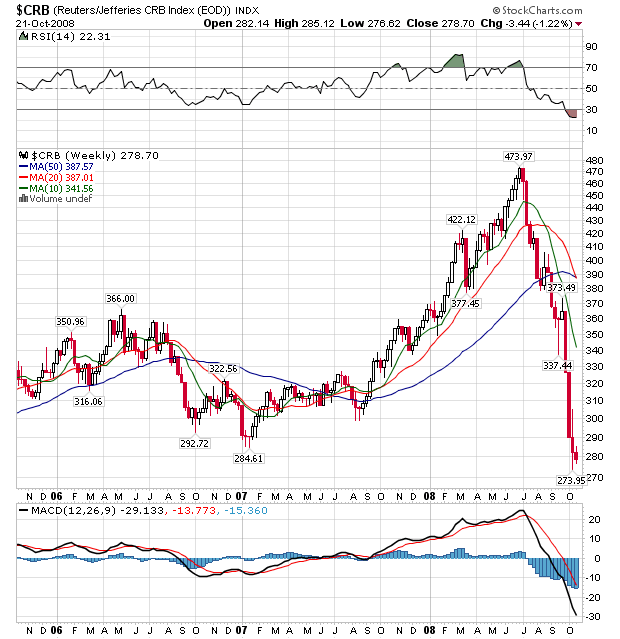
Wednesday Commodities Round-Up

Wow -- just wow. A few months ago I was extremely worried about spiking inflation levels. Now those fears have gone completely by the wayside.

Photobucket

Commodity prices are now at or near their lowest levels in over three years. Also note the following:

-- Prices are below all the SMAs

-- the 20 day SMA is about to move through the 50 day SMA

-- All the SMAs are now moving lower

BUT

Note the CRB is very oversold right now.

Photobucket

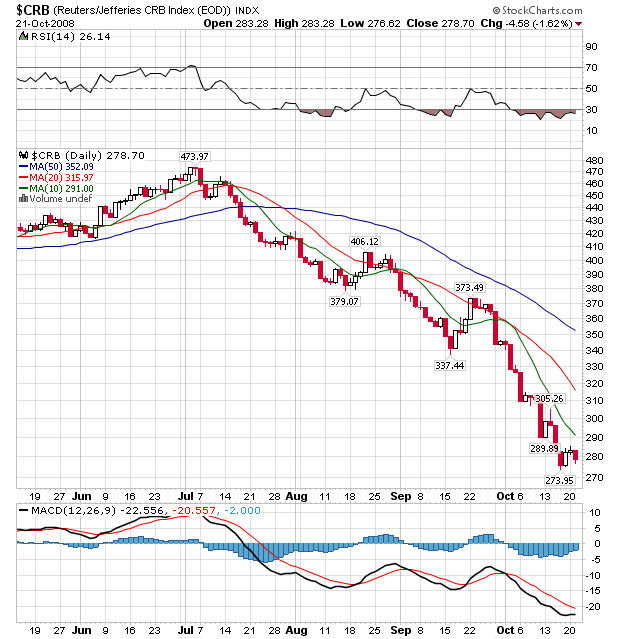
On the daily chart, notice the following:

-- Prices are below all the SMAs

-- All the SMAs are moving lower

-- The shorter SMAs are below the longer SMAs

-- Prices have been dropping for three months

This chart looks a great deal like the dollar chart from the last few years.

Bottom line: this is now a very bearish index.

Tuesday, October 21, 2008

Today's Markets

Photobucket

Remember -- I'm looking for the market to consolidate between (roughly) 90 and 108. While that is still a wide range (roughly 20%) it makes sense given the high level of volatility:

Photobucket

Bottom line: so long as we're between those two levels I'm still thinking we're consolidating from a massive sell-off.

Corporate Earnings Looking Poor

From FT:

The technology sector led the declines, down 3.8 per cent overall. Texas Instruments fell 7.7 per cent to $16.60 after the technology company disclosed worse-than-expected results after the bell on Monday.

Sun Microsystems and Logitech sustained some of the heaviest losses, down 14 per cent to $4.97 and 14.5 per cent to $15.63, respectively, after their updates both indicated a downbeat outlook.

.....

AK Steel retreated 3.3 per cent to $14.61 after the group said prices would be down about 10 per cent towards the end of the year while DuPont lost 2.8 per cent to $35.20 after the chemicals company cut its full-year forecast.

Lockheed Martin fell 3.2 per cent to $90.20 after the defence group reduced its guidance for next year on concerns of reduced military spending by the next administration.

.....

Fifth Third, which said it may ask to be included in the Treasury’s plan to buy stakes in U.S. banks, fell 11 per cent to $10.88 on the back of poorly received results.

Regions Financial lost 2.7 per cent to $11.90 after its earnings from continuing operations fell 76 percent in the third quarter, which was below analyst forecasts.

National City, hurt by increased mortgage reserves and losses from construction loans, fell 5.5 per cent to $3.08 after posting its fifth straight quarterly loss.

Keycorp, also dented by an increase in reserves for bad loans, added 8.8 per cent to $10.63 after posting its second straight quarterly loss.


If we just take out all the financial companies, we can see the problems are contained ... nevermind.

Getting Out Of The Recession

A few months ago I wrote an article titled Yes It's a Recession, No It Won't End Soon. I used the NBER's more in-depth recession determining formula and concluded we are currently in a recession. In addition, I added it would take awhile to get out of it. Several other people have commented on the recession. They have made the following observations:

Henry Blodget is arguing for a long recession because consumers are currently heavily in debt and they need to get out from under all the debt before they can start spending again:

Unfortunately, at risk of invoking the four most expensive words in the English language, "this time it's different."

Why?

Because the US consumer is finally broke. For thirty years, we piled on debt and then spent almost every new penny we got. This borrowing spree was made possible by a smorgasbord of no-money-down lending products and ever-appreciating asset prices. Unfortunately, the situation has now changed. The lenders who created those products have now been demolished, and asset prices are falling fast. And this is leaving American consumers with no choice but to cut back.

A few exhibits:

US debt has risen from 163% of GDP in 1980 to 346% in 2007. Household debt, a subset of this, has risen from 50% of GDP to 100%. (Please click here if you would like to see charts that illustrate the points I'm making here)


Mish is arguing for The Age of Frugality:

The US has been on a consumption binge of epic proportions all on the misguided belief that real estate prices would keep on rising forever, at a clip of 8% or more a year. No one ever bothered to do the math as to how anyone could possibly afford to pay the projected prices. Real wages were shrinking but somehow everyone could get rich selling houses to each other.

The "Housing Prices Always Go Up" dream has finally crashed on the rocks of reality. However, while the party was still going on, consumers were willing to go deeper and deeper in debt, buying new kitchens, taking expensive vacations, buying boats, buying SUVs "needed" to haul all the junk around they were buying, etc. And as long as home prices kept rising, everyone ignored the debt side of the balance sheet.

Now, the party has ended, and asset prices are crashing but the debt still remains. Consumers are now very concerned (finally), about the debt side of the balance sheet. It is going to take an amazing shift from consumption to savings to pay down that debt. And a secular shift from consumption to saving is now underway. "Cool To Be Frugal" is actually an understatement.


Businessweek had noticed this trend as well:

....People who overconsumed during the past decade are now rejecting extravagant lifestyles. They're spending less, and more wisely. Some are getting their finances in order. Others are fearful of losing their jobs, shocked by investment losses, or hunkering down amid the general uncertainty.

The penny-pinching is already showing up in the numbers; this quarter could mark the first fall in personal consumption in 17 years. And with credit tight and Americans loaded down with $2.6 trillion in personal debt, consumer borrowing dropped in August, the first such contraction since 1991. Menzie D. Chinn, who teaches economics at the University of Wisconsin, figures consumers won't be in a position to spend freely for five years.

Which brings us to what John Maynard Keynes called the paradox of thrift. What's good for the individual, argued the famous economist, can ignite or deepen a recession. But that won't deter the newly thrifty. "I can't help the economy," says Kim Schultz, a resident of hard-hit Avoca, Mich., who with her husband, Jon, owes $40,000 in credit-card debt. "I've got to help myself." On the other hand, this newfound austerity could—emphasis on could—rewire Americans as savers rather than spenders. And that would help put the economy on a sounder footing over the long haul.
I am hardly the only person commenting on the economy who noticed the mammoth amount of household debt reported in the Federal Reserve's Flow of Funds Report. Here's the essential problem. The US savings rate (which is gross income less all possible payments) was about 2% at the beginning of this expansion. According to the Census Bureau real median household income has been stagnant for this expansion. Yet consumer spending has increased. So where did all the new spending money come from? Debt.

So, the question now becomes this:

How will the US economy grow when

1.) 70% of its growth is based on consumer spending, yet

2.) The US consumer is more focused on paying down debt then spending money?


The simple answer is the US consumer must start to see income increases -- something he hasn't seen for over eight years. That's going to take jobs. And it's going to require a combination of two events.

First, the quality of jobs has to increase. That means we have to create high paying jobs which our workforce can perform.

Secondly, we have to create enough jobs to create a labor shortage which will drive-up wages.

However, even if we accomplish these things there is no guarantee people will start spending on things again. Instead they may use the new income to pay down debt. That means Us GDP growth will have to come a bit more from selling things to other countries than buying stuff from them. That means we have to be more export driven -- we need products we can sell to other people in large enough quantities to influence our GDP positively.

Treasury Tuesdays

Photobucket

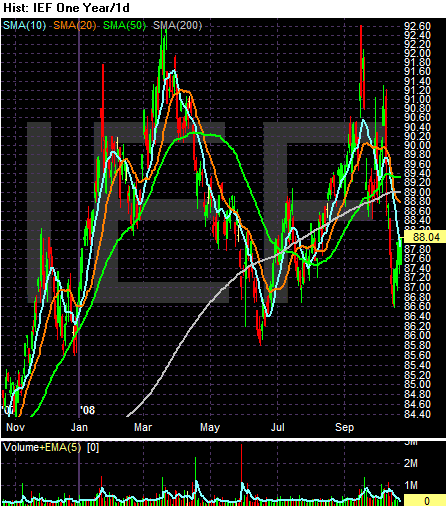
On the yearly chart, notice we have a possible double top forming. The first occurred at the beginning of the second quarter of 2008 and the second occurred at the end of the third quarter of 2008.

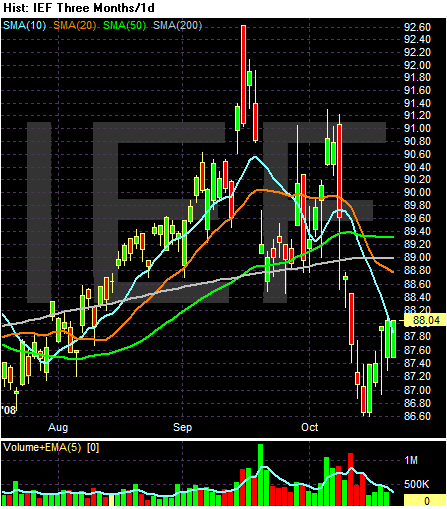
Also note the market has had the following moves. A rally that ended in late March 2008 which was caused by the credit crisis. A sell-off that was caused by a stock market rally which ended in late June 2008. A rally that lasted from late June to late September that was caused by a credit crisis which lasted from late June to late September and finally a sell-off that is caused by the mammoth amount of debt the US government is issuing for the bail-out. On that note, let's go to the three month chart:

Photobucket

On the daily chart, note the following:

-- The short term SMAs are bearish. Both the 10 and 20 day SMA are moving lower and have moved below the 50 day SMA

-- The 200 day SMA is still rising, indicating the long-term trend is up.

-- The 50 day SMA has a slight downward bias right now. This will probably move lower in the next few weeks as prices are below this number

-- Prices have been moving around the 200 day SMA with little indication of what long-term trend they want to take.

Bottom line: there are a lot of contradicting signals on this chart.

Monday, October 20, 2008

Today's Markets

Remember that I'm looking for the market to consolidate at or near current levels. The reasons are listed in today's Market Monday's Post.

Photobucket

Today prices moved above the 10 day SMA. However, prices are still between the 90 and 108 levels where I think they are currently consolidating. All other pieces of the technical puzzle are still bearish:

-- The SMAs are moving lower

-- The shorter SMAs are below the longer SMAs

-- Prices are still below (way below) the 200 day SMA

Federal Spending and the Deficit

From Bloomberg:

Federal Reserve Chairman Ben S. Bernanke endorsed additional fiscal stimulus, saying the credit crunch is ``hitting home'' as Americans find it harder to get loans, threatening a prolonged economic slump.

Lawmakers ``should consider including measures to help improve access to credit by consumers, homebuyers, businesses and other borrowers,'' Bernanke said in testimony to the House Budget Committee. ``Such actions might be particularly effective at promoting economic growth and job creation,'' he said, calling consideration of a stimulus ``appropriate.''

.....

House Speaker Nancy Pelosi has proposed an initiative of as much as $150 billion after the credit crunch deepened in recent months and the effect of the first stimulus package wore off.

Budget Deficit

Wisconsin Representative Paul Ryan, the budget panel's ranking Republican, said in the hearing that the Democratic plan is ``bloated'' and may balloon the budget deficit to $1 trillion. ``Throwing more money out the door may help for a quarter, but it won't help to create jobs,'' Ryan said afterward.

Bernanke, under questioning, declined to recommend a size for the package. He said the current ``large'' deficit is ``not totally inappropriate given the nature of the emergency that we're facing and not totally avoidable given the loss of tax revenues.''


Let's reiterate a few basic facts.

1.) The Federal government has been running a budget deficit of at least $500 billion dollars/year since 2003. This is based on the total amount of debt issued per year. The debt is both publicly held and intra-governmental.

2.) The total amount of debt held by foreign investors has doubled from (roughly) $1 trillion to (roughly) $2 trillion.

3.) Total US debt outstanding is about $10.2 trillion, or roughly 70% of total US GDP.

Bottom line: there's a ton of debt out there.

My main concern with this issue was the dollar's multi-year drop. However, the dollar has rallied for the last month or so. In other words, the dollar isn't an issue right now (although the dollar is still at very low levels).

My secondary concern is the inability of the US to make difficult choices. The US government has continued to spend like it has lots of money when in fact it doesn't. In addition, there are difficult choices ahead for the US, especially when it comes to entitlement spending (read medical expenses).
javascript:void(0)
However, the US economy is in desperate need of a standard Keynsean push right now -- so long as it is the right kind of push. For example, infra-structure spending would be good on several fronts. It would provide employment for displaced construction workers hurt by the housing downturn. This would help to ameliorate foreclosures and boost consumer spending a bit. It would also provide help for businesses when the economy rebounds.

I still have mixed feelings about this, although I have to admit this seems like the worst time to be fiscally prudent. But if not now, when? Fiscal responsibility is always something we'll do tomorrow.

Bonddad Bullish?

I know -- those two words would seem to never go together. But consider the following:

1.) See my market post below. Simply from a technical perspective the market has already sold-off a ton. While it can still go lower I think the majority of the technical damage has been done.

2.) We have seen unprecedented international action to thwart the credit crisis. Europe as swept in with a massive package. The US followed suit. Now there is talk of an international conference to deal with this situation. The bottom line is governments are reacting with appropriate concern and giving an appropriate response to the problem.

3.) Barry's bullish. If you thought I was bearish, well you don't know Barry. Actually, I think we were both bearish for quite some time. Barry's a big fan of contrary indicators. And he's seeing a lot of them right now.

4.) Consider the following from Warren Buffet:

THE financial world is a mess, both in the United States and abroad. Its problems, moreover, have been leaking into the general economy, and the leaks are now turning into a gusher. In the near term, unemployment will rise, business activity will falter and headlines will continue to be scary.

So ... I’ve been buying American stocks. This is my personal account I’m talking about, in which I previously owned nothing but United States government bonds. (This description leaves aside my Berkshire Hathaway holdings, which are all committed to philanthropy.) If prices keep looking attractive, my non-Berkshire net worth will soon be 100 percent in United States equities.

Why?

A simple rule dictates my buying: Be fearful when others are greedy, and be greedy when others are fearful. And most certainly, fear is now widespread, gripping even seasoned investors. To be sure, investors are right to be wary of highly leveraged entities or businesses in weak competitive positions. But fears regarding the long-term prosperity of the nation’s many sound companies make no sense. These businesses will indeed suffer earnings hiccups, as they always have. But most major companies will be setting new profit records 5, 10 and 20 years from now.

Let me be clear on one point: I can’t predict the short-term movements of the stock market. I haven’t the faintest idea as to whether stocks will be higher or lower a month — or a year — from now. What is likely, however, is that the market will move higher, perhaps substantially so, well before either sentiment or the economy turns up. So if you wait for the robins, spring will be over.
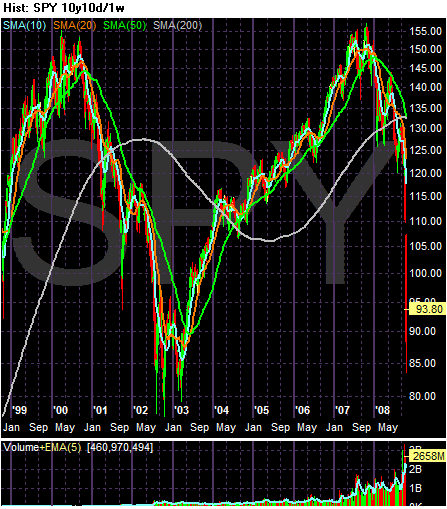
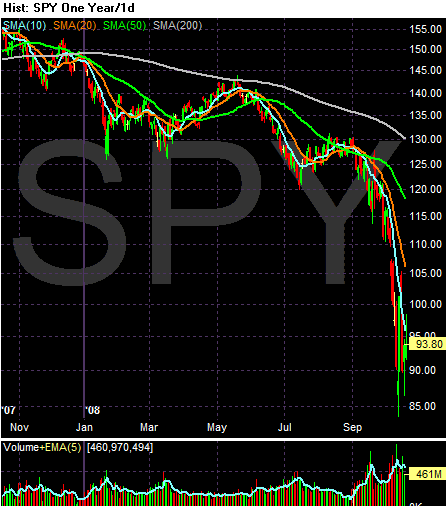
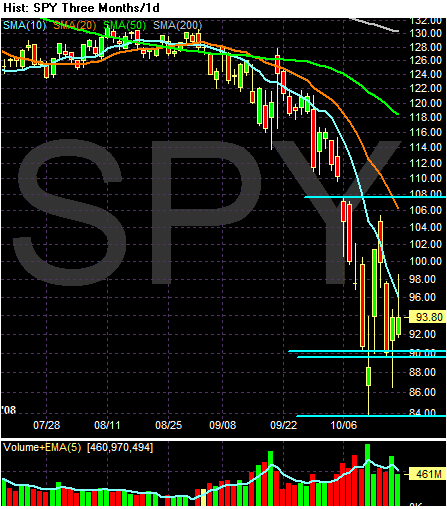
For me, the most important indicator right now is a raw, long-term chart of the SPYs. Bottom line, that looks like one hell of a buying opportunity to me right now.

Market Mondays

I've been thinking as awful lot about market bottoms lately, largely because of the size and the magnitude of the most resent sell-off. Consider the following chart:

Photobucket

Note the SPYs have formed a multi-year double top. The first top occurred in 2000 and the second top occurred last year. Prices have obviously fallen since the 2007 top.

Consider that from 2003-2007 prices ran from a low of around 80 in 2003 to 155 last year. Prices are now at 93.8. In other words, most of the 2003-2007 rally is now gone. Yet corporate profits have increased since 2003, meaning overall valuations are cheap by historical standards.

Photobucket

On the year long chart, simply notice the market has been dropping for the last year. That's a pretty long time in market history. Another way to say this is the market has been correcting for a long enough time to shake out a lot of speculative players. In addition, note the volume increase in September and October of this year. That could be a selling climax.

Photobucket

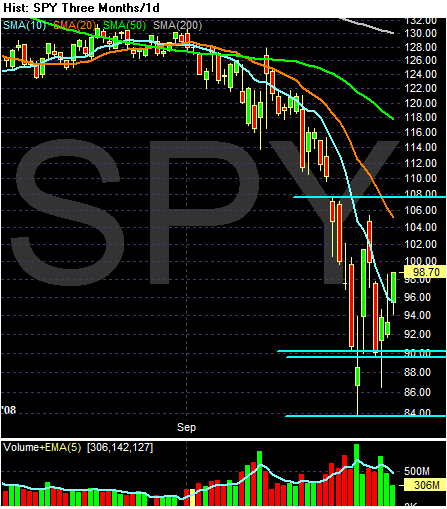
On the three month chart, notice the following:

-- Prices are below all the SMAs

-- All the SMAs are moving lower

-- The shorter SMAs are below the longer SMAs

In other words, this is a classic bear market chart. However, also note that prices are moving in a wide consolidation range right now. The most extreme reading of this range would be 84-108. However, I think the real bottom would be around 90, closing the range to 18 points. I'm thinking the market is going to consolidate in this range barring another unforeseen random economic event.