Saturday, September 10, 2022

Weekly Indicators for September 5 - 9 at Seeking Alpha


 - by New Deal democrat

My Weekly Indicators post is up at Seeking Alpha.

While interest rates continue to rise, gas prices have continued to fall, giving consumers a second wind.

As usual, clicking over and reading will bring you up to the virtual moment, and reward me a little bit for my efforts.

Friday, September 9, 2022

The spending transition from goods to services


 - by New Deal democrat

Today is the last day for a very light economic week of news. One item worth addressing is the relative state of consumer purchases of goods vs. services in this pandemic recovery, because it appears to be unique.


Let’s start with the ISM non-manufacturing report, which was released on Tuesday. Unlike the manufacturing report, which bounced back slightly into expansion after two months of slight contraction, the non-manufacturing portions of the economy were still going strong in August, if not at their Boom levels of last year:


The overall index level was 56.9, well into expansion and a perfectly normal level over the past 15 years. The new orders index (not shown) was 61.8, showing strong expansion.

As indicated, the ISM manufacturing index has showed the “goods” sector at a complete stall for the last few months. Worse, the measure of real (inflation-adjusted) manufacturing and trade sales, shows contraction YoY through June for the 4th month in a row:


As you can see, going back 60 years, with the sole exception of 2019 and two months at the end of 1989, this has *always* signaled recession. Not good.

That’s the sales side of the coin. Now, let’s take a look at how this plays out on the other side of the coin, i.e., personal consumption expenditures, for goods and for services.

“Real” PCE’s for goods have indeed declined ever since spring 2021; but for services they are still increasing:


Measured on a YoY basis, similarly to the real sales data, when real expenditures for goods have turned negative, there has usually been a recession (note: I’ve split the data into 2 30 year+ segments for clarity):


The exceptions have been big slowdowns that were not quite recessions, e.g., 1966-67, 1986-87, 1996.

Now here is a close-up on the last 3 years:


Note that the YoY decline only lasted 2 months, and has since rebounded. This is most consistent with a slowdown that is not a recession, or at worst, the 2001’s just-barely-a recession.

The above made use of the PCE price index as a deflator. Since 2002, there has also been a chain deflator. Here’s how that data looks:


The YoY goods downturn was steeper and lasted 4 months, but turned positive in July, while the services measure remained very positive, if declining.

Indeed, when we combine real spending on both goods and services, while we see a deceleration - to be fair, one similar to in 2007 - but no downturn as during the past 2 recessions:


The bottom line here is, that there is merit to the suggestion that what we are primarily seeing is a transition from spending on goods during the teeth of the pandemic (i.e., Amazon deliveries to your door), to spending on services now that restrictions have virtually all been lifted. In other words, not recession, at least not yet.


Thursday, September 8, 2022

An update on oil and gas prices


 - by New Deal democrat

After stabilizing in the $87-$94 range for a little over a month, oil prices have declined further in the past several days. As of this morning they were in the $82/barrel range. The YTD graph via CNBC below shows that they have now completely reversed the Ukraine invasion increase that began in February (perhaps linked to Ukraine’s counteroffensive of the past week?):


Gas prices follow oil prices with typically a delay of several weeks. As shown above, oil prices peaked in early June, and gas prices at mid-month. 

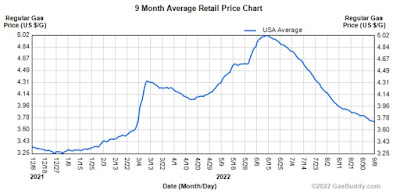
So here is a 9 month graph, via GasBuddy, of gas prices:


The declines in gas price declines slowed down a couple of weeks after those of oil. As of this morning, nationwide gas prices averaged $3.72.

Just before the Ukraine invasion, gas prices averaged about $3.50/gallon. If oil prices hold in this new, lower range, we could see gas prices back at that level in several weeks.

This in turn would support more consumer spending, a pop in consumer confidence, and in Biden’s approval rating - as well as another good month on the consumer price index front.


Another week of good news on jobless claims


 - by New Deal democrat

Initial jobless claims had been in an almost relentless uptrend from the end of March through early August. Since then, they have completely reversed.

This week initial claims declined another -6,000 to 222,000, and the 4 week average declined -7,500 to 233,000. Continuing claims, which lag somewhat, increased another 36,000 to 1,473,000, a 5 month high:


There was a little caterwauling on CNBC about the increase in continued claims. I am not concerned in the slightest. As I wrote above, they lag initial claims. They will reverse lower in the next few weeks.

Lower gas prices continue to bring lots of good short term news to the economy. I tipped off Menzie Chinn of Econbrowser to their correlation to consumer confidence and presidential approval, and he helpfully calculated their correlation, with graphs, in this post.

I want to caution that the long term outlook in next year remains negative; but as noted above, this takes the pressure off the short term.


Wednesday, September 7, 2022

Coronavirus dashboard for September 7: the slow ebbing on the way to endemicity continues


 - by New Deal democrat

I promised a COVID update, so I suppose I ought to follow through.


Let’s start today with a graph of South Africa’s cases and deaths for the past year:


South Africa is where BA.1 and BA.4&5 originated. You can see the huge spike in cases last December from original Omicron, and the smaller spike this June from BA.4&5. And yet deaths never approached the peak from Delta in summer 2021. 

Even more importantly, both cases and deaths are now as low as, and in the past month have even been lower than at any point since the pandemic started over 2 years ago.

I think this is a foretaste of what the future of COVID is likely to be.

Here is the same information for the US for the past 6 months:


Neither cases nor deaths came even close during the BA.2.12.1 or BA.4&5 waves to their peak from original Omicron last winter (or, in the case of deaths, to their peak during Delta).

And with no new variant showing signs of breaking out, cases have declined by over 40% from their recent peak in July. Deaths, which with the exception of June and July 2021 had always been over 1000/day, have not gotten significantly above 500/day for the past 4 1/2 months.

Meanwhile, hospitalizations have also declined nearly 25% from the July peak:


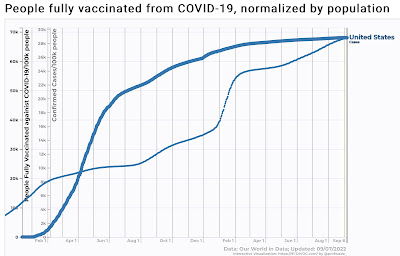
What is most remarkable is that this is despite the near total abandonment of both government and individual mitigation measures. As shown in the graph below, the % of people who have been fully vaccinated has virtually ground to a halt at a little over 67% since last winter:


Meanwhile total confirmed cases have continued to increase to nearly 30% of the entire population. Since we know that 1/2 or more of cases are asymptomatic, so those people probably won’t bother to get tested, the likelihood is that over 60% of the entire US population has been infected at some point.

Indeed, several months ago, a study of seroprevalence (bloodwork showing reaction to COVID) showed that almost 80% of school age children had at one point or another been infected:


Additionally, we know that since home testing was widely available in January, many symptomatic people haven’t bothered to get “officially” tested either. Biobot wastewater data has shown that since that time something like 2/3’s of all cases are likely not officially confirmed.

Speaking of which, here is their most recent regional update:


After declining 45% nationally, cases turned up a little bit in the past week, mainly in the South and Northeast. That may just be an anomaly due to incomplete data, or it may herald something else. Since there has been no indication that any variant, including BA.4.6, is able to outcompete BA.5, my guess is that it is an anomaly.

With vaccinations and advances in treatment - and also the fact that a large majority of the US population is no longer “immunologically naive” via either vaccination, infection, or both - only about 1 in 750 cases now results in death, with those skewing to the unvaccinated and the elderly. I suspect that we will continue to see slow declines until the cold weather arrives, or else some new even more competitive variant appears.

Tuesday, September 6, 2022

I told you so


 - by New Deal democrat

Not much economic news this week. I’ll post an update on COVID later, but for now, a follow-up on my Mar A Lago search warrant post last week.

Last week I concluded my observations as follows:

Despite how devastating the DoJ response apparently is, it is important to remember that this judge, on Friday [actually Saturday, sorry], publicly declared that she had made up her mind on an issue before the other party had an opportunity to respond to the request, without even proper service on the defendant, without asking for any sworn factual assertions by the plaintiff, and to provide information to her about, inter alia, highly classified documents that goes beyond normal search warrant practice.


“There is no substantial reason to believe that she will change the conclusion she obviously arrived at last week. So prepare for the judge to completely disregard the information put forward by the DoJ, and issue an unprecedented, broad, and novel ruling.”

On Saturday, on another forum, I followed up with the following prediction:

“I see her issuing a broad order, including executive privilege, and under a rubric of “extraordinary circumstances” and “equitable jurisdiction,” essentially placing herself in the role of “supervising judge” overseeing anything having to do with this search warrant. She will have to avoid relying on the PRA; avoid enjoining the government from taking certain actions (because that’s appealable); and finding that this case is sui generis for purposes of avoiding Nixon as controlling precedent.”

And sure enough, here is the money quotation from her ruling:

“Pursuant to the Court’s equitable jurisdiction and inherent supervisory authority, and mindful of the need to ensure at least the appearance of fairness and integrity under the extraordinary circumstances presented, the Plaintiff’s Motion is Granted in Part….

“The Court takes into account the undeniably unprecedented nature of the search of a prior President’s office…”

The Court literally hit all of my buzzwords in those two sentences. 

The only thing I got wrong is that she *did* enjoin the government “from further review and use of any of the materials seized from Plaintiff’s residence on August 8, 2022, for criminal investigative purposes pending resolution of the special master’s review process as determined by this Court.”

So, what happens now? The same practicing lawyers who Genuflected before the Majesty of the Law two weeks ago, assuring us that this judge would quickly laugh this case out of court, now suggest that the DoJ should probably just “power through” the special master process.

Nuh uh. Here’s why.

First of all, the Court ordered that:

On or before September 9, 2022, the parties shall meaningfully confer and submit a joint filing that includes:

a. a list of proposed special master candidates; and

b. a detailed proposed order of appointment in accordance with Rule 53(b), outlining, inter alia, the special master’s duties and limitations consistent with this Order….”

Again, I have no special knowledge of criminal procedure, but let’s just examine the behavior of the parties, particularly Trump. 

And here is the simple fact: it is in Trump’s interest to drag this process out as long as possible, because until the process is concluded, the government may not “review or use” any of the materials. This in my opinion likely includes arresting and charging Trump. The Court’s order is unclear, but given her behavior so far, it is at least quite likely she would view arrest and/or charging as being in contempt of her order. I would not like to be the DoJ attorney having to appear in front of her for that reason.

So, here’s what will happen. The parties will *not* in fact be able to agree on “proposed special master candidates.” Trump will propose clearly biased candidates that the DoJ will never agree to. This will give rise to further litigation before the judge, which will delay the matter further; and since the judge has already clearly shown she will bend over backwards for Trump, the likelihood is she will use her “supervisory authority” to resolve the deadlock by appointing a pro-Trump master.

For the same reason, it is not in Trump’s interest to agree to *any* limitations on the “special master’s duties.” He wants the special master to be able to declare any documents “privileged” and further to both preclude the government from making any use of them, and even further, to return the documents to him.

So there will be litigation over that in front of a biased, pro-Trump judge. More delay. More likely pro-Trump rulings.

See how this works?

Next, There is already much discussion in legal Twitter about the fact that the Judge did not give any parameters as to how the special master could determine if “executive privilege” applies. As far as I can tell, there are none that could apply. The special master is going to have a tabula rasa on which to write; all of which will be further subject to this judge’s “supervision,” no doubt exercised to declare as much as possible privileged for Trump.

Indeed, Trump will now claim executive privilege as to *all* the documents, and refuse to budge. 

Result: this creates yet another issue that can be litigated for a full year or two - as will any decisions by the special master adverse to Trump.

Further, because the judge is ultimately reserving the issue to herself under her undefined “equitable” “supervisory authority,” this will also create a huge morass of issues, that could take several years to untangle via further litigation.

In the meantime, so long as her restraining order on the DoJ is in effect, I don’t see how they can prosecute Trump for anything having to do with these records, because the prosecution would “make use” of the records.

One final note about the judge’s bias. In her opinion, she says she is granting the motion so that there will be “at least the appearance of fairness and integrity.”

Excuse me? Shouldn’t this judge first and foremost be concerned about *actual* fairness? Try to read that sentence without arriving that the conclusion that the judge has already determined that the entire seizure of documents from Mar a Lago was substantively unfair. There’s simply no other way to read it. Unfair to whom? Clearly not the DoJ! So this judge has already determined that the seizure was substantively unfair to Trump, but at least her order can create a fair-appearing process to resolve it.

That’s how this “special master” process is going to play out, unless Cannon’s order is reversed, and promptly, by a higher court.

Monday, September 5, 2022

On Labor Day 2022, how well is labor doing?


 - by New Deal democrat

This is Labor Day, so let’s take a look at a few metrics of how labor is doing.


As an initial aside, occasionally I get asked why I write about expansions and recessions. An important reason is, pretty much by definition during recessions jobs and income decline. During expansions they, well, expand. So forecasting whether the period ahead will feature better or worse conditions for job-holding and income for average workers is a social good in my book.

Last Friday in the jobs report, there was an apparent anomaly in that the unemployment rate went up (bad), but the labor force participation rate increased (good). How could that be, and what does it mean?

Not everybody participates in the labor force. People are retired, or homemakers, or full-time students, or disabled. Or discouraged, thinking they can’t get a job. All other adults - those who are in the labor force - either have a job (employed) or they don’t (unemployed). The LFPR measures the combined total of the two, while the unemployment rate only measures the latter.

There is a problem working with the long term LFPR, because the cyclical trends are swamped by the secular tsunami of women entering the labor force between the 1960s and 1990s, together with the very slow ebbing of male participation that has been going on ever since the 1950s. So I only measure beginning in the mid-1990s.

Since 1994, the LFPR has been a “long lagging” indicator coming out of recession. It only bottoms significantly *after* the unemployment rate peaks, sometimes by years. Generally speaking, people don’t bother entering the work force unless they think there is a likely prospect of landing a job. There isn’t a magic number, but over the past 30 years, that has been about once the U6 underemployment rate has fallen below 10%. In the below graph, I subtract the U6 rate from 10% so that any number below 10% shows as a positive and any number above it shows as a negative:


The LFPR bottomed in 1994, 2005, and 2015, *long* after the last recession had ended, and also several *years* after the underemployment rate was at its worst. At peaks the behavior is different, as the LFPR peaks coincident with or even slightly *before* the underemployment rate. This is particularly true if we use a 3 month average of the LFRP rather than noisy monthly data.

Now here is the same graph for the last 2 years:


This last Friday’s report looks like an anomaly, because the underemployment rate worsened, but the LFPR increased. But because the LFPR is noisy, if we look at the 3 month average, the peak of the LFPR as of now is still March through May. In other words, the pattern of the last 3 expansions may repeat in this one, although the jury is still out.

Another way of looking at the LFPR is to decompose it into the monthly change in employment vs. unemployment, which is what the below graph does for the past 21 months (before that the #s would be off the scale):


The decelerating trend in the gains in the number employed (blue) is apparent, as is the decelerating trend - and perhaps reversal of trend - in the decreases in the number of unemployed. I suspect the big increase in the number of employed in August is going to prove to be a positive outlier, but we’ll have to wait a month or two to find out.

One other metric I wanted to address this Labor Day is “real aggregate payrolls” for nonsupervisory workers. This is the total income reaped by the working and middle class, after adjusting for inflation. This information goes back almost 60 years, so I am splitting it into 2 graphs; first, 1964-1993:


And here is 1994-2022:


This metric has lots of signal and not much noise. With the exception of the 2020 pandemic, it always decelerated for months before the onset of recessions, and with one exception also turned down for about 6 months or more before a recession began (in 1969, it peaked one month before the recession).

Now here are the past 2 years:


We see clear deceleration beginning in September 2021, and an actual downturn this past spring, before rebounding in July.

The spring downturn was primarily about the spike in gas prices due to the Ukraine invasion, and the July rebound due to the big decline in gas prices that month. *Nominally,* according to Friday’s report, aggregate payrolls increased 0.3%. Because gas prices continued to decline in August, that will probably turn into another month of real aggregate income gains, but we’ll have to wait for the CPI report next week to be sure. 

Bottom line, we could yet see a new record high in real aggregate income, but the trend of sharp deceleration at least will likely remain intact. This series continues to warn of a likely recession in the coming months.