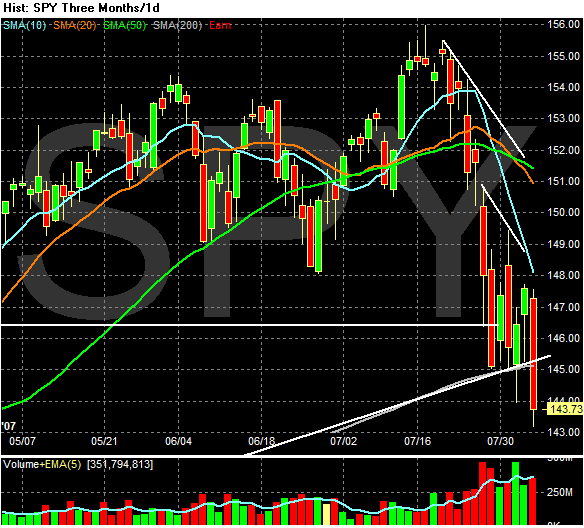
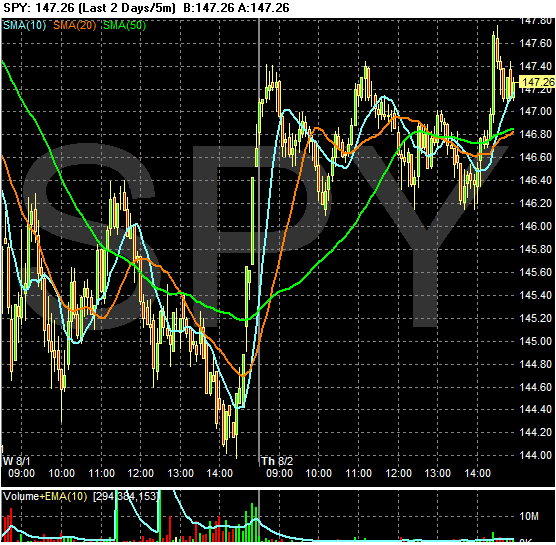
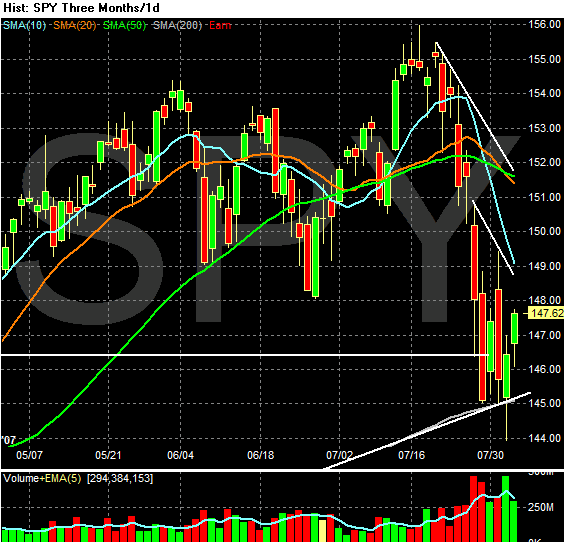
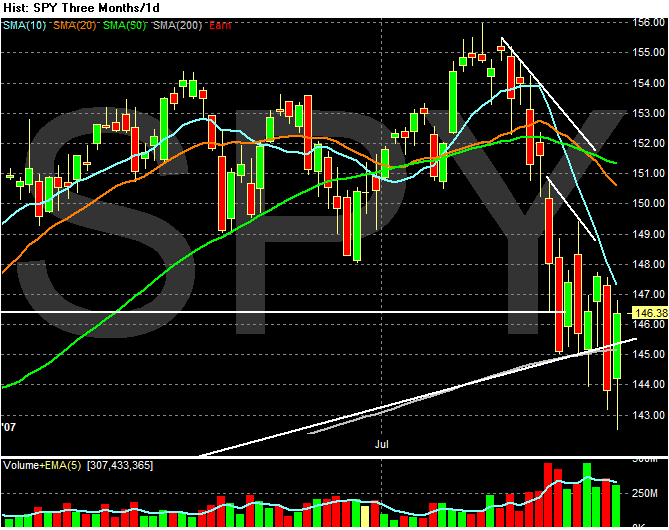
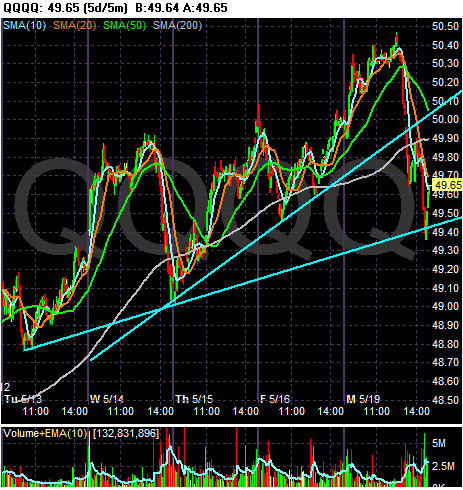
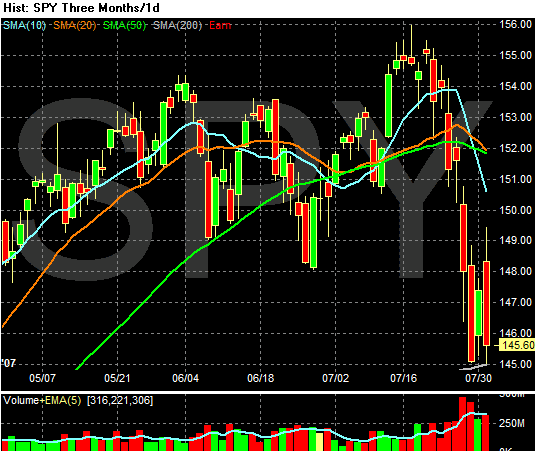
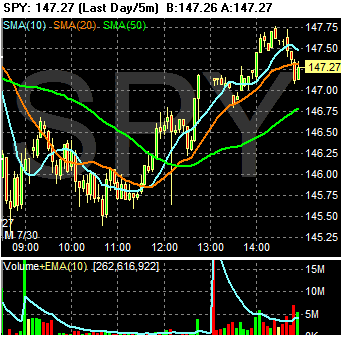
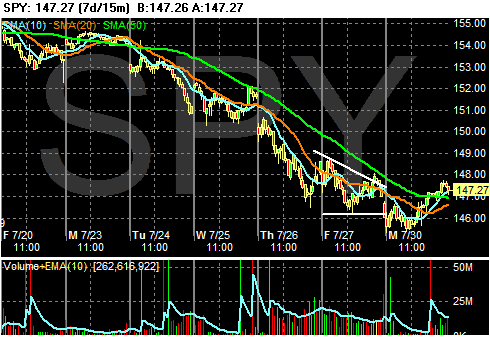
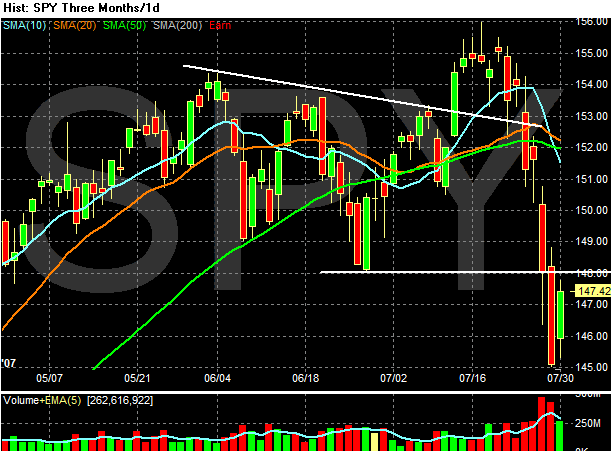
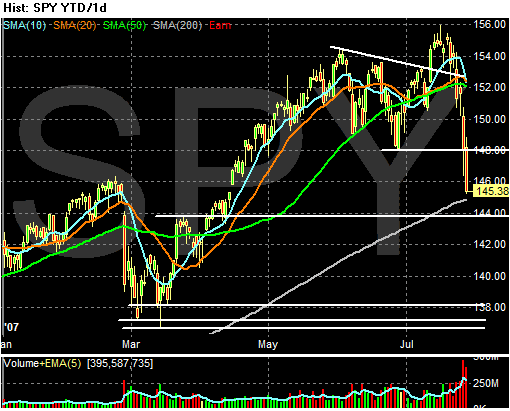
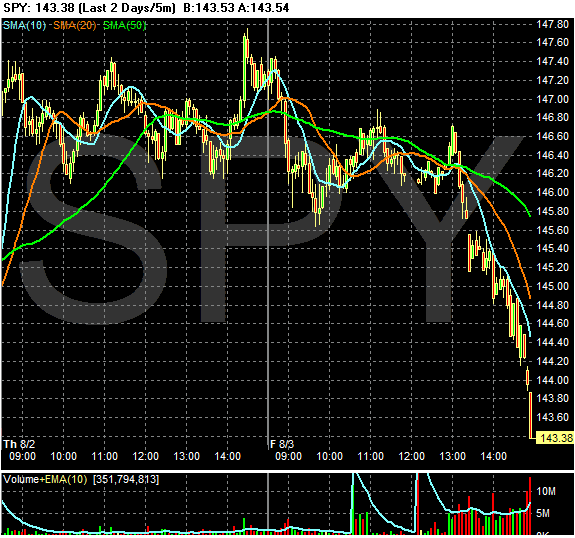
Add a credit crunch, concern about mortgage paper and a downgrade of a major Investment Bank and you get today's action. The SPYs sold off late in the day. No one wants to hold anything over the weekend for fear of what news will emerge in the next two days. Notice the heavy volume at the end of today's trading.
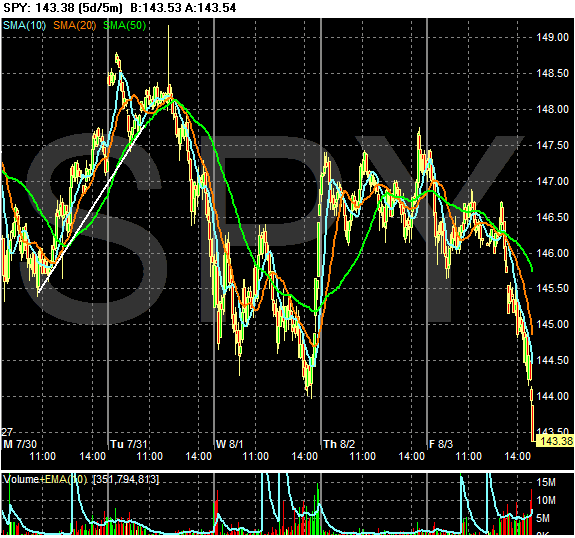
Here's the 5-day chart. The markets can't seem to maintain any upward momentum.
And here's the daily chart. We're trending lower with trade basically revolving around the 200 day SMA.
In short -- this is a very unhappy market.
On another note, I will post sporadically until Monday morning.
Have a good weekend.
Friday, August 3, 2007
The Credit Crunch is Here
From Bloomberg:
This is just what the housing market -- and the economy as a whole -- need right now.....NOT.
San Francisco-based Wells Fargo, the second-biggest U.S. home lender, has stopped issuing so-called Alt-A loans, made to people with near-prime credit ratings or to borrowers with the best credit who don't document their incomes. Memphis, Tennessee-based First Horizon has raised rates ``significantly'' on such loans in the past two weeks and is curtailing the number of loans it's making, said Pete Makowiecki, the head of its mortgage unit.
``The credit crunch is here,'' said Keith Shaughnessy, president of Foundation Mortgage Corp. in Littleton, Massachusetts.
This is just what the housing market -- and the economy as a whole -- need right now.....NOT.
Jobs Number +92,000
From the BLS:
Let's look a bit deeper into the numbers.
-- Goods producing industries dropped by 12,000. Construction employment dropped by 12,000. This shouldn't surprise anybody considering the current situation in the housing market.
-- Education/Health and Leisure and Hospitality accounted for 61,000 of the 92,000 or about 2/3 of the jobs created. These are considered low paying jobs.
These numbers came in below market expectations of about 130,000.
From Bloomberg:
From CBS.Marketwatch:
Nonfarm payroll employment continued to trend up (+92,000) in July, and the unemployment rate (4.6 percent) was essentially unchanged, the Bureau of Labor Statistics of the U.S. Department of Labor reported today. Employment grew in several service-providing industries. Average hourly earnings rose by 6 cents,or 0.3 percent.
Let's look a bit deeper into the numbers.
-- Goods producing industries dropped by 12,000. Construction employment dropped by 12,000. This shouldn't surprise anybody considering the current situation in the housing market.
-- Education/Health and Leisure and Hospitality accounted for 61,000 of the 92,000 or about 2/3 of the jobs created. These are considered low paying jobs.
These numbers came in below market expectations of about 130,000.
From Bloomberg:
Employers in the U.S. added a fewer-than-forecast 92,000 workers to payrolls last month and the jobless rate unexpectedly rose, a sign the labor market is cooling.
The increase in jobs followed a 126,000 gain in June that was smaller than previously reported, the Labor Department said today in Washington. The jobless rate rose to 4.6 percent, the first increase since April, from 4.5 percent. Wages gained 3.9 percent from a year earlier.
From CBS.Marketwatch:
The U.S. labor market softened slightly in July, according to the latest government statistics released Friday.
Nonfarm payrolls grew by a lower-than-expected 92,000 in July. This is the lowest amount of payroll jobs since February. The unemployment rate rose to 4.6%, the highest since January, the Labor Department reported Friday.
Economists were expecting payroll growth of about 133,000, according to a survey conducted by MarketWatch. The jobless rate was expected to remain at 4.5%. See Economic Calendar.
Some of the weakness came from a surprising 28,000 drop in government jobs in July. Excluding the government, private sector payrolls rose 120,000.
Home Lenders Tightening
From the WSJ:
1.) This is a really big bump in rates on a week to week basis. This is not good news.
2.) Also remember that new and existing home inventories are are very high levels. This means that demand is now dropping off at a time when supply is massively high.
3.) Decreasing demand + massive supply = lower prices.
Lenders say they are being forced to raise interest rates and stop offering certain loans because mortgage-bond investors have lost their appetite for a broad range of mortgages considered risky. That includes those dubbed Alt-A, a category between prime and subprime that often involves borrowers who don't fully document their income or assets, or those buying investment properties. Notably, American Home Mortgage Investment Corp., which stopped making loans earlier this week, said late yesterday it would cease most operations, slashing its work force to about 750 from more than 7,000.
.....
Lenders are tightening standards and "raising rates like crazy," said Melissa Cohn, chief executive of Manhattan Mortgage, a New York mortgage broker. She said Wells Fargo & Co. is charging 8% for a prime jumbo 30-year fixed-rate loan that carried a 6 7/8% rate late last week. (Jumbo loans are those too large to be sold to government-sponsored mortgage investors Fannie Mae and Freddie Mac.) A Wells spokesman said rates are lower on loans made directly by the bank than on those through brokers.
The market for mortgage-backed securities is "very panicked," Michael Perry, chief executive of IndyMac Bancorp Inc., another big lender, said in a message on the lender's Web site yesterday.
1.) This is a really big bump in rates on a week to week basis. This is not good news.
2.) Also remember that new and existing home inventories are are very high levels. This means that demand is now dropping off at a time when supply is massively high.
3.) Decreasing demand + massive supply = lower prices.
A Quick Note From Bonddad
I am in Chicago at the Yearly Kos Convention. I am chairing a panel on the middle class Saturday morning at 10:30 AM. Posting may be sporadic today. I will do my best to keep up with the market information and will definitely be here for the jobs report though.
Axa Funds See Big Drop
From Bloomberg:
Axa is going to regret that decision.
Axa SA's asset management unit told investors last week that it would allow clients to sell shares in two bond funds that had fallen in value. Axa will buy the shares and hold onto them at its own risk to avoid selling holdings at prices that it deems to be below their ``intrinsic value.''
The company's Axa World U.S. Libor Plus Fund fell 12.6 percent between July 18 and July 19, while the Axa Investment Managers Fixed Income Investment Strategies U.S. Libor Plus Fund fell 13.5 percent over the same period, the Paris-based company said on its Web site.
Hypo Real Estate Holding AG and Depfa Bank Plc, lenders that reached a takeover agreement in July, haven't been hurt by the U.S. subprime turmoil, they said today.
Axa is going to regret that decision.
German Fund Halts Redemptions
From Bloomberg:
The bad news about hedge funds just keeps coming.
Union Investment Asset Management Holding AG, Germany's third-largest mutual fund manager, halted redemptions from a fund holding subprime mortgages after clients withdrew 100 million euros ($137 million) in the past month.
The Frankfurt-based company also closed the 950 million-euro ABS-Invest Fund to new investments, spokesman Markus Temme said today. The fund, sold to institutional investors across Europe, has about 6 percent of its assets in securities related to subprime mortgage loans, Temme said.
The fund has taken the steps ``because of illiquidity in the market,'' Temme said in a telephone interview today. Union Investment, which is owned by Germany's cooperative banks, hasn't priced the fund since July 24.
The bad news about hedge funds just keeps coming.
Thursday, August 2, 2007
More Hedge Fund Problems
From the NY Post:
From MSNBC:
ones' Tudor Investment's $9 billion Raptor Fund dropped 9 percent in July when the prices of U.S. stocks exploded lower in the last two weeks of the month.
The Boston-based Raptor's loss wiped out its year-to-date gains. It is now down 2.89 percent, according to a fund official.
A spokeswoman would not comment on what led to the losses.
The other fund, Tudor's $10.3 billion Tudor BVI Fund - which he manages personally - dropped 3.1 percent in July. It is up 4.6 percent so far this year.
Despite the sharp losses, and continuing deterioration in credit and derivative markets where Jones' portfolios are active, Greenwich, Conn.-based Tudor Investments, which has $20 billion in assets, remains profitable for the year.
Meanwhile, Caxton Associates' $3 billion Global Bond Fund dropped just under 3 percent, according to Bloomberg.
From MSNBC:
US mortgage turmoil hit investor confidence on the other side of the Atlantic on Wednesday as details emerged of a German government rescue of a domestic lender that suffered heavy losses on subprime investments.
The rescue of IKB, a specialist lender based in Düsseldorf, began on Sunday when Peer Steinbrück, German finance minister, called top banking executives to discuss a bail-out. According to people who took part in the conference call, Jochen Sanio, head of Germany's financial regulator, is said to have warned of the worst banking crisis since 1931.
IKB surprised investors this week with a profits warning after a multi-billion euro fund it managed was hit by problems stemming from its US subprime exposure. The news sent its shares plunging and prompted KfW, the state-owned development bank, to step in with a pledge to guarantee obligations of more than €8bn ($10.9bn) – more than five times IKB's stock-market value.
Prudential Adds Liquidity
From Bloomberg:
Here's the central problem right now. A ton of subprime mortgages are performing badly. This is lowering the prices of a whole swath of bonds in the market. This in turn is hitting hedge funds, and we know how that has turned out.
However, if we start to see investors come in and buying distressed securities, the credit issues will start to mellow in the market. Investors will have a bit more confidence that if a hedge fund has to liquidate there will be a buyer or two on the sideline who are actually interested in buying.
This is welcome news, although we shouldn't jump for joy yet. There are still a ton of issues to deal with. For example, are there enough buyers to purchase a whole mess of securities? We don't know the amount of securities that might come to market. If we see a literal flood, expect serious losses.
What price are the buyers willing to pay? In a forced liquidation, the buyers are obviously in much stronger negotiating position to get a really cheap price.
So, let's not pop the champaign corks just yet.
Prudential Financial Inc., the second- largest U.S. life insurer, said it's still buying securities backed by subprime mortgages and expects turmoil in the market to cost the company no more than $150 million over five years.
Prices of some subprime securities rated AAA and AA are now ``disproportionate to the underlying risk and are primarily liquidity-driven,'' Prudential Vice Chairman John Strangfeld said on a conference call with analysts today. ``As a consequence, we see selective opportunities to take advantage of that.''
Prudential is capitalizing on a faltering market for mortgage bonds that's making it difficult for sellers to unload even the most highly rated securities. The secondary market ``is not functioning,'' Michael Perry, chief executive officer of Indymac Bancorp Inc., the ninth-largest mortgage lender, said in an e-mail to employees yesterday.
Here's the central problem right now. A ton of subprime mortgages are performing badly. This is lowering the prices of a whole swath of bonds in the market. This in turn is hitting hedge funds, and we know how that has turned out.
However, if we start to see investors come in and buying distressed securities, the credit issues will start to mellow in the market. Investors will have a bit more confidence that if a hedge fund has to liquidate there will be a buyer or two on the sideline who are actually interested in buying.
This is welcome news, although we shouldn't jump for joy yet. There are still a ton of issues to deal with. For example, are there enough buyers to purchase a whole mess of securities? We don't know the amount of securities that might come to market. If we see a literal flood, expect serious losses.
What price are the buyers willing to pay? In a forced liquidation, the buyers are obviously in much stronger negotiating position to get a really cheap price.
So, let's not pop the champaign corks just yet.
Today's Markets
Here is a 5-minute chart of the SPYs. Once again, the market staged a late day rally. Trading ranges like the one we had today, are symptoms of equal pressures in the market. Neither side is confident enough to make a firm bet in either direction.
Here's the daily chart. The market is bouncing off the 200-day SMA. While these late day advances add to the excitement, they do little to convince me the market is in a good place.
Yesterdays' rally appears to be the result of a "fat-thumbed trader" (a great term from Barry over at the Big Picture Blog):
"Error at the bell last night (clarification): This error at the bell last night really did contribute to the rally. Bottom line is that one of our competitors inadvertently sold 5346 too many of the SPX Sep 1450 calls and needed to cover them in a hurry. At the time the mkt was down 1% on the day.
In covering, it is likely the crowd front ran the order, exaggerating the move.
Once the move got going, the variance hedging phenomenon kicked in. Most dealers place MOC (Mark on Close) orders to hedge their daily delta risk.
If this theory holds, then they would have put in large sell orders yesterday MOC at around 3:40PM. Once the mkt started to run, their delta position would've changed from net long to net short and they would have needed to buy that much more SPX exposure into the bell. Our index trading desk predicts that for every 2 pt move up in the SPU, dealers needed to buy approx 500MM notional in delta.
With liquidity being lousy right now, that created the violent move."
What Happened At Yesterday's Close
From CNBC:
Here's what happened: fear levels are so high that traders are reluctant to even consider buying into the close. But many bulls can smell that the market is oversold, so they want to buy, but they need some signal, even a feeble one.
At 3:40 pm ET each day Market On Close (MOC) orders are posted that indicate if there are unusually high levels of buy or sell orders for individual stocks at the close. The purpose is to let market participants know what kind of orders are around and to attract buyers or sellers to imbalances. These orders are revised again at 3:50 pm
These MOC orders normally make little difference in the market close, but with fear so high investors look for some sign of what is going on. When they saw that the MOC orders were relatively benign (about even buys to sells, not heavy volume), they came in and bought heavily.
Transport Traffic Still Decreasing
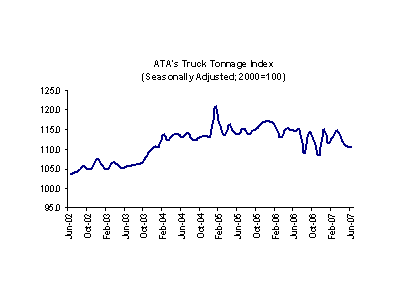
I'm a big fan of the Dow theory, largely because it makes such great sense. If the economy is growing then business will need to use more transportation resources to get its products to a variety of locations.
Right now we're seeing decreased traffic.
From the American Trucking Association:
Here's a chart from the report:
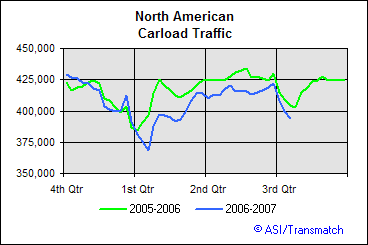
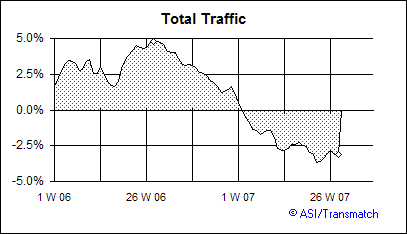
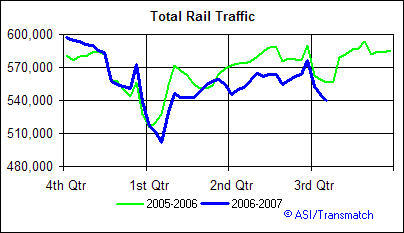
Also note that rail traffic is still below year ago levels. These charts are from Transmatch
Right now we're seeing decreased traffic.
From the American Trucking Association:
The American Trucking Associations’ advanced seasonally adjusted For-Hire Truck Tonnage Index decreased 0.1 percent in June, marking the third consecutive month-to-month drop. Tonnage fell 1.3 percent in May and has dropped 3.5 percent since March. The not seasonally adjusted index dropped 3.3 percent from May to 114.1.
On a seasonally adjusted basis, the tonnage index declined to a seven-month low of 110.5 (2000 = 100) in June from 110.6 the previous month. Compared with a year earlier, tonnage was down 3.4 percent in June, which is just a slight improvement from the 3.6 percent year-over-year decrease in May.
ATA Chief Economist Bob Costello said that while the government reported the economy grew at a 3.4 percent annualized rate in the second quarter, that strength did not filter into the transport sector. “Our tonnage index fell 1.8 percent during the second quarter from the first quarter and was 3.2 percent lower than the same quarter in 2006,” he said.
Here's a chart from the report:
Also note that rail traffic is still below year ago levels. These charts are from Transmatch
Wednesday, August 1, 2007
The Long Term View
The following charts are of the IWN, SPY, and QQQQ. They are 5 year weekly charts.
Here are the SPYs and the QQQQs. Notice each of these tracking stocks was in a price channel for about three years. Also notice both of these indexes broke out or their respective price channels. The SPYs did it in late 2006 and the QQQQs did it in the spring of 2007. These markets may simply be returning to their price channels.
The IWNs are already at the bottom of their 3 and a half year price channel. A move lower would be a very bad event.
Auto Sales Tank
From Bloomberg:
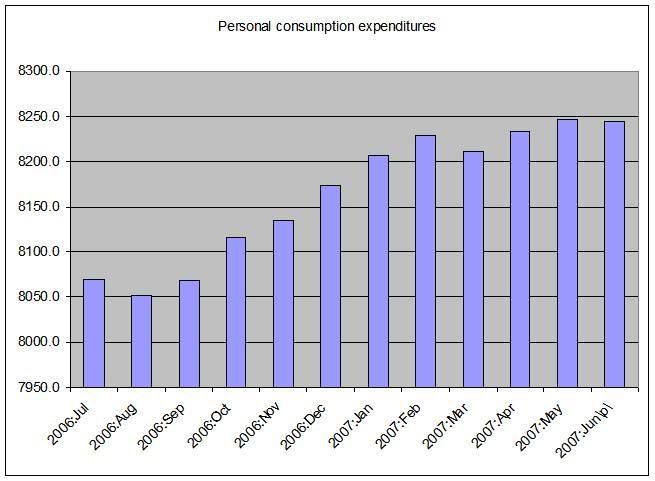
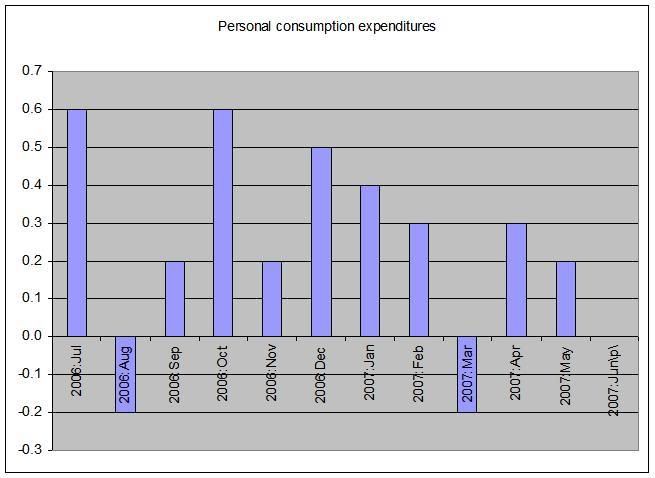
Remember this chart from yesterday? It shows that chained annual personal consumption expenditures have been stagnant for the last 5 months.
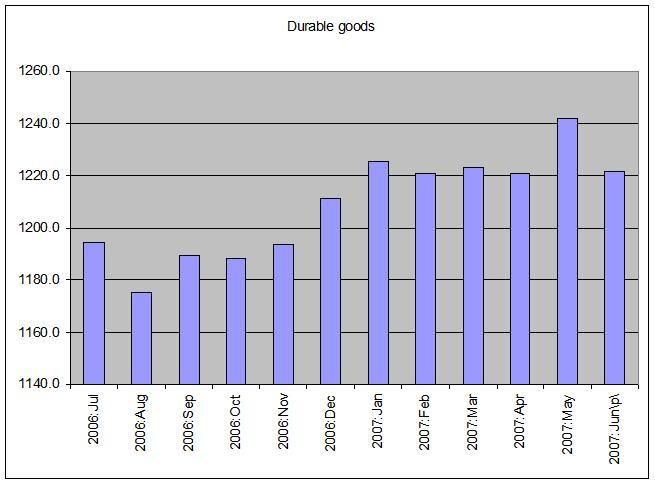
Now let's look at durable goods. The total amount of durable goods sales in chained 2000 dollars at a seasonally adjusted rate show more stagnation:
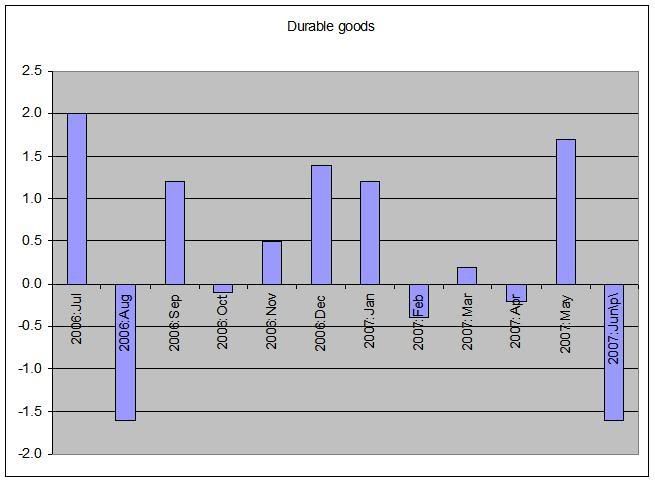
And here's the month to month percentage change.
Assuming the durable goods are a proxy for consumer confidence (because durable goods last longer and are therefore more expensive), the consumer doesn't look that happy right now.
General Motors Corp. and Ford Motor Co. said U.S. sales plunged in July, leading declines at the five largest automakers as a housing slump and gasoline prices damped demand for new cars and trucks.
GM and Ford, the two biggest, said sales slid at least 19 percent. Toyota Motor Corp. and Honda Motor Co., Japan's biggest automakers, each posted a drop of more than 7 percent from a year earlier, while DaimlerChrysler AG fell 9.1 percent.
The five largest U.S. automakers by sales hadn't posted declines in the same month since May 2005. The companies account for more than three-quarters of U.S. vehicles sold.
``No one was immune to the weaknesses in the marketplace in July,'' said Jesse Toprak, an auto analyst at Santa Monica, California-based Edmunds.com. ``The demand for new cars is not unlimited.'' The slowing U.S. housing market, he said, ``has an impact on the psychology of the consumer.''
Remember this chart from yesterday? It shows that chained annual personal consumption expenditures have been stagnant for the last 5 months.
Now let's look at durable goods. The total amount of durable goods sales in chained 2000 dollars at a seasonally adjusted rate show more stagnation:
And here's the month to month percentage change.
Assuming the durable goods are a proxy for consumer confidence (because durable goods last longer and are therefore more expensive), the consumer doesn't look that happy right now.
Today's Markets
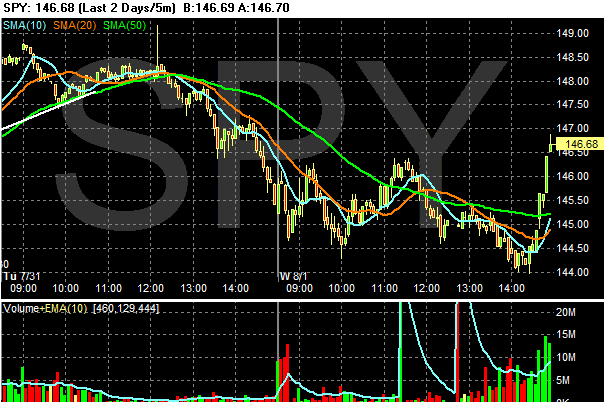
Thank god for program trading because it probably saved the market from a really bad day. Here's a 2-day, 5-minute chart that shows today's action. Notice the really big bounce we had at the end of trading. Also notice it occurred on really heavy volume. This is what program trading looks like.
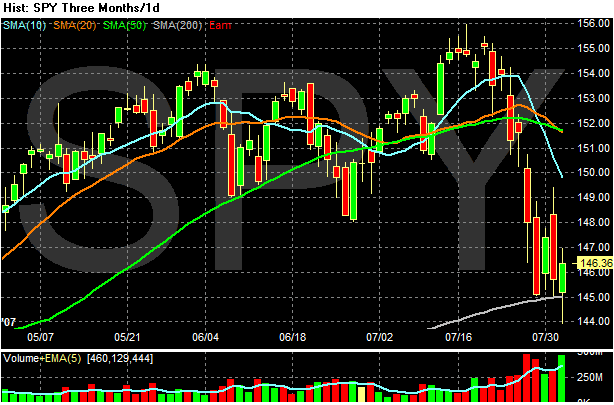
However, look at the daily chart and you'll see the market is still clinging to the 200-day SMA. Also notice the market traded below the 200 SMA for a period today. That indicates there are strong market forces that want to drive the index below that crucial support line.
Read This Blog .. Now
I forget how I found The Kingsland Report but I'm glad I did.
Read all of his stuff on the yen carry trade. And do it now.
The Weight of the Subprime Mess Is Huge
While I have been fairy neutral to slightly optimistic about the current market situation, I am formally admitting I am now bearish. Simply put, the weight of the hedge fund problem is too large for this market to overcome right now. By my count, we have seen 10 funds hit the skids: three at Bear Stearns, Sowood Capital, three funds in Australia and three in France. According to this site the total is now 18. I wasn't aware of the other 8, so I can't comment on the veracity of that sites claims. When these problems originally started hitting the news wires, I though we would see 3-5 funds die. We're already at twice that number in a month's time.
The news is coming at a faster pace right now. Two news organizations -- the Street.com and CBS.Marketwatch -- have commented on the rumors about funds that are flying on the street. My guess is there are some bid lists going around that have got some people concerned which is what is leading to the rumors.
Add to this mess the fact that banks can't sell loans right now. M&A has been a primary reason for this rally. For the last 3-4 months, we've seen entire sectors rally on the news of one takeover as traders bet on the next target. Banks ability to sell these loans made to finance these deals is now gone -- or at minimum severely limited. Lenders are asking for stricter loans terms which borrowers are balking at. All of this means the market for M&A is effectively gone for now.
And then there are the huge problems in the mortgage market right now. American Home Century's announcement that it was for all practical purposes insolvent should spook everybody. As the Kingsland Report noted:
According to the Implode-o-meter, we've seen 105 mortgage companies/lenders etc... close their doors, or experience a seriously big financial problem. That indicates how broad the far reaching the problem is.
In short -- this news indicates there are problems happening right up there in the food chain.
The point of all this is it looks as though we are moving closer and closer to the edge of the cliff.
Right now the only way to reverse this situation is for the negative news to stop for an extended period of time. Off the top of my head, I would guess at least a month, but a few weeks at bare minimum. This would allow the markets to take a breather from the news and reassess the situation. But so long as this pace of news keeps coming, we've got serious problems. There is only so much stress a financial system can take. And my guess is we're pretty close to the limit for now.
The news is coming at a faster pace right now. Two news organizations -- the Street.com and CBS.Marketwatch -- have commented on the rumors about funds that are flying on the street. My guess is there are some bid lists going around that have got some people concerned which is what is leading to the rumors.
Add to this mess the fact that banks can't sell loans right now. M&A has been a primary reason for this rally. For the last 3-4 months, we've seen entire sectors rally on the news of one takeover as traders bet on the next target. Banks ability to sell these loans made to finance these deals is now gone -- or at minimum severely limited. Lenders are asking for stricter loans terms which borrowers are balking at. All of this means the market for M&A is effectively gone for now.
And then there are the huge problems in the mortgage market right now. American Home Century's announcement that it was for all practical purposes insolvent should spook everybody. As the Kingsland Report noted:
So we go from the west coast blow ups of subprime names like New Century to a big fish on the east coast which specialize in near prime (Alt-A) and prime lending. AHM was not a fly by night company, it was a top-10 mortgage company with a Q1 book value of over $20 bln. It is based in Melville, NY (Long Island) where a variety of money center banks have back office operations. It had over 7,000 employees, nearly 1,500 in Melville.
According to the Implode-o-meter, we've seen 105 mortgage companies/lenders etc... close their doors, or experience a seriously big financial problem. That indicates how broad the far reaching the problem is.
In short -- this news indicates there are problems happening right up there in the food chain.
The point of all this is it looks as though we are moving closer and closer to the edge of the cliff.
Right now the only way to reverse this situation is for the negative news to stop for an extended period of time. Off the top of my head, I would guess at least a month, but a few weeks at bare minimum. This would allow the markets to take a breather from the news and reassess the situation. But so long as this pace of news keeps coming, we've got serious problems. There is only so much stress a financial system can take. And my guess is we're pretty close to the limit for now.
Three More Funds Go Under
From Bloomberg:
Oddo & Cie, a French stockbroker and money manager, plans to close three funds totaling 1 billion euros ($1.37 billion), citing the ``unprecedented'' crisis in the U.S. asset-backed securities market.
Oddo said it will wind down the funds within the ``shortest possible time frame'' because of a plunge in prices for collateralized debt obligations, notes backed by other bonds, loans and their derivatives.
The highest level of defaults in 10 years on U.S. mortgages drove the risk premium on corporate bonds in Europe to the widest in at least three years yesterday, based on prices for credit-default swaps. Commerzbank AG, Germany's second-biggest bank by assets, yesterday said it expects to make provisions of about 80 million euros for potential loan losses tied to the U.S. subprime mortgage market, and IKB Deutsche Industriebank AG in Dusseldorf said it was scrapping its earnings forecast as ``massive uncertainty'' threatens access to funding.
``Like many actors, we have tried to revitalize the performance of our funds by investing in CDOs,'' Arnaud Ploix, a spokesman for Paris-based Oddo, said in an interview today. ``Like others, we noticed recent problems with short-term liquidity and were caught out by the subprime dilemma.''
Third Austrailian Fund Has Big Losses
From the WSJ:
Look at those leverage amounts -- 5 and 6 to 1. Those are levels where you are asking for trouble.
Volatility in global credit markets has hit another Australian high-yield fund, Macquarie Bank Ltd.'s Fortress Investments Ltd., which said that investors in the funds face losses of up to 25%.
Fortress is the third fund manager in Australia to flag serious problems and is the latest sign that the fallout from U.S. subprime mortgage sector woes is spreading ever wider. Australia has the largest hedge-fund industry in Asia, according to the Australian government, and Australian hedge funds have been some of the first to say that the global widening in yield spreads has cut deep into their value.
Investors in Fortress had put in 220 million Australian dollars (US$188 million), which was then leveraged to create a fund of between A$1.2 billion and A$1.3 billion, according to Fortress. The funds weren't directly exposed to U.S. subprime mortgages, but problems in that sector have pushed down the value of riskier investments in credit markets generally.
Look at those leverage amounts -- 5 and 6 to 1. Those are levels where you are asking for trouble.
Tuesday, July 31, 2007
Third Bear Fund Has Problems
From the WSJ:
And the hits just keep coming, don't they?
Bear Stearns Cos., already forced to shut two hedge funds that bet heavily on the risky subprime-mortgage market, is now facing big losses in a third fund that has roughly $900 million in mortgage investments, according to people familiar with the matter.
The fund, known as the Bear Stearns Asset-Backed Securities Fund, ran into trouble in July and has refused to return investors' money for the moment, according to these people. One of these people said the redemption requests were postponed in hopes that the fund's assets would rebound in value. The fund contains a range of mortgages, but only a small slice of them that are considered subprime, the area that has given so many firms heartburn in recent weeks. Unlike the two other Bear funds that are being closed, this fund is not leveraged.
The asset-backed fund was up about 5% between the beginning of the year and the end of June according to these people. But faced with a slew of mortgage markdowns in July, its performance appears to have plummeted. It is not known how much, if anything, Bear owns of the fund. Its shares were down about 5% Tuesday, to $121.22.
And the hits just keep coming, don't they?
Market Takes Another Dive
The reason?
And here's the result:
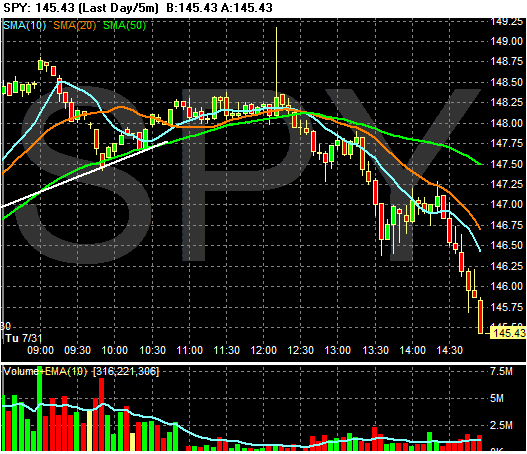
Let's see what the charts look like. The daily, 5-minute chart shows the damage from the announcement. The only good thing about this chart is the lack of big volume spikes on the way down.
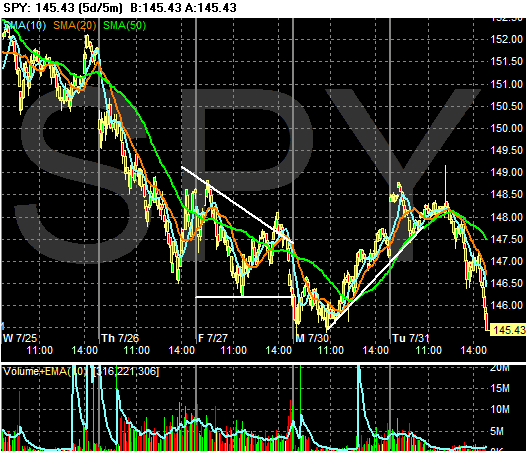
Here's the 5-day, 5-minute chart. We're right back where we were at the beginning of the week.
And here's the three month chart. Again, about the only good thing about today's sell-ff is the volume spike wasn't as high as the end of last week and the SPYs are still above the 200-day SMA.
American Home Mortgage Investment Corp. shares plunged 90 percent after the lender said it doesn't have cash to fund new loans, stranding thousands of home buyers and putting the company on the brink of failure.
Investment banks cut off credit lines, leaving American Home without money yesterday for $300 million of mortgages it had already promised, the Melville, New York-based company said in a statement today. It anticipates that $450 million to $500 million of loans probably won't get funded today, and the lender may have to sell off its assets.
``They can't function without access to capital,'' said Bose George, an analyst with KBW Inc. in New York. ``The company either has to file for bankruptcy or go through some type of rescue or restructuring, and either way will leave almost nothing for the common shareholders.''
And here's the result:
U.S. stocks fell after troubled American Home Mortgage Investment Corp. said it lacks cash to fund new loans and traders speculated Apple Inc. will cut production of its widely touted iPhone. The Standard & Poor's 500 Index posted its biggest monthly decline in three years.
Lehman Brothers Holdings Inc., Bear Stearns Cos. and Goldman Sachs Group Inc. led the brokerage industry to a 10-month low because the prospect of American Home liquidating assets threatened to depress the value of mortgage securities traded on Wall Street. The concern that Apple overestimated demand for its unique mobile telephone helped send the S&P 500 Information Technology Index to its lowest level since March.
The Dow Jones Industrial Average erased a gain of 140 points and fell 146.32, or 1.1 percent, to 13,211.99. The S&P 500 slipped 18.64, or 1.3 percent, to 1455.27. The Nasdaq Composite Index slumped 37.01, or 1.4 percent, to 2546.27.
``Anyone invested in the market is struggling because their portfolio is underperforming and they are wondering how long this is going to last,'' said Sam Rahman, who oversees $1.3 billion as head of U.S. equities at Baring Asset Management Inc. in Boston.
Let's see what the charts look like. The daily, 5-minute chart shows the damage from the announcement. The only good thing about this chart is the lack of big volume spikes on the way down.
Here's the 5-day, 5-minute chart. We're right back where we were at the beginning of the week.
And here's the three month chart. Again, about the only good thing about today's sell-ff is the volume spike wasn't as high as the end of last week and the SPYs are still above the 200-day SMA.
Construction Spending Decreaces .3%
From the Census Bureau
In billions, total construction spending dropped .3%, from a seasonally adjusted annual rate of $1,178,436 to $1,175,425. Nonresidential spending increase .1% while residential spending dropped .7%.
On the nonresidential side, the biggest drop occurred in communication construction, which dropped 2.2%. Power construction dropped 1.3% and highway/street construction dropped 1.1%.
It's important to recognize that nonresidential spending has increased from 46% of total construction spending a year ago to 53% last month. This is probably a primary reason why construction employment had not dropped despite the drop in residential construction.
Consumer Spending Slowing, Core Inflation Tame
From Bloomberg:
From CBS:
Expect to start hearing more talk about a Fed rate cut because of these inflation numbers. I still don't think that is a possibility right now. The Fed is still focusing on inflation and monitoring all incoming data.
There are two charts that are really important from this report. The first is the total dollar amount of personal consumption expenditures at seasonally adjusted annual rates. The amounts are expressed in 2000 chained dollars. Notice they have pretty much stagnated over the last 5 months.
Here is the month-to-month percentage change in chained 2000 dollar PCEs. Notice how these numbers are also slowing.
Consumer spending grew 1.5% in the last GDP report. If we continue to see these kind of numbers, don't expect an increase in the near future.
Consumer spending in the U.S. increased in June at the slowest pace in nine months as near- record gasoline prices and falling home values forced Americans to cut back.
The 0.1 percent rise in spending followed a 0.6 percent increase in May, the Commerce Department said today in Washington. The increase matched the median forecast of economists surveyed by Bloomberg News. The Federal Reserve's preferred measure of inflation rose less than forecast.
Consumer spending, which accounts for more than two-thirds of the economy, will cede its role as a mainstay of the expansion as increases in exports and business investment propel a rebound in manufacturing. At the same time, more jobs and rising incomes will prevent spending from slowing even more, economists said.
From CBS:
Core consumer inflation increased 0.1% for the fourth consecutive month in June, pushing the yearly gain in core inflation down to the lowest level in three years, the Commerce Department said Tuesday.
The core personal consumption price index rose 1.9% in the past year, the lowest inflation since early 2004, and just within the Federal Reserve's unofficial comfort zone of 1% to 2% for core inflation. Core inflation excludes volatile food and energy prices. Read the full government report.
Overall inflation also increased 0.1% in June, the lowest monthly inflation since November. Overall inflation is up 2.3% in the past year.
Expect to start hearing more talk about a Fed rate cut because of these inflation numbers. I still don't think that is a possibility right now. The Fed is still focusing on inflation and monitoring all incoming data.
There are two charts that are really important from this report. The first is the total dollar amount of personal consumption expenditures at seasonally adjusted annual rates. The amounts are expressed in 2000 chained dollars. Notice they have pretty much stagnated over the last 5 months.
Here is the month-to-month percentage change in chained 2000 dollar PCEs. Notice how these numbers are also slowing.
Consumer spending grew 1.5% in the last GDP report. If we continue to see these kind of numbers, don't expect an increase in the near future.
A Summary Of Yesterday's Subprime Action
From the LA Times:
• Mortgage insurers MGIC Investment Corp. and Radian Group Inc. said they might write off their combined $1.03-billion stake in a venture that invests in sub-prime mortgages on which payments were past due.
• American Home Mortgage Investment Corp., which lends to people close to the sub-prime category, postponed payment of its dividend, took "major" write-downs and said its lenders were demanding that it put up more cash. Its stock plunged 39%.
• Insurer CNA Financial Corp. wrote down $20 million in sub-prime-backed securities.
• A German bank with U.S. sub-prime exposure cut its profit forecast and replaced its chief executive.
Foreclosures Increasing At High Rates
From the AP:
In all, 573,397 properties across the nation reported some sort of foreclosure activity in the first half of this year, including receiving notices of default, auction sale notices or being repossessed by lenders, Irvine-based RealtyTrac Inc. said.
That was 58 percent higher than the 363,672 properties in the first six months of 2006 and 32 percent higher than the 433,504 in the last six months of 2006.
"We could easily surpass 2 million foreclosure filings by the end of the year, which would represent a year-over-year increase of over 65 percent," said RealtyTrac CEO James J. Saccacio.
We've Still Got Problems
From the WSJ:
And from the WSJ:
We're going to be hearing stories like this for the foreseeable future. The question now becomes will these stories have an impact on trading sentiment? There is no firm answer for that. On one hand, the markets are now more braced for news like this, but on the other hand there is a limit to how much bad news a market can take. Add to that the temperamental nature of the investing public -- especially during volatile news periods -- and you have a rough patch ahead.
I've said that I expect the markets to weather the subprime storm, but there will be at least 3-5 big casualties. Now we have two big casualties.
The last sentence in the first article is key. So long as illiquid funds can be purchased by vulture investors, we'll be fine. Note how quickly that transaction occurred. My guess is there were a few harried back-phone calls, but everything eventually ended up OK.
Sowood Capital Management told its investors that the hedge-fund firm suffered dramatic losses of more than 50% this month and that it will wind down its two funds -- becoming the most high-profile player to be cut down by the troubles roiling many parts of the bond market.
The losses dropped the Boston hedge-fund firm's assets to about $1.5 billion from what had been $3 billion, the firm told investors in a letter. Sowood, which was started by Jeffrey Larson, who helped pick investments for Harvard Management Co. before launching his own hedge-fund firm, said it will distribute its remaining cash to investors, closing down the hedge-fund firm.
.....
The Citadel transaction, likely worth hundreds of millions of dollars, is a sign that for all the recent troubles in the markets, and losses at a number of big investors, there remains ample money on the sidelines waiting to step in to buy cheap assets. That is potentially bullish for the markets.
And from the WSJ:
GMAC Financial Services, General Motor Corp.'s part-owned financing arm, reported a 63% drop in second-quarter profit as its Residential Capital LLC home-lending unit weighed on results, though the losses from the unit narrowed markedly from the first quarter.
The company, which significantly scaled back its nonprime portfolio during the quarter, said it expects continued improvement in earnings performance in the second half.
"We are encouraged to see that the aggressive risk-mitigation initiatives implemented in the first half of this year have reduced ResCap's losses -- quickly and significantly -- despite increasing challenges in the U.S. mortgage market," said GMAC Chief Executive Eric Feldstein.
We're going to be hearing stories like this for the foreseeable future. The question now becomes will these stories have an impact on trading sentiment? There is no firm answer for that. On one hand, the markets are now more braced for news like this, but on the other hand there is a limit to how much bad news a market can take. Add to that the temperamental nature of the investing public -- especially during volatile news periods -- and you have a rough patch ahead.
I've said that I expect the markets to weather the subprime storm, but there will be at least 3-5 big casualties. Now we have two big casualties.
The last sentence in the first article is key. So long as illiquid funds can be purchased by vulture investors, we'll be fine. Note how quickly that transaction occurred. My guess is there were a few harried back-phone calls, but everything eventually ended up OK.
Monday, July 30, 2007
Today's Market Action
OK -- We had a nice rebound in the market today. Here's a 5-minute chart of today's action. The market started rallying about 11 AM. It sold-off a bit at the end, but that's to be expected after a strong rally like today's.
But let's not get ahead of ourselves. Here's a 7-day 10-minute chart. It shows that today's action was a nice upswing, but we have a lot of ground to make-up.
And here's the daily chart. We had decent volume, but the last two days we had a ton of selling, so today's action should be placed in that perspective. The index did rebound off its 200 day SMA which is a good sign. But today's action can be attributed as much to a technical bounce as anything. We need to see how the week plays out before we start popping the champaign corks.
GDP Report Leads To Questions About Future Growth
On Friday, the BEA reported that second quarter GDP came in at 3.4%. Now it appears the debate is if this pace is sustainable.
There are a few points to make regarding this debate.
1.) Probably the best way to look at the second quarter GDP report is to combine it with the first quarter number and average the results. This would give us growth of about 2%, which seems the most likely real underlying rate of growth.
2.) Second quarter growth got a big boost from government spending increases, which accounted for .82 of the 3.4% growth. In addition, there was a huge bump in nonresidential investment. These rates of growth aren't going to repeat in the third quarter.
4.) Personal consumption expenditures increased 1.5%. This is the result of high gasoline prices.
To an extent, I agree with this analysis. Gasoline prices are very cyclical, rising in the summer and falling in the winter. However, this year the country had very high gas prices in the Spring. They rose very quickly and to very high levels starting in about February. Wal-Mart and other low-income targeting retailers mentioned these prices in their respective earnings reports. WM has started to mention high gas prices in their ads. The point here is gas prices broke with their usual cyclical pattern, rising when consumers weren't expecting them to rise. Now we're in the increasing part of the cycle when consumers are expecting higher gas prices. In addition, prices have come down a bit, although they are still high. This could have a somewhat positive effect on consumer behavior.
On the negative side of consumer spending, we now have a volatile stock market. Will the market dampen consumer sentiment? The chances are it will have an impact, but the degree remains to be seen. Frankly, what happens over the next few weeks will be very important from this perspective. If the decline is short lived, the chances it will impact consumer sentiment are small. But the longer this lasts and the more volatile it is, the more pronounced the effect on consumer behavior.
And there is housing, which has been declining for over a year and shows no signs of forming a bottom anytime soon. Inventory levels are at all time highs and credit is contracting. Frankly, I've been surprised this hasn't had a negative impact on consumer spending over the last year. However, this housing slowdown is somewhat atypical. Usually the economy slows, which leads to a faltering housing market. This time around, the housing slowdown happened during an economic expansion. This may have limited the downward economic pressure from the housing slowdown. But now that GDP growth has slowed, housing may start to increase in prominence from a consumer spending perspective.
Here's a good summation of the consumer spending situation:
3.) Net exports added 1.18 of the 3.4% increase. While this number might not come in as high in the third quarter, the dollar is cheap and other economies are growing. There is no reason to expect this number to not add positively to GDP in the third quarter.
4.) Business spending outside of structures added just .17 to the 3.4% number. This is a very weak area of the economy and runs counter to what some people have been arguing would happen (including myself). Although business balance sheets are in good shape, corporate boards may move to a more conservative perspective, arguing to ride out the weak domestic economy with their high levels of cash rather than increase money on expenditures. This would make a great deal of sense for most companies.
There are a few points to make regarding this debate.
1.) Probably the best way to look at the second quarter GDP report is to combine it with the first quarter number and average the results. This would give us growth of about 2%, which seems the most likely real underlying rate of growth.
2.) Second quarter growth got a big boost from government spending increases, which accounted for .82 of the 3.4% growth. In addition, there was a huge bump in nonresidential investment. These rates of growth aren't going to repeat in the third quarter.
Stronger investment in nonresidential structures, up 22.1%, and government spending, up 4.2%. Neither of these are remotely sustainable.
4.) Personal consumption expenditures increased 1.5%. This is the result of high gasoline prices.
Don’t read too much into the sharp moderation in real consumer spending — it is entirely attributable to the spike in gasoline prices… While the housing market is likely to show further deterioration, the biggest source of uncertainty in the outlook at this point is actually the future direction of gasoline prices.
To an extent, I agree with this analysis. Gasoline prices are very cyclical, rising in the summer and falling in the winter. However, this year the country had very high gas prices in the Spring. They rose very quickly and to very high levels starting in about February. Wal-Mart and other low-income targeting retailers mentioned these prices in their respective earnings reports. WM has started to mention high gas prices in their ads. The point here is gas prices broke with their usual cyclical pattern, rising when consumers weren't expecting them to rise. Now we're in the increasing part of the cycle when consumers are expecting higher gas prices. In addition, prices have come down a bit, although they are still high. This could have a somewhat positive effect on consumer behavior.
On the negative side of consumer spending, we now have a volatile stock market. Will the market dampen consumer sentiment? The chances are it will have an impact, but the degree remains to be seen. Frankly, what happens over the next few weeks will be very important from this perspective. If the decline is short lived, the chances it will impact consumer sentiment are small. But the longer this lasts and the more volatile it is, the more pronounced the effect on consumer behavior.
And there is housing, which has been declining for over a year and shows no signs of forming a bottom anytime soon. Inventory levels are at all time highs and credit is contracting. Frankly, I've been surprised this hasn't had a negative impact on consumer spending over the last year. However, this housing slowdown is somewhat atypical. Usually the economy slows, which leads to a faltering housing market. This time around, the housing slowdown happened during an economic expansion. This may have limited the downward economic pressure from the housing slowdown. But now that GDP growth has slowed, housing may start to increase in prominence from a consumer spending perspective.
Here's a good summation of the consumer spending situation:
"Maybe the equilibrium we had where jobs, wages and equities were offsetting the negatives of higher energy price and housing head winds has shifted to where we move to a slower growth profile for consumer spending," Gregory said. "We'll see in the next month or two, but that's definitely the risk that's out there."
3.) Net exports added 1.18 of the 3.4% increase. While this number might not come in as high in the third quarter, the dollar is cheap and other economies are growing. There is no reason to expect this number to not add positively to GDP in the third quarter.
4.) Business spending outside of structures added just .17 to the 3.4% number. This is a very weak area of the economy and runs counter to what some people have been arguing would happen (including myself). Although business balance sheets are in good shape, corporate boards may move to a more conservative perspective, arguing to ride out the weak domestic economy with their high levels of cash rather than increase money on expenditures. This would make a great deal of sense for most companies.
Sunday, July 29, 2007
Earnings Growth Is Good
From Bloomberg:
Earnings among the 313 members of the S&P 500 that reported second-quarter results rose 9.7 percent, twice the average of analysts' estimates on July 13. One hundred one members are scheduled to report results this week.
Let's See Where Support For the SPYs Is
Just as a point of reference, I use the SPYs as a proxy for the market. The Dow is simply too narrow. In a universe of over 10,000 stocks, 30 just isn't large enough. The S&P 500 is, well, 500 stocks and is a much better proxy for the market overall.
Here's the chart we're working with. It's a 6 month SPY chart.
Considering last week's sell-off, let's look at the market to see where support is.
-- Let's use the 5%-10% range as a standard bull market correction.
-- The SPYs stopped out at about 155. 5% of that is 7.75 points. That means a 5% correction would be 147.25, which we went through on Thursday, and which we closed below on Friday.
-- 10% of that is 15.5, so a drop of 10% would send the market to about 139.50. Notice we have the support from the March lows about a point and a half below that number.
Let's add come complicating factors.
-- The SPY is already looking at the 200 day SMA as support. Standard TA is bull markets are over the 200 day SMA and bear markets are below the 200 day SMA. We've been below the 200 day SMA twice in the last two years and rebounded.
-- The SPYs are way below the 10, 20 and 50 day SMA. That means a few things.
-- The shorter SMAs are in danger of dropping below the longer SMAs, adding further downward pull to the market. The 10 day SMA will for all practical purposes move below the 20 and 50 day SMAs soon. How long that lasts is anybody's guess.
-- Volume has been really heavy, indicating we have probably witnessed some sort of selling climax.
-- The markets look oversold right now. Expect a technical bounce, probably from near the 200 day SMA.
Here's the chart we're working with. It's a 6 month SPY chart.
Considering last week's sell-off, let's look at the market to see where support is.
-- Let's use the 5%-10% range as a standard bull market correction.
-- The SPYs stopped out at about 155. 5% of that is 7.75 points. That means a 5% correction would be 147.25, which we went through on Thursday, and which we closed below on Friday.
-- 10% of that is 15.5, so a drop of 10% would send the market to about 139.50. Notice we have the support from the March lows about a point and a half below that number.
Let's add come complicating factors.
-- The SPY is already looking at the 200 day SMA as support. Standard TA is bull markets are over the 200 day SMA and bear markets are below the 200 day SMA. We've been below the 200 day SMA twice in the last two years and rebounded.
-- The SPYs are way below the 10, 20 and 50 day SMA. That means a few things.
-- The 10, 20 and 50 day SMAs all have a downward pull for the foreseeable future.
-- The SMAs will become technical resistance rather than support
-- The shorter SMAs are in danger of dropping below the longer SMAs, adding further downward pull to the market. The 10 day SMA will for all practical purposes move below the 20 and 50 day SMAs soon. How long that lasts is anybody's guess.
-- Volume has been really heavy, indicating we have probably witnessed some sort of selling climax.
-- The markets look oversold right now. Expect a technical bounce, probably from near the 200 day SMA.
Subscribe to:
Posts (Atom)