Showing posts with label Philly Fed. Show all posts

Friday, June 19, 2009

Philly Fed Shows Improvement

Click on all images for a larger image


There are several points from the above data:

1.) There are now two months of solid increased (the lower gray lines). While this is not strong enough to call a trend, it does indicate that activity has increased over the last two months. This has probably led to an increase in the future expectations.

2.) Notice the big bump in new orders, shipping and overall activity. Those are welcome changes. However, also notice that employment and hours worked are still hovering at low levels. That means we haven't seen enough strong and continuous activity to see movement, indicating there is still a fair amount of caution about longer term prospects right now. That makes a great deal of sense considering we've only seen two months of solid improvements.

Because of their geographic proximity, here is a link to the latest NY Fed report. Remember it fell a bit this month, but has been in an uptrend for a few months before that indicating the NY area may be just a bit ahead of Philly.

Friday, April 17, 2009

New York and Philly Fed Indexes

From Econoday. Click for a larger image.


From the NY Fed:

The Empire State Manufacturing Survey indicates that conditions for New York manufacturers continued to deteriorate in April, but at a much slower pace than in recent months. The general business conditions index climbed 24 points from its March record low, to -14.7. The new orders index shot up 41 points to a reading just below zero, and the shipments index rose 25 points, also reaching a level near zero. The inventories index continued to fall, hitting a record low -36.0. The indexes for both prices paid and prices received remained negative. The index for number of employees, while negative, improved in April, but the average workweek index fell. Future indexes were much improved, with the future general business conditions, new orders, and shipments indexes rising sharply to levels not seen since September of last year. The capital spending and technology spending indexes remained below zero, although they were considerably above last month’s levels.


Let's take this in pieces:

-- Referring to the chart above, the gray line was decreasing for 7 months, albeit not continually. That means the latest news is counter-trend. Before we get excited about the change in direction, remember we need additional data to day things are definitely better.

-- The general change is encouraging; a jump of 24 points is good news.

-- In addition, the jump in new orders and shipments is also encouraging. However it's one months worth of data.

-- The continued drop in inventories is also encouraging because it indicates people are getting more and more "down to the bone" and will be forced to by simply to have a few items in stock.

Here is the summation paragpaph from the Philly Fed report. Click for a larger image


The survey has similar points as the New York Fed's Report:

-- The overall index increased. BUT as the chart at the top of this post notes we're still at low levels. The line that represents the Philly index does appear to be bottoming, but we need more data and a strong and continued move higher to say for sure. In addition, the index has been negative for 16 of the last 17 months.

-- While the new order number rose, the shipments number decreased.

-- The future expectations index has been positive for the last 4 months. However, it's easy for people to say "things will get better". It's a good sign , but take it with a grain of salt.

There are encouraging signs. BUT -- the data points supporting that statement aren't numerous. Instead they are one or a few months worth of data. So keep that in mind when reading them.

Thursday, December 18, 2008

Manufacturing Tanking Hard

We've had all the monthly manufacturing data released. The news is terrible.

Let's start with the ISM manufacturing survey. Here is the relevant graph:


Click for a larger image

Notice the index as dropped off a cliff over the last two months. Consider the following from the report:

PERFORMANCE BY INDUSTRY

The two industries reporting growth in November — listed in order — are: Apparel, Leather & Allied Products; and Paper Products. The industries reporting contraction in November are: Nonmetallic Mineral Products; Fabricated Metal Products; Textile Mills; Printing & Related Support Activities; Machinery; Electrical Equipment, Appliances & Components; Primary Metals; Transportation Equipment; Furniture & Related Products; Plastics & Rubber Products; Computer & Electronic Products; Chemical Products; Petroleum & Coal Products; Miscellaneous Manufacturing; Food, Beverage & Tobacco Products; and Wood Products.

WHAT RESPONDENTS ARE SAYING ...

* "The only positive thing of late is that the U.S. dollar has strengthened significantly against other currencies. We import the majority of our materials so this will have the effect of lowering our COGS." (Transportation Equipment)
* "Steel industry is our main customer, and they have had a real slowdown." (Computer & Electronic Products)
* "Criteria for projects is significantly higher with very short ROI periods." (Food, Beverage & Tobacco Products)
* "We have revised downward our top-line sales estimates for CY2009 by 8 percent due to the continued softness we see in the housing sector." (Machinery)
* "Suppliers are trying to hold onto pricing, but petrochemical and commodity prices are dropping like a rock." (Plastics & Rubber Products)


And consider the historic nature of the problem:

The contraction underway in the manufacturing sector is of historic proportions, the results of November's ISM manufacturing report that shows a headline index of 36.2, down nearly 3 points in the month. The reading is the lowest since 1980 recession. Key components in the survey show greater weakness than the headline index including a 31.5 level for the production index that matches the record low in May 1980. New orders at 27.9 is at its lowest since the early 80s while, in perhaps the most stunning reading of all, prices paid is at 25.5, down 11.5 points in the month for the lowest reading since early data in 1949 -- a critical indication that demand is falling and falling very sharply.


Notice that only two industries expanded whereas 16 contracted. Sales reports are being downgraded and the criteria for projects is increasing. Simply put -- things are bad. Also note we are at lows not seen since the 1980s. That is not a comparison anyone wants to make.

Overall industrial production is also down. From the Federal Reserve:

Industrial production decreased 0.6 percent in November with declines widespread across industries. The drop in output in September was revised down, and the rebound in October was revised up, in large part because both the decrease due to the September hurricanes and the subsequent partial recovery in October were larger than previously reported.

Manufacturing production dropped 1.4 percent in November despite the resumption of activity in the commercial aircraft industry after the resolution of a strike early in the month. The output of mines advanced 2.5 percent, primarily as a result of a further post-hurricane recovery in crude oil and natural gas operations in the Gulf of Mexico. Taken together, the rebounds after the strike and the hurricanes added almost 1 percentage point to the change in industrial production. The output of utilities rose 1.6 percent.

At 106.1 percent of its 2002 average, total industrial production in November was 5.5 percent below its level of a year earlier. The capacity utilization rate for total industry fell to 75.4 percent, a level 5.6 percentage points below its average level from 1972 to 2007.


Here are the relevant graphs:


Click for larger images

The year over year number is a big concern. Also note that capacity utilization is leveling at a lower level than the level we've had for the last few years. The bottom line is we're slowing down.

The New York area's manufacturing index is also in very bad shape:

The Empire State Manufacturing Survey indicates that conditions for New York manufacturers deteriorated significantly in December. The general business conditions index, at -25.8, held near the record low set in November. The new orders and shipments indexes also remained near their recent record lows, and the unfilled orders index dropped to a new low. The indexes for prices paid and prices received fell below zero, and employment indexes remained deep in negative territory. Future indexes remained subdued, with the capital spending and technology spending indexes remaining well below zero.


The graph shows the severity of the slowdown:


Click for a larger image

Again -- this is a significant decline which happened quickly. In indicates the slowdown is extreme, sharp and very sudden.

Finally there is the Philadelphia survey:

Conditions in the region's manufacturing sector continued to deteriorate this month, according to firms polled for the December Business Outlook Survey. All of the survey's broad indicators remained negative this month and at relatively low levels. Firms reported declines in input prices and the prices for their own manufactured goods this month. Consistent with the weakness in current activity, most of the survey's indicators of future activity slid further into negative territory, suggesting that the region's manufacturing executives expect continued declines over the next six months.


Here is the relevant graph:


There is no good news in any of these releases. Simply put, manufacturing is in terrible shape.

Friday, November 21, 2008

Philly Fed Looks Terrible


Click for a larger image

From Bloomberg:

Manufacturing in the Philadelphia region shrank in November at the fastest pace in 18 years, a sign that the credit crunch and weak demand are causing companies to cut back.

The Federal Reserve Bank of Philadelphia's general economic index was minus 39.3 this month, weaker than forecast and the lowest reading since October 1990, from minus 37.5 in October, the bank said today. Negative readings signal contraction. The index averaged 5.1 last year.

The deepening credit crisis and economic slump are forcing companies to trim payrolls, investment and production. Slowing global demand is weighing on manufacturing, which accounts for about 12 percent of the U.S. economy.

``Manufacturers are getting hit by several different forces,'' Dean Maki, co-chief global economist at Barclays Capital Markets in New York, said in an interview with Bloomberg Television. ``Real exports are being hit pretty hard because the slowdown is heading abroad as well.''


Why is this important?

-- The NBER uses manufacturing activity as an indicator for when a recession starts.

-- Exports were a bright spot for the economy last year and part of this year. Europe's and Asia's slowdown along with the US consumer slowing his spending is obviously having an impact

-- Manufacturing employment has been declining since the beginning of 2007.

Click for a larger image

Friday, June 20, 2008

Manufacturing Looking Weak

Over the last few weeks we've seen three important manufacturing reports released: industrial production from the Federal Reserve, the Empire State index from the NY Fed and the Philadelphia Index from the Philadelphia. All three point to a continued slowdown in the manufacturing sector.

First up is overall industrial production:

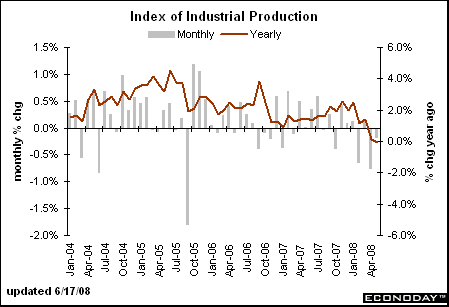
U.S. industrial production fell unexpectedly by 0.2 percent in May as output at utilities shrank, while capacity use slipped to the lowest level in almost three years, the Federal Reserve said on Tuesday.

Economists polled by Reuters were expecting a 0.1 percent rise in output at the nation's factories, utilities and mines after a 0.7 percent fall in April.

Manufacturing output was unchanged during the month after a 0.9 percent decrease in April. Utilities output dipped by 1.8 percent.

Overall industrial production is 0.1 percent below its year-earlier level.

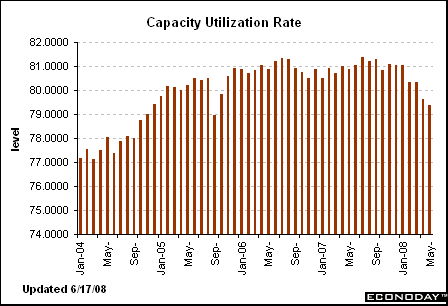
In further evidence of the slowing economy, total industry capacity use fell to 79.4 percent, the lowest since September 2005, from 79.6 percent.


The year over year chart indicates this indicator has been in a downward trend for some time. In addition, the overall report was weak with declines in a variety of sectors. In other words, there wasn't one number within the report the sent it lower; it was all the individual parts of the report sending it lower.


Also note the capacity utilization has been dropping. That means we're using less of our productive capacity to make stuff. That means manufacturing facilities are slowly cutting resources to save money. That's not a good development either.

The individual reports were not good either. From the Empire State survey:

The Empire State Manufacturing Survey indicates that manufacturing activity in New York State continued to deteriorate in June. The general business conditions index fell 5 points, to -8.7. The indexes for new orders, shipments, and unfilled orders were negative and lower than their May levels. The prices paid index remained elevated, falling only slightly below last month’s record high. The prices received index rose markedly and, at 26.7, approached a record level; the future prices received index also rose sharply, reaching a record high of 47.7. Employment indexes hovered around zero. Future indexes generally improved only slightly from the relatively low levels of the past several months, although the capital expenditures index rose several points.


This report shows a double whammy. First, overall activity is dropping right now. At the same time, prices are increasing. That places policy makers in a serious bind. To stimulate activity they need to lower interest rates (which they already have). However, to do so would increase the possibility of inflation.

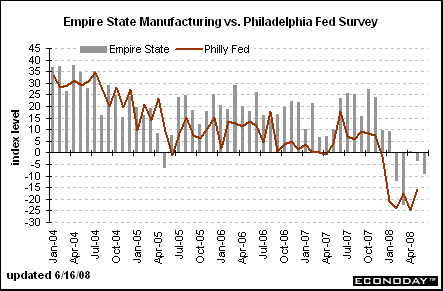
Here is a chart of the Empire and Philly indexes:


Note the Empire state number has been down 4 of the last 5 months.

The Philly report is not much better:

The region’s manufacturing sector continued to contract this month, according to firms polled for the June Business Outlook Survey. Indexes for general activity, new orders, shipments, and employment were all negative this month and registered lower readings than in May. There was an appreciable increase in the share of manufacturers reporting price pressures this month, and about one-third of the firms continued to report higher prices for their own products. The region’s manufacturing executives remained optimistic about future activity, but most future indicators fell back from their May readings.


Notice the exact some conditions as the Empire state number: declining activity and increasing price pressures. Not a good combination.

Short version: there is an overall slowdown underway right now.

Thursday, April 19, 2007

Two Manufacturing Reports Show Slow Growth

I missed the NY Fed's manufacturing survey on Monday. Here's the main point of the report:

The Empire State Manufacturing Survey indicates that conditions for New York manufacturers were flat again in April. The general business conditions index edged up 2 points, to 3.8, rebounding only marginally from March.


New orders were just above 0. Shipments dropped.

Here's some bad news for the Fed. Prices paid increased while prices received dropped slightly. The prices received index has dropped for three-straight months. This may indicate producers are having to cut prices to move product. In addition, inventories have increased three straight months, indicating future production may drop to prevent more of an inventory build-up.

The Philadelphia Fed reported similar conditions:

Activity in the region’s manufacturing sector was basically unchanged again this month, according to firms polled for the Business Outlook Survey. The index for general activity was near zero, and indicators for new orders, shipments, and employment were only slightly positive, suggesting little change from March. Regarding future activity, the region’s manufacturing executives were somewhat more optimistic this month than they were in March.


The Philly area also reported similar pricing problems as the New York Area -- increasing inputs and stagnant prices received:

Area manufacturers reported higher costs for inputs again this month. The prices paid index edged three points higher and has now increased for three consecutive months. Thirty-seven percent of the firms reported higher input prices, up seven points from March; 13 percent reported lower input prices in April.

Despite increased costs, fewer firms reported higher prices for their own goods this month: 17 percent reported higher prices, down nine points from March. The prices received index fell 11 points, to 5.2, its lowest reading since August 2005.


These two reports indicate the decline in Capex spending may be hitting home with manufacturers.

In addition, manufacturers are just hanging on in positive/expansion territory.

Thursday, March 15, 2007

Philly Fed Stalls

This chart from the report says it all.

Photo Sharing and Video Hosting at Photobucket

Business conditions are hovering around zero. They have been here before and bounced, so this might not be a predictor of future problems.

But the usual 6-month enthusiasm has decreased a bit:

The outlook for manufacturing growth over the next six months showed a slight moderation this month. The future general activity index fell three points, and most of the other future indicators followed suit: The index for future new orders decreased four points, and future shipments decreased one point. Firms were also less optimistic about future growth in employment. The future employment index decreased eight points; 25 percent of the firms expect to increase employment over the next six months, and 16 percent expect to decrease it.


This is a weak report as well. Overall business conditions are hovering between expansion and contraction.

Here's a link to the full report -- Here's a PDF

Friday, January 19, 2007

Phily Fed Up Moderately

From the Phily Fed:

The survey’s broadest measure of manufacturing conditions, the diffusion index of current activity, increased from a revised reading of -2.3 in December to 8.3 (see Chart).* This month, 25 percent of the firms reported increased activity; 17 percent reported decreased activity. The new orders and shipments indexes offer mixed signals about the strength of this month’s overall improvement. Demand for manufactured goods has not yet recovered much: The new orders index rose two points, from -0.9 to 1.3, after negative readings for two consecutive months. The shipments index increased 10 points from December; 37 percent of the firms reported an increase in shipments; 13 percent reported a decrease. Indexes for delivery times and unfilled orders remained negative, indicating shorter delivery times and a decline in unfilled orders.

Evidence of modest growth in manufacturing is suggested by replies concerning employment and hours worked. The percentage of firms reporting an increase in employment (21 percent) was somewhat higher than the percentage reporting decreases (13 percent). The current employment index was virtually unchanged from its revised December reading. The average workweek index edged four points higher, but the percentage of firms reporting longer hours (16 percent) was nearly the same as the percentage reporting shorter hours (15 percent).


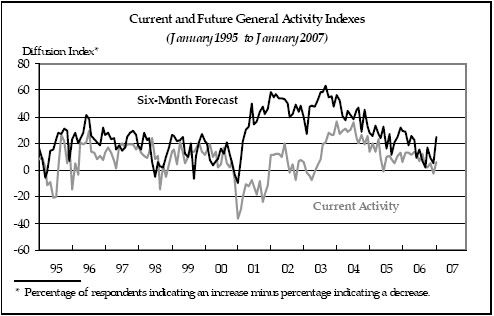
Let's take a look at the general diffusion chart:

Photobucket - Video and Image Hosting

The gray line (current conditions) has trended down for the last 6 months or so. We saw a longer downtrend from mid-'04 to mid-'05 without a serious problem. That means the most recent decrease could be nothing more than a natural slowdown from peak activity. In addition, we have seen modest increases over the last year, so the recent increase into positive territory could be the beginning of a return to slower but positive production levels. However, we are near the 0 line, so this trend bears watching.

The new orders index rose two points, from -0.9 to 1.3, after negative readings for two consecutive months.


The new orders index isn't offering us much hope right now.

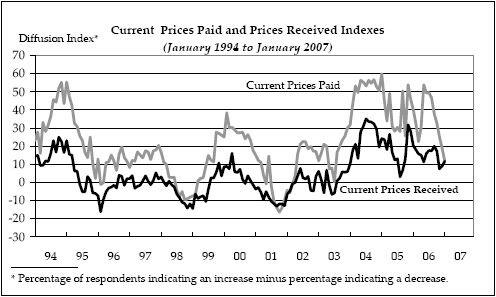
Here's some good news in the report:

Photobucket - Video and Image Hosting

The prices paid component has dropped for the last 6 months. This is good news on the inflation front.

The current employment index was virtually unchanged from its revised December reading.


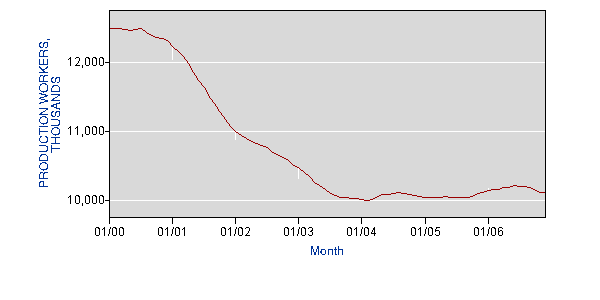
We've seen manufacturing employment take a big hit during this expansion. Here's a chart of national manufacturing since 2000.

Photobucket - Video and Image Hosting

The large productivity gains have translated into fewer manufacturing employees. There is no reason to think this trend won't continue.

The short version is all the recent manufacturing numbers have showed a slightly positive reading not strong enough to warrant extreme optimism, but enough to warrant a soft-landing.

Thursday, December 21, 2006

Philly Fed Is Mixed

From the Philadelphia Federal Reserve:

Overall economic conditions in the region’s manufacturing sector declined slightly in December, according to firms polled for this month’s Business Outlook Survey. Indicators for general activity, new orders, and unfilled orders were negative in December. Indicators for shipments and employment, however, were positive and stronger than last month. Although firms again reported higher prices for their own manufactured goods, the survey’s prices paid indicator continues to suggest diminishing cost pressures. The region’s manufacturing executives were less optimistic about future activity; most future indicators decreased for the second month in a row.


Here's a link to a table with the results. It doesn't translate well to the Blogger format.

Here are some interesting points from the table listed above:

1.) 6 months from now, 35% of respondents think new orders will be increasing. Currently only 26% think new orders will increase. 25% see an increase in inventories in 6 months, whereas right now only 16% see an increase in inventories. 37% see an increase in employment in 6 months, whereas only 27% see an increase in employment right now. It looks like people are thinking any slowdown is temporary.

2.) Here's a big piece of information. 53% see an increase in prices paid in six months whereas only 33% see an increase this month. This is something the Fed will probably be interested in.