Friday, July 2, 2010

No, There Won't Be A Double Dip


Expect the talk of a double dip recession to increase as a result of today's employment report. There are several reasons why this won't happen.

1.) Oil is still cheap.


Compare the price of oil right before the last recession (roughly $150/bbl) and today's price (roughly $80/bbl). If oil increases to say $100+, then we have an issue. But there is nothing on the chart today that indicates there is a ton of upward momentum in the market.


Interest rates are still low. The Fed is currently giving money away and the thirty year Treasury yield (pictured above) is still low. US Treasuries are still considered a safe haven which has lowered rates over the last few months to incredibly low levels.

For all the talk of double dip recession, what really caused the last one was an increase in interest rates:


Remember that Volcker increased interest rates to kill inflation. That is what caused the last double-dip recession. Given that rates are now incredibly low, don't expect that to happen again.

See also this post at The Big Picture.

Why Aren't Businesses Hiring?

There are four reasons:


Capacity Utilization is defined as:

A metric used to measure the rate at which potential output levels are being met or used. Displayed as a percentage, capacity utilization levels give insight into the overall slack that is in the economy or a firm at a given point in time. If a company is running at a 70% capacity utilization rate, it has room to increase production up to a 100% utilization rate without incurring the expensive costs of building a new plant or facility.


In other words, the chart of capacity utilization tells us there is a tremendous amount of slack in the economy. Businesses can simply tap some of this unused capacity rather than hire more employees.


The number of hours worked dropped during the recession. Companies can simply increase the hours worked by their existing work force before hiring new people.


Productivity is still increasing. This means businesses are still getting more and more out of their existing workforce. Because of high unemployment, there is the added benefit of lower wages/salaries. From a business owner's perspective, this is a win/win scenario.

Uncertainty: there has been a tremendous amount of change over the last 12 months. Businesses are still trying to figure out what that means for their bottom line. Until there are firm answers, they will freeze hiring.

Employment Down -125,000

The big reason for the drop was the departure of 225,000 census workers. Without that figure, this would have been a gain of 100,000. That is still a weak pace of job creation, but it would have obviously been better than the current headline.

Let's start with the household survey.

The civilian labor force decreased 652,000, while the civilian non-institutional population increased 191,000. The non-institutional population is the largest group in the employment statistics, while the labor force is the number of people in the non-institutional population who could work. This means the participation rate decreased by .3%, from 65% to 64.7%.

The number of people employed decreased by 301,000.

The number of people unemployed also decreased by 350,000. This combined drop int he civilian labor force and the number of unemployed led to the decrease in the unemployment rate from 9.7% to 9.5%.

The number of people working part time for economic reasons decreased by 182,000. The number of people who could only find part-time work decreased by 225,000.

The Establishment Survey

The headline number was a decrease of 125,000, but this number was skewed by the loss of census workers.

Good producing jobs fell by 8,000, largely as a result of a drop in construction employment by 22,000. Although manufacturing is clearly in a recovery, this section of the economy only added 9,000 last month. The reason for the lack of growth in the manufacturing sector is the very low rate of resource utilization, which gives factories a tremendous amount of unused slack that they can first use to ramp up production. This means there is little need for a massive rehiring of employees.

Private service producing jobs increased by 91,000 and government employment decreased by 208,000.

Average hourly earnings, average weekly hours and average hourly earnings all declined.

On a scale of 1-10, I'd give this report a 3.5 at best. Once you get beyond the headline number the reasons for it, you get a very mild increase in employment -- and one that is not what you would expect after coming out of a recession. Simply put, a second half slowdown to 1%-2% GDP growth is pretty much in the cards right now.

Yesterday's Market

Let's start with the oil market.


First, note that prices have broken a trend line (a).


A closer look at the break reveals that prices attempted to move through the 50 day EMA twice (a and b), but couldn't get through resistance. Prices have been selling off, printing large gaps lower (c) on higher volume (d).


The daily, 5-minute chart shows the downward gaps (a, b, and c) in more detail. Also note that prices were trading around the 34.80-36 level for several days, but have since moved lower.


On the SPYs, notice that the shorter EMAs are now below the longer EMAs and that two of the EMAs (the 10 and the 20) are below the 200 day EMA. Also note the heavier volume the last three days (b).


Like the SPYs, the 10 and 20 day EMAs are now below the 200 day EMA on the DIA chart.


The 10 day EMA just crossed below teh 200 day EMA on the IWMs.


Finally, remember the price of the longer end of the Treasury market in relation to the 2008 panic.

Thursday, July 1, 2010

No, Really, Austerity Doesn't Work

From the NY Times:

As Europe’s major economies focus on belt-tightening, they are following the path of Ireland. But the once thriving nation is struggling, with no sign of a rapid turnaround in sight.


Let's think about that opening paragraph for just a moment.

1.) Everyone wants to "tighten their belts."

2.) Ireland tried that two years ago.

3.) Two years later "the once thriving nation is struggling, with no sign of a rapid turnaround in sight."

In other words:

"belt tightening" does not lead to "expansion."

"But maybe if we do it, it will be different."

Well, the Baltics also tried it:

Much like Spain, Ireland and the UK, the Baltic states were badly hit by the bursting of a credit bubble in 2008 that sent their economies into freefall and their budget deficits soaring.

While others cushioned the impact with stimulus spending, the Baltic trio plunged straight into austerity. As a result, they suffered the deepest recessions in the European Union last year, with Latvia’s economy shrinking by 18 per cent.

I realize there are people out there who are unconcerned with facts; they will continue to say Washington needs to "stop spending". These people are fools.

Again, let's review the GDP equation.

C+I+X+G=GDP

Consumer Spending
plus
Investment
plus
Net Exports
plus
Government Spending
equals
GDP

According to the CBO, government spending accounts for about 20% of the US economy.

Ladies and gentlemen, this really isn't that hard.

Initial Jobless Claims Up 13,000

From Bloomberg:

More Americans unexpectedly applied for jobless benefits last week, a sign the labor market recovery may be slowing.

Initial jobless claims increased by 13,000 to 472,000 in the week ended June 26, Labor Department figures showed today in Washington. The number of people receiving unemployment insurance rose, while those getting emergency benefits dropped after Congress failed to act on extending the legislation.

The jump in applications raises the risk that the turmoil in financial markets brought on by the European debt crisis is leading to additional cutbacks in staff. The Labor Department tomorrow may report the U.S. lost jobs in June for the first month this year, reflecting a drop in temporary federal workers who helped to conduct the decennial census.

“Initial claims for unemployment insurance benefits are moving in the wrong direction,” Ryan Sweet, a senior economist at Moody’s Economy.com in West Chester, Pennsylvania, said before the report. “Jobless claims are further from levels typically viewed as signaling rising payrolls.”

Economists forecast jobless applications would fall to 455,000 from an initially reported 457,000 for the prior week, according to the median of 46 projections in a Bloomberg survey. Estimates ranged from 440,000 to 475,000.

This is the time of year when states cut back on payrolls in schools, a Labor Department spokesman said. The jump in claims may reflect even larger-than-typical reductions.


Here's a chart of the 4-week moving average. It doesn't include today's numbers, but that's not important.


This number showed continued improvement for the last half of last year. it has stalled for the entirety of this year. No number moves in one direction completely. Hence, some stalling of the number is to be expected. However, we are now beyond the stalling phase. In short, there is a serious problem that is not being addressed.

This number has been concerning me for about three months. It has now crossed the point from outlier to deep concern about the second half of this year. With the exception of last month (where the primary driver of job growth was census hires) , the establishment survey has shown continued improvement. My concern is that number and record of improvement is in serious jeopardy.

Mortgage Refinancing and Household Deleveraging

- by New Deal democrat

Yesterday the Mortgage Bankers Association reported that purchase mortgage applications dropped to their lowest level yet. Needless to say, this increases the odds of a double-dip in the 3rd or 4th quarter back into negative GDP.

That's certainly the headline, but underneath is the story of continuing household purging of debt. A couple of days ago I posted the latest household debt obligations graphs from the Federal Reserve, showing that through the first quarter of this year, households had decreased their debt obligations by almost half, measured from the beginning of the Reagan era in 1981.

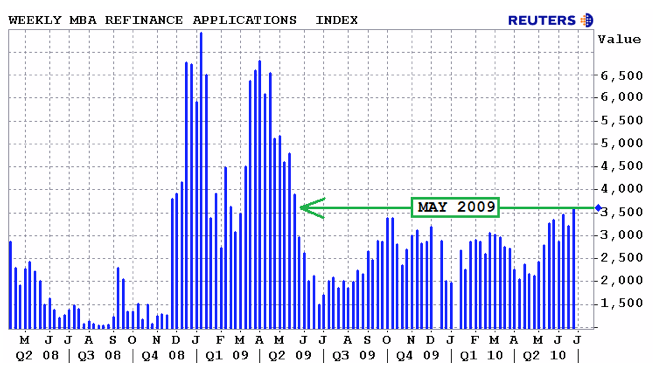
This is the graph of refinance mortgage applications:

You can see that since interest rates cratered in the Panic of 2008, households have taken advantage of new lows in mortgage rates to refinance. With rates once again declining to new lows, refinancing is increasing again.

The odds are extremely good that unlike during the housing boom, refinancing is not being used to buy Hummers and swimming pools and glitz. Most likely, the monthly savings in interest payments is being used to pay down other debt. So long as deflationary forces are at work in the economy, we can expect this to play out in a once in a generation, if not once in a lifetime, purging of debt.

There are avenues of relatively more or less pain along the way, but at the end of the journey, households are going to have much better balance sheets than they did a few years ago.

Chicago PMI Drops, But Still Shows Strength


From Marketwatch:

Manufacturing activity in the Chicago region slipped a bit in June but remained at relatively high levels, according to media reports of the purchasing managers' index for the Chicago region released on Wednesday. The Chicago purchasing managers index fell to 59.1% from 59.7% in May. The drop is in line with forecasts. The report signals continued solid growth in the manufacturing sector. Readings over 50% indicate overall business expansion. The Chicago PMI is the last of a series of regional indicators that some economists say give clues to the national Institute for Supply Management manufacturers' survey for June to be released on Thursday. Based on other regional readings, economists expect the June ISM manufacturing composite to slow a bit to 59.0 from a May reading of 59.7


Let's take a look at some of the data:


Click for a larger image

Notice that the overall index, production and new orders index have been printing strong numbers for the last six months. This indicates that Chicago area manufacturing is doing well, as a reading above 50 indicates expansion.

Yesterday's Market

Let's start with the Treasury market again, as this market is still signaling extreme concern.


The 7-10 year part of the curve is in a clear uptrend (a) and has gapped higher twice over the last 5 days (b and c). Over the last two days, prices have consolidated (e) in a fairly tight range.


The long end of the curve (20+ years) has two trend lines (a and b). It has gapped higher three times in the last week (c, d and e).


Looking at the A/D line for the long end of the curve we see some very interesting things. First, note the line was much lower during the end of 2008 panic (a). Next, notice the line increase at the beginning of this year while the market was going down (b). This indicates that people were concerned about the economy at the beginning of this year and were accumulating sage assets. Finally, notice that the line is now at very high levels (c). All of this tells us that there is a tremendous amount of volume moving into the market, and this situation has existed since the beginning of the year.


It's beginning to look as though the industrial metals chart was forming a double top over the last half year (a and b). Notice the large volume sell-off that occurred after each of the tops. There is still a great deal of concern about China right now, leading to the sell-off.


Perhaps the one saving grace of the current situation is oil, which is still cheap compared to the price spikes we saw at the end of the last expansion. Compare price levels a and b.


Equity prices are still in a clear downward trend. They first moved lower (a), followed by two days of consolidation (b). Next they gapped lower (c) and consolidated over two days (d). Finally, notice that prices broke lower at the end of yesterday's trade (e).

Wednesday, June 30, 2010

ADP Report Shows Weak Employment Market


From the FT:

US companies added a modest 13,000 jobs in June, as private-sector job growth stalled amid a wobbly economic recovery.

June hiring slowed dramatically from the previous month, when private companies added 57,000 workers, according to ADP Employer Services, signalling that private companies held back ahead of summer. The gain was much smaller than the 60,000 additional jobs that economists had expected.

.....

“The slow pace of improvement from February through June is consistent with other publicly available data, including a pause in the decline of initial unemployment claims that occurred during the winter months,ADP said in its report.


Consider this chart from the St. Louis Federal Reserve of the 4-week moving average of initial unemployment claims:


Notice how it has stalled for most of this year. This is why I've been concerned about the sideways movement for the last few months.

-----------------

New Deal democrat here. I wanted to add my thoughts to Bonddad's.

The ADP has had a horrible record predicting the Nonfarm Payrolls number of jobs for the last year and a half. Here's a list of how the ADP number (1st column) has compared with Nonfarm Payrolls non-government jobs number (2nd column) and the Household Employment Survey (3rd column) so far this year (all figures in thousands):

Jan. -22 +16 +541

Feb. -20 +62 +308

Mar. -23 +158 +264

Apr. +32 +218 +550

May +55 +41 -35

June +13 ? ?

That's nearly a 100,000 average difference between the ADP and BLS reports.

In other words, Friday's jobs report could stink -- but if it does, its correlation with ADP's report will, imho, be simple coincidence.

Consumer Confidence Decreases


From the Conference Board:

The Conference Board Consumer Confidence Index® which had been on the rise for three consecutive months, declined sharply in June. The Index now stands at 52.9 (1985=100), down from 62.7 in May. The Present Situation Index decreased to 25.5 from 29.8. The Expectations Index declined to 71.2 from 84.6 last month.

.....

Consumers’ appraisal of present-day conditions was less favorable in June. Those saying conditions are “good” decreased to 8.0 percent from 9.7 percent, while those saying business conditions are “bad” increased to 42.4 percent from 39.5 percent. Consumers’ assessment of the labor market was also less favorable. Those claiming jobs are “hard to get” increased to 44.8 percent from 43.9 percent, while those saying jobs are “plentiful” decreased to 4.3 percent from 4.6 percent.

Consumers’ short-term outlook, which had improved significantly last month, turned more pessimistic in June. Those anticipating an improvement in business conditions over the next six months decreased to 17.2 percent from 22.8 percent, while those expecting conditions will worsen rose to 14.9 percent from 11.9 percent.

Consumers were also much less optimistic about future job prospects. The percentage of consumers anticipating more jobs in the months ahead decreased to 16.0 percent from 20.2 percent, while those anticipating fewer jobs increased to 20.8 percent from 17.8 percent. The proportion of consumers anticipating an increase in their incomes declined to 10.6 percent from 11.4 percent.

Raise your hand if you're surprised by this development.

Seriously, the combination of Europe, market instability and unemployment took their toll last month.

Here's a chart of the data:


Notice that confidence has been depressed for the entire recovery and sits at levels just above those of the recession.

The Price of Austerity

From the NY Times:


In effect, policy makers are betting that the private sector can make up for the withdrawal of stimulus over the next couple of years. If they’re right, they will have made a head start on closing their enormous budget deficits. If they’re wrong, they may set off a vicious new cycle, in which public spending cuts weaken the world economy and beget new private spending cuts.

On Tuesday and Wednesday, pessimism seemed the better bet. Stocks fell around the world, with more steep drops in Asia Wednesday morning over worries about economic growth.

Longer term, though, it’s still impossible to know which prediction will turn out to be right. You can find good evidence to support either one.

The private sector in many rich countries has continued to grow at a fairly good clip in recent months. In the United States, wages, total hours worked, industrial production and corporate profits have all risen significantly. And unlike in the 1930s, developing countries are now big enough that their growth can lift other countries’ economies.

On the other hand, the most recent economic numbers have offered some reason for worry, and the coming fiscal tightening in this country won’t be much smaller than the 1930s version. From 1936 to 1938, when the Roosevelt administration believed that the Great Depression was largely over, tax increases and spending declines combined to equal 5 percent of gross domestic product.

Read the whole article.


Yesterday's Market

Let's start with the Treasury market, as it shows that concern is high.


While the short end of the Treasury curve has been higher, it is still very high, rallying and showing concern among traders. People are parking money in short-term securities out of concern for the economy.

The 7-10 year part of the curve is also showing a deep level of concern about the market and the economy. The last time we saw levels this high was the deep financial meltdown of 2008.


Yesterday, the TLTs broke through key resistance. They are approaching levels last seen at the height of the financial panic in 2008.

The Treasury market is signaling several things.

1.) Interest rates aren't increasing anytime soon.

2.) Deflation is a big concern

3.) There is tremendous concern about the economy and the stock market.


The transports are signaling more trouble ahead. After breaking through resistance (a), they rose a bit but then started falling hard a little over a week ago (b). Also note that yesterday prices gapped lower in a big way (c) and closed just below key levels.


Yesterday, industrial metals moved lower, breaking key support (b). Note the move lower was a big gap lower.


Agricultural commodities also fell, gapping lower (a).


Oil also gapped lower (a), although the move lower was not of the same magnitude as the DBAs or DBBs.


In the equity markets, the indexes opened lower with a big gap down (a). The SPYs made lower lows (b, c and d) throughout the day. But notice that in general, prices meandered in a tight range for most of the day. The reason is the sharp drop at the open. Whenever prices drop like that, it's typical to see them move sideways for the rest of the day. Also note the rising MACD (e), indicating there was an momentum for most of the day.

Tuesday, June 29, 2010

Household Savings and Debt Service

- by New Deal democrat

In expansions, households are confident and are willing to take on more risk. As they lose confidence and retrench, a recession occurs. Typically this retrenchment goes on until the recovery is definitively established.

The Federal Reserve releases this information on a very lagged basis. On Friday they released household debt information for the first quarter of this year --January through March. It shows that households have continued to aggressively lower their debt and other financial burdens.

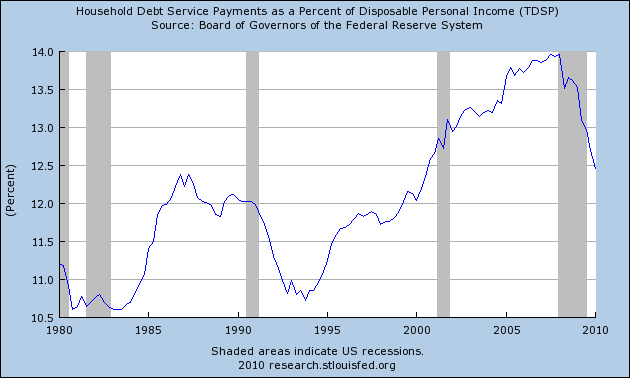
First, let's look at household debt obligations (mortgages, loans, credit card payments etc.):


This has fallen from 14% to 12.5% of disposable income -- lower than at any time in the last 10 years and almost halfway back to the lowest point since the series was started at the beginning of the Reagan presidency.

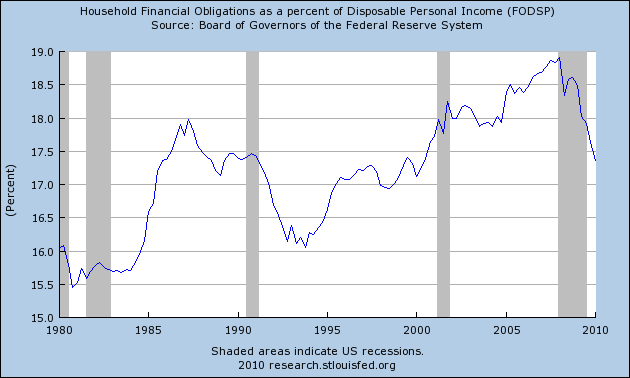
Now, here's the broader measure of financial obligations (including leases, tax and insurance payments, etc.):


This too has fallen over 1.5% and is also lower than than at any point in the last 10 years, and also represents nearly half the increased debt obligations households have taken on since 1980.

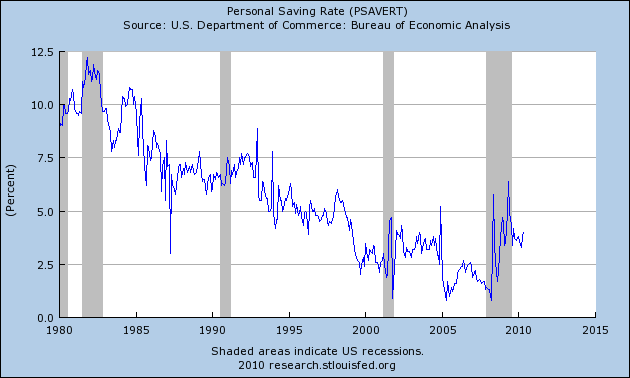
Yesterday the savings rate for May was also reported, rising slightly to 4%:


As Bonddad has noted in the last post, household disposable income has also increased nicely in the last several months. Real income has increased as well.

Put these together, and you have a picture of major improvements to household balance sheets -- more income (finally), more savings, and an aggressive paydown in debt. If households continue this pattern for two more years, they will have almost completely repaired their balance sheets to the point before the beginning of the Reagan economic era.

Three years ago I started writing about a "S l o w M o t i o n Bust" -- a nineteenth century style deflationary panic that would unfold over years instead of months, because of the deployment of the entire 20th century economic arsenal designed to avoid a Great Depression style deflationary spiral. While we are in recovery from the 2008 oil spike and financial panic, the "slow motion bust" isn't over because the structural problems remain. Where households are concerned, it looks like it will be another two years or more before their finances are repaired. (Note that this is a similar timeframe to when I suspect that housing prices will be near their bottom).

This is what happens during Kondtratieff winter.

Case Shiller Up


From Bloomberg:

Home prices in 20 U.S. cities rose in April from a year earlier as sales got a boost from a tax credit aimed at reviving the industry that triggered the worst recession since the 1930s.

The S&P/Case-Shiller index of property values climbed 3.8 percent from April 2009, the biggest year-over-year gain since September 2006, the group said today in New York. The increase exceeded the median forecast of economists surveyed by Bloomberg News.

The end of a government homebuyer incentive worth as much as $8,000, mounting foreclosures and unemployment near a 26-year high threaten to set real estate prices back following the stabilization that began earlier this year. Eroding home equity may limit household spending, the biggest part of the economy, even as gains in income help underpin demand.

Let's take a look at the data. Click on all images for a larger image:

The year over year number continues to improve

While the month to month number continues to stabilize.

Notice that last month only three cities had negative month to month numbers.

With the expiration of the tax credit comes a series of questions, especially about the sustainability of the price increases. Only time will tell.


PCEs and Income Up


From the BEA:

Personal income increased $53.7 billion, or 0.4 percent, and disposable personal income (DPI) increased $49.0 billion, or 0.4 percent, in May, according to the Bureau of Economic Analysis. Personal consumption expenditures (PCE) increased $24.4 billion, or 0.2 percent. In April, personal income increased $59.4 billion, or 0.5 percent, DPI increased $63.7 billion, or 0.6 percent, and PCE increased $1.4 billion, or less than 0.1 percent, based on revised estimates.


Let's look at the data:


Wages at service producing industries are in a clear uptrend, as are

Wages at goods producing industries.


Disposable personal income is also increasing.

Real PCEs are in a clear uptrend, as are

real service expenditures.
Non-durable goods purchases, however, appear to have stalled.


But purchases of durable goods is also increasing.

These figures point to an economy that continues to expand.

Yesterday's Market


From a macro-perspective, notice how all the averages prices are consolidating around the 200 day EMAs. This indicates that the markets are seriously conflicted about future movements -- are we in a bull or a bear market.


From an EMA picture, notice that short-term EMAs are clearly bearish -- all of them are moving lower and the shorter are below the longer. Most importantly, the 10 and 20 day EMA are below the 200 day EMA.


The daily chart shows that equity prices have moved in three segments over the last 10 days: a consolidation (a), a big drop (c) followed by more consolidation at lower levels (c).


With yesterday's price action, gold once again failed to move through the important resistance area of 122-123. This is the fourth time gold has had problems with this area.

For more on the Treasury market, see this post from Corey over at Afraid to Trade. he sums up that market really well.