Showing posts with label Current Account. Show all posts

Thursday, January 25, 2007

The Long View: Where Is the Trade Deficit?

BruceMcF

A long time ago, I looked at the current account blowout in The Long View: Current Account, which ended with a promise to have a look at the make-up of the blow out in terms of both geography and industry.
What I am looking at now is the broad outline of the geographic break down.

How broad? I am breaking the whole world down into The Americas, Europe, Asia & Oceania, and Africa. So the answer is, just about as broad as possible.

The Story So Far

Where I left off, before the long haitus, was the stark reality of the current account blowout:
  • It is massively bigger than anything we have experience in living memory

  • The problem is not income or unrequited transfers: it is trade

The trade account is made up trade in goods and trade in services. What I am going to be looking at today is trade in goods.

And before I put this information up, I will add a note that you should not shoot the messenger. After careful contemplation, I have come to the firm conclusion that messenger-shooting is counter-productive.

The source of this information is the same BEA site that provided the info for the first in this series. The only difference is that instead of working with table 1, I am working with Table 2b: Trade in Goods, Additional Historical Historical Data.

Where In The World Is the Trade Taking Place?

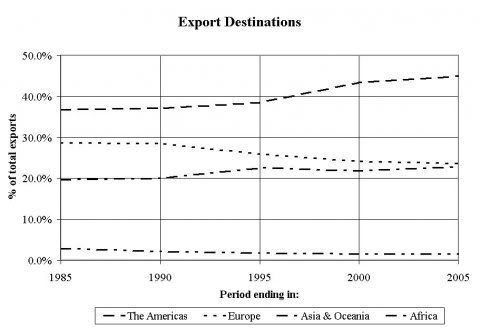
First, lets look at Exports to these four regions as a share of total exports. In all three of these graphs:
  • the Americas are the "dash" line,
  • Europe is the "dot" line,
  • Asia and Oceania is the "dash dot" line, and
  • Africa is the "dash dot dot" line.


The trends here are simple. Europe is losing ground as an export market, with most of that share being taken up by the Americas, and some being taken up by Asia and Oceania. Africa is a very small market, both because of the small size of so many African economies as export markets, and because of the dominance of European firms in those markets.

Now, lets look at Imports from these four regions, as a share of total imports.
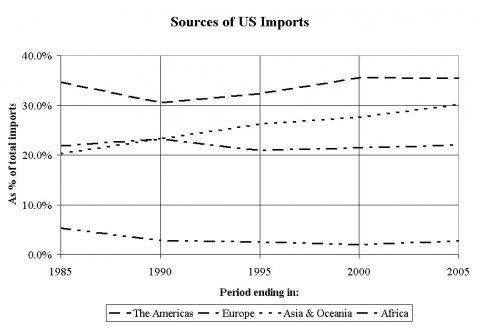
Here we have the Americas as the dominant source of imports, with a loss in market share in the 80-85 period that is regained with something to spare. The second spot, however, trades place, Europe holding a slight lead over Asia in 80-85, while by 01-05, Asia and Oceania is on a path toward taking over as the primary source of imports.

Don't Forget the Blowout

A word of caution is in order here. It is important to bear in mind that the two diagrams are showing shares of totals that are sliding rapidly apart. That is, 45% (about) of our goods exports go to the Americas, and 35% of our goods imports. But that is 45% of a smaller number, and 35% of a bigger number.

The way I have set this up is to take the average of imports and exports as "average trade", and look at the Balance of Payments with each global region as a percentage of "average trade". And here ... as in the earlier diary that focused on the current account overall ... things are moving "south" at a very rapid pace.
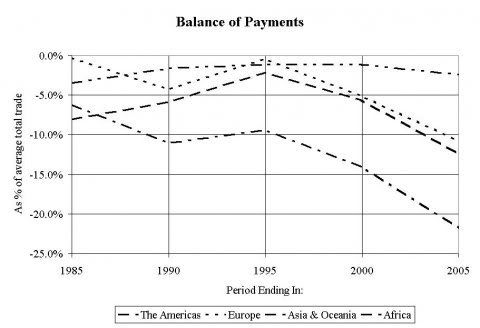

Bear in mind here that what you are looking at is trade in goods, not goods and services overall. The US tends to have a stronger position in services than in goods. As you will see when I look at trade in services, a "small" negative balance in goods trade is good news for the overall trade account.

And for the global regions, the balance of trade compared to average trade breaks down into two stories. For the Americas, Europe, and Africa, the story by and large is improvements up through to 90-95, and then a rising deficit through to 00-05 (and, if we sneaked at table 2a, on to the present).

For Asia and Oceania, the "improvement" in the trade deficit is there, but it is very small ... from about -11% to about -9% ... and the slide since then is the single largest source of the trade deficit.

And remember: this last figure is compared to the average amount of all trade in goods. The deficit in goods trade with Asia and Oceania is more than 20% of the average trade in all goods.

The Path Ahead

Of course, whenever you find Economic bad news, you can find a pollyana that will explain that its just the market in operation, and in the end its all for the best. The main hope for the pollyanas are that "in the long run", the deficits in the goods trade will be balanced by surpluses in services trade.

And so, in the third installment in this series, I will see what the long term view of the balance of trade in services has to tell us. ... to be continued ...

Monday, December 18, 2006

Current Account Widens in Third Quarter

From the Bureau of Economic Analysis

The U.S. current-account deficit--the combined balances on trade in goods and services, income, and net unilateral current transfers--increased to $225.6 billion (preliminary) in the third quarter of 2006 from $217.1 billion (revised) in the second quarter. The increase was more than accounted for by increases in the deficits on goods and on income. The surplus on services increased, and net unilateral current transfers to foreigners decreased.


This is 6.8% of GDP. Most economists would say this level is unsustainable. I would agree.

Goods exports increased to $262.1 billion from $252.8 billion. The
increase resulted from increases in all major commodity categories.

Goods imports increased to $480.7 billion from $463.4 billion. The increase resulted from increases in petroleum and products and in most major categories of nonpetroleum products.


In other words, we aren't exporting our way out of the problem.

Income receipts on U.S.-owned assets abroad increased to $160.1 billion from $155.3 billion. The increase was largely accounted for by an increase in “other” private receipts (which consists of interest and dividends). Direct investment receipts also increased.

Income payments on foreign-owned assets in the United States increased to $162.2 billion from $155.8 billion. Direct investment payments, “other” private payments (which consists of interest and dividends), and U.S. Government payments (which consists of interest) all increased.


About six months ago there was a theory floating around called "dark matter". It essentially stated that US assets abroad traditionally paid more income than foreign owned assets in the US. Therefore, the trade deficit was actually OK. Anyway, the difference between income from US assets abroad into the US and foreign owned assets in the US going abroad has been decreasing for the last year or so, making the "dark matter" theory somewhat more suspect.

The dollar is one of the wild card I see in the US' economic future in 2007. This does not help the dollar's value in the long run.

Wednesday, December 13, 2006

The Long View: Current Account [BruceMcF]

This post could be seen as following up on a number of good posts connected to the state of play with the most recent current accounts numbers and events in US$ foreign exchange markets. However, that would be an illusion ... indeed, as you can see above, "2006" is not even in view here. The focus here is on the long term.

This is what a trade deficit blow-out looks like. Just in case someone asks you for an example, you can send them that graph. And just to be clear -- these are 5 year sequential averages, for five year intervals 61-65, 66-70 and so on. The actual values in current US$:
  • 2001, -$389b current (-$363b trade)
  • 2002, -$472b current (-$421b trade)
  • 2003, -$528b current (-$495b trade)
  • 2004, -$665b current (-$611b trade)
  • 2005, -$792b current (-$717b trade)
So it is both very bad, and getting worse at a rapid rate.

And there is far more that I want to say on this than fits the print ... so the main post is now sitting down in the Saturday archives, which means that you can reach it by clicking here to get under the fold.

Saturday, December 9, 2006

The Long View: Current Account (BruceMcF)


This post could be seen as following up on a number of good posts connected to the state of play with the most recent current accounts numbers and events in US$ foreign exchange markets. However, that would be an illusion ... indeed, as you can see above, "2006" is not even in view here. The focus here is on the long term.

And I will stress, this is the long term not the long run. The long run is about the logical implications if we take hold the current framework of technology and institutions constant and let all short run market fluctuations to run their course. The long term is about the long lasting, durable impacts of historical processes that take time to unfold, which most definitely involves technology and institutions not remaining constant.

However, I am going to try to avoid dwelling on this kind of academic distinction and focus on the historical process at hand ... and before this week's numbers had been released, I chose the Balance of Payments as a topic. Why? ... well, you'll see why.

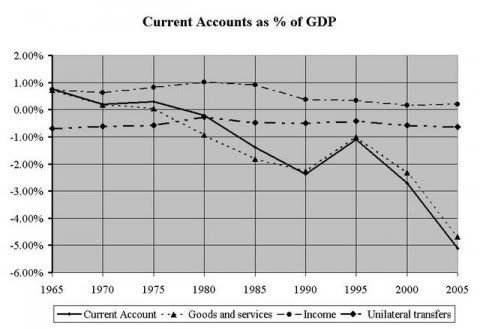
That figure up there gives 5-year sequential averages, ending in the listed year, for the three main "memorandum item" summaries listed in the US Balance of Payments. The numbers are from the Bureau of Economic Analysis. They are percents, because they are current-dollar values from the U.S. International Accounts Data
(Table 1. U.S. International Transactions), divided by annual US current GDP.

This is sequential 5 year averages precisely because I want to take the long view. The solid line shows the overall current account balance, made up of the trade balance (goods and service), income balance and balance on unilateral transfers.

As you can see, while there are interesting stories in the last two parts, the big splash headline story is all in the trade deficit.

This is what a trade deficit blow-out looks like. Just in case someone asks you for an example, you can send them that graph. And remember -- this is a 5 year sequential average,. The actual values in current US$:
  • 2001, -$389b current (-$363b trade)
  • 2002, -$472b current (-$421b trade)
  • 2003, -$528b current (-$495b trade)
  • 2004, -$665b current (-$611b trade)
  • 2005, -$792b current (-$717b trade)
So it is both very bad, and getting worse at a rapid rate.

The two main cross-sections for this are by industry and by country or region that we trade with, and I plan to look at each of those in more detail in upcoming weeks. However, right now I want to think a bit about what this massive trade deficit blow out means for the overall state of the USofAmerican Economy.

Impact On Savings

First there's savings. Gross new saving in a year is the same as net assets created by the main sectors of the economy: consumer borrowing, business investment in newly produced assets (eg, equipment), government borrowing from the private sector (domestic finance of the budget deficit), and our net private lending abroad.

Consumers going deeper into debt are "dissaving", so that when we look at net savings, growth in consumer debt has already been netted out.

And the effect of the trade deficit on the rest? We need to borrow from abroad to finance this massive trade deficit. In the aggregate, the trade deficit is sending all of the financial wealth created by government borrowing and sending it overseas, topped up by hefty chunk of the financial wealth that is claiming benefits from business investment in productive capacity.

Or, from an income-flow perspective, the Saving can not take place because the income from which to save flowed overseas instead of reciruclating inside the US.

And since the trade deficit is getting very bad, very quickly, saving in this country is collapsing (US savings improves, but still negative). Household savings rates are already negative, so that the net saving that is taking place is restricted to growth in corporate retained earnings. It is an open question how much "negative saving" (net borrowing) by households the financial sector can sustain ... but if we begin to reach a limit there, attention will shift to the financial footing of US-based corporations.

Impact on Industrial Development

Most technological progress is embedded in the equipment we use to produce and the techniques we use to organize the production process. This means that a lot of the productivity gains from technological progress arises from learning by doing.

And for more and more goods and services, we ain't the ones doing it. When the doing occurs overseas, that is where the gains from technological progress occurs. And those productivity gains are the bedrock foundation for providing ongoing real income growth ... growth in terms of the purchasing power of the normal hourly wage.

There is also a positive feedback relationship between private productivity gains and public contributions to productivity, from education, basic infrastructure, and basic research -- that is, between private productivity gains and government investment.

When industry gains in productivity, that increases the ability of the economy as a whole to meet government demands for goods and services without inflation. And when those government demands include a substantial amount of government investment spending, it both lays the foundation for new rounds of learning by doing in those industries, but also helps to spread opportunities for productivity gains in other parts of the economy.

Social Insurance and the Dependency Ratio

An issue that we will be facing over the next twenty years, as the Baby Boomer generation retires, is the dependency ratio. How many dependents are there for each full time worker (or equivalent)?

Many African nations have long had very high dependency ratios, with children representing almost all the dependents. Family planning and other population control measures were the standard policies offered to cope with the problem. However the dependency problem on the continent of Africa has become even more severe in the past decade due to the HIV AIDS epidemic.

The problem is supporting dependents out of the goods and services produced by workers and providing adequate rewards to those workers at the same time.

However, for national retirement schemes like Social Security, there has long been an upside that helps balance this out. When Social Security checks are spent, that provides a stimulus to the economy. As long as we have a technologically progressive economy, boosting production leads to productivity gains, and productivity gains makes it easier to share income between workers and dependents ... because there is more to go around.

Why doesn't the same happen in many African nations? There is a clear problem: a very large share of the goods bought are imported, so that the productivity gains from learning by doing are not happening within the African nation. Instead, they are happening overseas, primarily in Europe, the US, Japan and China.

And there's the problem: the trade deficit blow-out means that we are becoming less and less like the US of the 1950's, and more and more like a developing nation in Africa. We are becoming more and more dependent on imports. And so the extra income paid for the imports by Social Security recipients flows overseas, and the productivity gains occur over there.

The dependency ratio will rise, inexorably. So this is a problem that will grow even faster than the trade deficit itself. That is, the problem is getting more serious per dollar of trade deficit, and we have a trade deficit blowout.

Waddya We Do About It?

So, its a serious problem ... and it is entangled in most of the other serious problems we facing, making them worse. What do we do about it?

I'm not going to set out any policy proposals today. That would be premature, before I have a closer look at the cross-sections by industry and by trading relationship. But the general menu that policy proposals will be taken from include:
  • Boosting exports by making our products more attractive
  • Cutting imports with some form of tarrif
  • Cutting imports with some form of non-tarriff barrier
  • Depressing the US exchange rates to make exports cheaper and imports more expensive
  • Boosting balanced trade, to grow the economy relative to the trade deficit
And without giving the game away prematurely, four of those five those options will almost certainly show up. I'm not a big fan of non-tarriff barriers to trade, because they tend to create industries that rely on political favors for their profits, rather than relying on productivity gains. But all four of the others are going to show up, in one form or another.

This is a good time for y'all to jump in, since I am now marking this entry, to be continued ...