Saturday, March 17, 2012

Weekly Indicators: summer in spring edition

- by New Deal democrat

Starting with the monthly reports, retail sales were up strongly, even after accounting for inflation. Industrial production was flat for February, but January was revised significantly higher. Capacity utilization increased, but January was revised down. The Empire State and Philly Fed regional reports were generally positive. YoY inflation at all levels decreased. Consumer sentiment, a leading indicator, declined slightly.

I watch the high frequency weekly indicators because any turning pointwill show up in these indicators first. This week they remained mixed, but generally positive.

Let's review from positive to negative.

Housing reports were positive:

The Mortgage Bankers' Association reported that the seasonally adjusted Purchase Index increased +4.4% from the prior week, although it was still -0.4% lower YoY. This is the third week of a strong rebound from the bottom of its two year range. The Refinance Index decreased -4.1% from the previous week, but was still near its highest level in over half a year.

YoY weekly median asking house prices from 54 metropolitan areas at Housing Tracker were up +3.4% from a year ago. This number peaked at over +4% a month ago. It remains at odds with the Case-Shiller reports of worsening YoY declines in price for comparable sales. Typically non-seasonally adjusted home sales prices peak in about June, so we should see in the next 15 weeks which one of the two metrics is going to turn.

Employment related indicators were positive or neutral:

The Department of Labor reported that Initial jobless claims fell 11,000 to 351,000 last week. The four week average was flat at 355,000. These remain close to the lowest readings in 4 years.

The Daily Treasury Statement showed that for thefirst 11 days of March, $89.8 B was collected wvw. $89.1 B a year ago. In the last 20 reporting days, $163.1 B was collected vs. $162.4 B for the eequivalent 20 day period in 2011, an increase of 0.4%, a very weak advance.

The American Staffing Association Index remained at 87. It remains midway between its 2011 and 2007 levels. Seasonally we want to see this move slightly higher over the next couple of weeks.

Sales remained positive.

The ICSC reported that same store sales for the week ending March 10 rose +2.3% w/w, and also rose only +1.7% YoY. Johnson Redbook reported a 3.3% YoY gain. This week was an improvement, which featured a rare sub-2% YoY reading. After a week of YoY negative readings, the 14 day average of Gallup daily consumer spending returned to weakly positive readings this week.

Money supply was generally positive to flat:

M1 was flat last week, and also fell -0.4% month over month. On a YoY basis it fell to +17.4%, so Real M1 is up 14.6%. YoY. M2 was up +0.2% for the week, and also up +0.2% month over month. Its YoY advance remained at +9.8%, so Real M2 was up 7.0%. In short, real money supply indicators continue slightly less strongly positive on a YoY basis, although not so much as in previous months, and have generally stalled in the last couple of months.

Bond prices fell and credit spreads were flat:

Weekly BAA commercial bond rates rose +.03% t0 5.11%. Yields on 10 year treasury bonds also rose +.03% to 2.00%. The credit spread between the two, which had a 52 week maximum difference of 3.34% in October, reamined at 3.11%. As I have previously said, narrowing credit spreads are not at all what I would expect to see if we were going into a recession.

Rail traffic remained negative but with an explanation.

The American Association of Railroads reported a -4600 car decline in weekly rail traffic YoY for the week ending March 10, 2012. Intermodal traffic was up 9200 carloads, or +4.2%, but other carloads decreased -13,900, or -4.9% YoY. The entire decline in carloads is still due to coal shipments which were off 17,300 carloads or -13.1%. Railfax;s graph of YoY traffic by types remains in a positive trend.

The energy choke collar remains engaged:

Gasoline prices are about 7.5% higher than one year ago while usage continues to be much lower: Oil was steady at $107.06. Gas at the pump rose another $.04 to $3.83. Both of these are significantly above the point where they can be expected to exert a constricting influence on the economy. Gasoline usage, at 8415 M gallons vs. 8830 M a year ago, was off -4.8%. The 4 week moving average is off -7.2%. Both readings, while substantially less than one year ago, are in accord with readings from the last 6 months and unlike last week, do not warn of further weakness.

Turning now to high frequency indicators for the global economy:

The TED spread remained steady at 0.390. This index remians slightly below its 2010 peak, and has declined from its 3 year peak of 2 months ago. The one month LIBOR also remained at 0.242. It is well below its 12 month peak set 2 months ago, remains below its 2010 peak, and has returned to its typical background reading of the last 3 years.

The Baltic Dry Index at 874 was up 50 from 824 one week ago, and up 224 from its 52 week low, although still well off its October 52 week high of 2173. The Harpex Shipping Index was up 10 from 376 to 386 in the last week, up 11 from its 52 week low. Please remember that these two indexes are influenced by supply as well as demand, and have generally been in a secular decline due to oversupply of ships for over half a decade. The Harpex index concentrates on container ships, and led at recent tops and lagged at troughs. The BDI concentrates on bulk shipments such as coal and grain, and lagged more at the top but turned up first at the 2009 trough.

Finally, the JoC ECRI industrial commodities index rose slightly from 126.00 to 126.06. I have decided to report this as part of the indicators for the global economy, which ought to tell you a severe limitation I helieve it has as a barometer of the US economy.

That February real retail sales came in strong as anticipated is a welcome sign that the expansion is continuing. Same store sales were tepid and withholding taxes were weak, however. It is likely that the non-winter winter is playing havoc with railroad statistics, and may be influencing home sales. All that being said, the warning signs from last week were not repeated this week. There is some weakness, but there is no sign of any imminent contraction.

Have a nice weekend.

Friday, March 16, 2012

Weekend Weimar, Beagle and Pit Bull

It's that time of the week.  Stop thinking about the market for a few days.  NDD will post the weekly indicators this weekend; we'll be back full time on Monday.  Until then ...


Is the Wall Street Journal Worth It Anymore?

Sometime over the next few months, my yearly digital subscription for the WSJ comes due.  And, once again, I'm faced with this question:

Is it worth it anymore?

When Murdoch was looking to buy the journal, I wrote a column at the Huffington Post, titled, "Please don't sell the WSJ to Murdoch" when the deal was going through.  Of course, the then owners didn't listen to me (not that they would anyway).  But frankly, I was then very worried about a great newspaper with a pure market and economic perspective being taken over by the Fox News Machine with the requisite lowering of journalistic standards and content that would follow.

Over the last few years, the paper has changed. If I remember correctly, Murdoch wanted to make the WSJ more like an alternative to the NYT -- a paper with a broader focus but with a solid journalistic core.  Unfortunately, the Journal is writing less and less pure economic writing.  Their blogs are OK, but certainly not great.  And I read the paper less and less, instead going to the FT or Bloomberg first and staying there the longest.  I do have to admit that perhaps I should be reading Marketwatch instead, as that probably has more of the content that I really want. 

And frankly, the competition really is that much better.  The Financial Times stands out as the premiere paper in the world financial news arena.  They are hands down, clearly, the best.  And their blogs are AWESOME -- I mean, they have great, insightful content about timely topics.  Then there is Bloomberg, which is also really good -- although I have to admit, I really don't like their website very much.  But they have great, broad economic coverage.  The WSJ comes in a distant (very distant) third to both the preceding sources.  Basically, by diversifying their coverage, the Journal has really gotten away from their core business -- writing insightful articles on economics, the markets and the economy.

At the same time, I've been reading the journal for over 20 years.  I have a tremendous nostalgia for the paper, because it used to be a very good source of pure economic information for the US.  And, if I drop the subscription, I can always pick it up again.

At the same time, I really miss the old journal.  It was a great paper.  While the editorial page was, well, nuts, I never read that.  The rest of section A was great, and the Market section (Section C) was wonderful.  Unfortunately, those days appear to be gone as Murdoch's influence is felt more and more.  And certainly, not for the better.

The BRIC Countries: China

From the CIA Fact Book:


Since the late 1970s China has moved from a closed, centrally planned system to a more market-oriented one that plays a major global role - in 2010 China became the world's largest exporter. Reforms began with the phasing out of collectivized agriculture, and expanded to include the gradual liberalization of prices, fiscal decentralization, increased autonomy for state enterprises, creation of a diversified banking system, development of stock markets, rapid growth of the private sector, and opening to foreign trade and investment. China has implemented reforms in a gradualist fashion. In recent years, China has renewed its support for state-owned enterprises in sectors it considers important to "economic security," explicitly looking to foster globally competitive national champions. After keeping its currency tightly linked to the US dollar for years, in July 2005 China revalued its currency by 2.1% against the US dollar and moved to an exchange rate system that references a basket of currencies. From mid 2005 to late 2008 cumulative appreciation of the renminbi against the US dollar was more than 20%, but the exchange rate remained virtually pegged to the dollar from the onset of the global financial crisis until June 2010, when Beijing allowed resumption of a gradual appreciation. The restructuring of the economy and resulting efficiency gains have contributed to a more than tenfold increase in GDP since 1978. Measured on a purchasing power parity (PPP) basis that adjusts for price differences, China in 2010 stood as the second-largest economy in the world after the US, having surpassed Japan in 2001. The dollar values of China's agricultural and industrial output each exceed those of the US; China is second to the US in the value of services it produces. Still, per capita income is below the world average. The Chinese government faces numerous economic challenges, including: (a) reducing its high domestic savings rate and correspondingly low domestic demand; (b) sustaining adequate job growth for tens of millions of migrants and new entrants to the work force; (c) reducing corruption and other economic crimes; and (d) containing environmental damage and social strife related to the economy's rapid transformation. Economic development has progressed further in coastal provinces than in the interior, and by 2011 more than 250 million migrant workers and their dependents had relocated to urban areas to find work. One consequence of population control policy is that China is now one of the most rapidly aging countries in the world. Deterioration in the environment - notably air pollution, soil erosion, and the steady fall of the water table, especially in the north - is another long-term problem. China continues to lose arable land because of erosion and economic development. The Chinese government is seeking to add energy production capacity from sources other than coal and oil, focusing on nuclear and alternative energy development. In 2010-11, China faced high inflation resulting largely from its credit-fueled stimulus program. Some tightening measures appear to have controlled inflation, but GDP growth consequently slowed to near 9% for 2011. An economic slowdown in Europe, is expected to further drag Chinese growth moving into 2012. Debt overhang from the stimulus program, particularly among local governments, and a property price bubble challenge policymakers currently. The government's' 12th Five-Year Plan, adopted in March 2011, emphasizes continued economic reforms and the need to increase domestic consumption in order to make the economy less dependent on exports in the future. However, China has made only marginal progress toward these rebalancing goals.


Their GDP is broken down thusly:

agriculture: 9.6%
industry: 47.1%
services: 43.3% (2011 est.)
 
Let's look at some macro numbers:


When people think about China, the above charts are what come to mind -- amazingly high levels of growth.  Notice how the recession didn't make a dent in China's GDP trajectory (top chart); the lower chart shows the strength of China's overall growth. 


The above chart of industrial production shows  a big reason for China's growth; they're an industrial juggernaut.


The YOY retail sales growth rates are incredibly strong, although the recent reading is a bit weaker.


The unemployment rate is very low.


The above two charts show the primary problem with China's economy: high inflation, which has led to higher interest rates.


Morning Market Analysis


Let's start with the weekly QQQ as this is a great looking chart.  After moving though resistance, prices followed-through.  Also note the EMA picture, rising MACD, A/D and CMF.  Bottom line -- this says bull market.


While not as strong as the QQQ chart, the SPYs are also moving higher.  The 60 minute chart shows prices are in a strong, upward sloping channel, which the daily chart shows prices are still moving higher, albeit at a slower pace than the QQQs.


The IWMs and IYTs are the laggards in the market right now, but both are right at resistance.  Notive the huge volume spike on the IYTs (transports, lower chart).  In an ideal really, we'd see both of these move though upside resistance soon to confirm the rally.


The copper ETF is still trading around the 200 day EMA with the shorter EMAs offering little or no guidance.  However, the MACD is declining. 


Yesterday, grains broke through resistance (top chart).  The lower chart shows that on the weekly basis, there is little in the way of prices going forward, with the exception of some action right around 50 on the chart.

Thursday, March 15, 2012

1954 Summation

The following are links to stories that deal with 1954

GDP
Investment
Industrial Production/Manufacturing
Prices and Fed Policy
Imports and Exports
Government Spending
PCEs

Bonddad Linkfest

  1. The road forward for the Republicans (WaPo)
  2. Two trends that bode well for the economy: auto sales and new household formatioin (New Yorker)
  3. What America sells to the rest of the world (Planet Money)
  4. What do oil price increases do to the economy? (The Atlantic)
  5. India leaves rates unchanged (FT)
  6. India's central banks statement (Reserve Bank of India)
  7. Fitch downgrades UK's outlook (FT)
  8. Initial claims drop 15,000 (DOL)
  9. Chilean copper output declining (FT)
  10. Federal Tax Receipts (Dr. Ed)

Employment and unemployment trend updates

- by New Deal democrat

Several weeks ago I called the February payroll number to be 295,000. I also suggested that the unemployment rate would continue to drop. Both numbers came in a little light, but neither did anything to break the ongoing trend.

First, here's the scatterplot of initial jobless claims vs. monthly payrolls since April 2009:


So far there has been a very linear relationship between the two. With almost every initial payroll report in the last year being revised upward, it seems likely that ultimately the February number will be right in the middle of that trend. Additionally, it's worth pointing out that if we were on the cusp of a recession as ECRI believes, there would be a clear break in that trend, with a much weaker payrolls number for a similar initial jobless claims average. There's no indication of such a break in these numbers.

Secondly, here is the comparison between the initial jobless claims rate and the unemployment rate. These have almost always tracked one another closely in the past, with the unemployment rate lagging by several months:


Had nearly 500,000 people not re-entered the workforce, the unemployment rate for February would have dropped to 8.0%. Even so, this relationship continues to predict that the unemployment rate will continue to drop, probably below 8% by summer sometime.

The BRIC Countries: India

From the CIA World Fact Book:
India is developing into an open-market economy, yet traces of its past autarkic policies remain. Economic liberalization, including industrial deregulation, privatization of state-owned enterprises, and reduced controls on foreign trade and investment, began in the early 1990s and has served to accelerate the country's growth, which has averaged more than 7% per year since 1997. India's diverse economy encompasses traditional village farming, modern agriculture, handicrafts, a wide range of modern industries, and a multitude of services. Slightly more than half of the work force is in agriculture, but services are the major source of economic growth, accounting for more than half of India's output, with only one-third of its labor force. India has capitalized on its large educated English-speaking population to become a major exporter of information technology services and software workers. In 2010, the Indian economy rebounded robustly from the global financial crisis - in large part because of strong domestic demand - and growth exceeded 8% year-on-year in real terms. However, India's economic growth in 2011 slowed because of persistently high inflation and interest rates and little progress on economic reforms. High international crude prices have exacerbated the government's fuel subsidy expenditures contributing to a higher fiscal deficit, and a worsening current account deficit. Little economic reform took place in 2011 largely due to courruption scandals that have slowed legislative work. India's medium-term growth outlook is positive due to a young population and corresponding low dependency ratio, healthy savings and investment rates, and increasing integration into the global economy. India has many long-term challenges that it has not yet fully addressed, including widespread poverty, inadequate physical and social infrastructure, limited non-agricultural employment opportunities, insufficient access to quality basic and higher education, and accommodating rural-to-urban migration.
India looks more like Russia than Brazil.  The country has some solid strengths -- especially in the  intellectual property fields -- but still has a high rate of poverty, poor investment and a fairly stodgy political systems that gets in the way more than it helps overall.

Here's ho their economy breaks down:

agriculture: 18.1%
industry: 26.3%
services: 55.6% (2011 est.)
Let's look at the data:

 The top chart shows overall GDP growth, which has been increasing at a strong clip.  However, notice that from 2008-2010, the entire economy was hit hard by the recession.  However, we see a return to incredibly strong growth in 2011.

The bottom chart shows the rate of GDP change, YOY.  Like Brazil, we see a clear slowing over the lost 4 quarters, largely because high inflation is sapping demand and forcing the central bank to run high interest rates.


Overall industrial production has been declining on a YOY basis over the last two years.   Also note the dip into negative territory recently -- not a good sign.


Information on the unemployment rate is inconclusive.  


India is a net importer, largely because it has little domestic energy resources.


India ha a stubbornly high inflation rate for the last two years.  We see the spike to 16% YOY in early 2010.  While it has come down, it has taken over two years of effort to do so.  The primary method of combating it has been a gradual increase in interest rates over the same period of time, which is obviously a big reason for the recent slowdown in overall economy growth.

Morning Market Analysis


After yesterday's Fed announcement, it seems appropriate to look at the daily chart of all the equity markets.  The IWMS (top chart) are still below resistance levels established in early February, indicating that the "risk on" trade still has not caught fire.  The QQQs are performing well -- they jumped sharply on Monday are rose a bit more yesterday to hit resistance.  The SPYs are also moving higher and are above resistance levels.

Ideally, we'd like to see the IWMs move through resistance to show the rally is ready to take the next step.


The treasury market continued its sell-off across the curve yesterday, with all the major ETFs making big moves lower.  This should provide trading ammunition for the equity market.


Wednesday, March 14, 2012

Bonddad Linkfest

  1. Latest crop report downgrades outlook (Agrimoney)
  2. Western European drought may hit agricultural prices (Agrimoney)
  3. USDA WASDE report (USDA)
  4. Oil imports down, domestic production up (LA Times)
  5. German investor confidence increases (BB)
  6. Obama will challenge China's rare earth export limitations (BB)
  7. Yen at lowest levels versus the dollar in 11 months (BB)
  8. Brazil winning currency fight (BB)
  9. How the depression made Keynsians out of capitalists (BB)
  10. The sad state of Goldman (BP)

Retail Sales and the Health of the US Consumer

When I last reviewed the US consumers position (early last week), I noted the following:
The good news in the above charts lies in the durable goods numbers, which show a consumer who is confident enough int the future to take on a big purchase.  However, the stalling of PCEs and near-stalling or retail sales for the four months is concerning and clearly needs to be watched over the next few months.
Yesterday's retail sales release helps to alleviate some of my concern.

From Bloomberg:
Americans heartened by an improving labor market boosted spending at stores and malls by the most in five months, adding to signs that the world’s largest economy is gaining strength.

The 1.1 percent advance followed a 0.6 percent increase in January that was larger than previously estimated, according to Commerce Department data issued today in Washington. Sales rose in 11 of 13 categories, including auto dealers and clothing stores, showing gains in demand were broad based.
.....
“There are a number of factors that are helping release this pent-up demand,” Don Johnson, vice president of GM’s U.S. sales, said on a March 1 conference call with analysts. “They include stronger employment, good credit availability, and both of those are leading to improving consumer sentiment.”

Automobile stockpiles jumped by the most in more than a year in January, leading a 0.7 percent increase in business inventories, the Commerce Department said in a separate report today.
Retail sales excluding autos increased 0.9 percent in February, exceeding the median forecast of economists surveyed that called for a 0.7 percent gain.
As I noted before, the continued move higher in durable goods purchases is encouraging, as it indicates a certain level of confidence among consumers.


The above chart from the report shows that gains were broad-based/


 I've highlighted two points from the report.

1.) Auto sales are still strong.  That is very encouraging.
2.) Building materials and supplies increased strongly as well.

Overall, this report indicates the consumer is still buying things -- which is a very welcome bit of news.

The census report can be found here.


BRIC's: Russia

From the CIA Factbook:
Russia has undergone significant changes since the collapse of the Soviet Union, moving from a globally-isolated, centrally-planned economy to a more market-based and globally-integrated economy. Economic reforms in the 1990s privatized most industry, with notable exceptions in the energy and defense-related sectors. The protection of property rights is still weak and the private sector remains subject to heavy state interference. Russian industry is primarily split between globally-competitive commodity producers - in 2009 Russia was the world's largest exporter of natural gas, the second largest exporter of oil, and the third largest exporter of steel and primary aluminum - and other less competitive heavy industries that remain dependent on the Russian domestic market. This reliance on commodity exports makes Russia vulnerable to boom and bust cycles that follow the highly volatile swings in global commodity prices. The government since 2007 has embarked on an ambitious program to reduce this dependency and build up the country's high technology sectors, but with few results so far. The economy had averaged 7% growth in the decade following the 1998 Russian financial crisis, resulting in a doubling of real disposable incomes and the emergence of a middle class. The Russian economy, however, was one of the hardest hit by the 2008-09 global economic crisis as oil prices plummeted and the foreign credits that Russian banks and firms relied on dried up. The Central Bank of Russia spent one-third of its $600 billion international reserves, the world's third largest, in late 2008 to slow the devaluation of the ruble. The government also devoted $200 billion in a rescue plan to increase liquidity in the banking sector and aid Russian firms unable to roll over large foreign debts coming due. The economic decline bottomed out in mid-2009 and the economy began to grow in the third quarter of 2009. However, a severe drought and fires in central Russia reduced agricultural output, prompting a ban on grain exports for part of the year, and slowed growth in other sectors such as manufacturing and retail trade. High oil prices buoyed Russian growth in 2011 and helped Russia reduce the budget deficit inherited from the lean years of 2008-09. Russia has reduced unemployment since 2009 and has made progress on reducing inflation since 2010. Russia's long-term challenges include a shrinking workforce, a high level of corruption, difficulty in accessing capital for smaller, non-energy companies, and poor infrastructure in need of large investments.


The above indicates the country is still fairly primitive.   First, they are still very commodity dependent.  In addition, there is still heavy state interference in the economy along with a less than developed infrastructure.  While a middle class has emerged, the county as a whole has a long way to go.

Their economy is broken down thusly:

agriculture: 4.2%
industry: 37%
services: 58.9% (2011 est.)
They have the following crops: grain, sugar beets, sunflower seed, vegetables, fruits; beef, milk and industrial sectors:
complete range of mining and extractive industries producing coal, oil, gas, chemicals, and metals; all forms of machine building from rolling mills to high-performance aircraft and space vehicles; defense industries including radar, missile production, and advanced electronic components, shipbuilding; road and rail transportation equipment; communications equipment; agricultural machinery, tractors, and construction equipment; electric power generating and transmitting equipment; medical and scientific instruments; consumer durables, textiles, foodstuffs, handicrafts
Let's go to the data: 


 The top chart shows  that overall, GDP has been growing at a strong pace for the last 10 years.  The lower chart shows the growth rate before the recession was coming in in the 7.5%-9% range, whereas after the recession the growth is far slower.  In short, the economy hasn't recovered as much as it should have from the recession yet.


Overall, industrial production is still growing at a pretty solid clip.


 Retail sales are all over the place, indicating the consumer is a bit hesitant and that the economic stats are a bit confused in this area.


The unemployment rate has come down. While the recession hit the country hard, it appears that companies there are hiring.


Russian was hit hard by inflation over two years ago.  As a result, their interest rates spiked to 12%.  However, over the last year, inflation has dropped to a far more manageable rate of annual change, allowing the central bank to lower interest rates -- although Russian rates are still very high.


Morning Market Analysis

The Big news yesterday in the markets was the treasury sell-off.  One of the primary problems for the equity markets going forward has been all the money tied up in government bonds.  Yesterday, we finally saw meaningful technical movement in that market across a variety of maturities.


The IEFs (top chart) saw a huge move lower.  While the volume would ideally be higher, the bar is strong and shows a big, intra-day sell-off.  While the IEIs are still above support (middle chart) the TLTs also moved lower, but here we see a big volume move. 


The intraday price action is very revealing.  First, we see a big gap lower at the open.  Prices moved sideways until just after 2PM.  Then we see a big drop, a rally into the 10 day EMA followed by a second wave of selling ending on the low point of the day.  Also note the big volume spike on the last bar.


Conversely, we see how the treasury sell-off and the stock market rally work in tandem.  Equity prices gapped higher at the open, rallied a bit, then moved sideways.  Then, right after 2PM, we see a big move higher.  The lower chart (the daily chart) shows prices printing a large bar on strong volume.


This is the main reason for the rally.  The Fed released its stress test results, and the financial sector rallied strongly in response.  Notice the very large bar and the very high volume spike.

Short version: yesterday's action may have driven a stake through the correction argument.  We do need to see some follow-through, however.


Tuesday, March 13, 2012

The bifurcated jobs recovery

- by New Deal democrat

Karl Smith at Modeled Behavior yesterday wrote a couple of excellent posts wherein he divided the US workforce into two parts: (1) "goods and government" vs. (2) private service jobs. He pointed out that:
Goods and Government are what we might have thought about as backbone jobs. These are police officers, fire fighters, school teachers, factory workers, construction workers. When you think of a stereotypical 1950s American, they are doing one of these jobs.
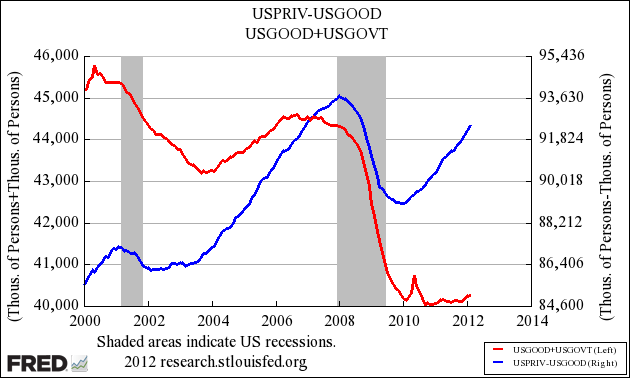
He noted that it is this group - public employees, construction workers, and manufacturing workers - who have seen little or no improvement since the bottom of the recession. Here's his graph, showing the number of "goods and government" worker jobs in red (left scale), and private service jobs in blue (right scale):


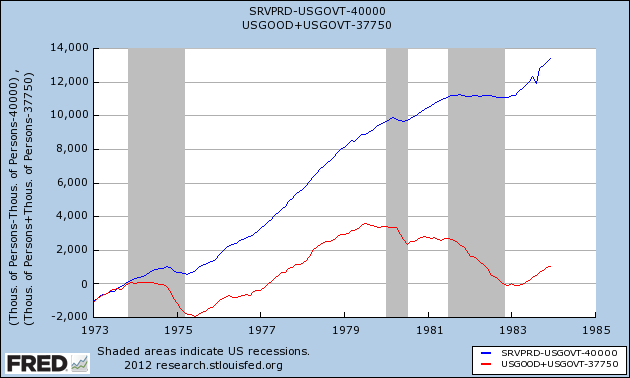
That got me thinking. One of the signature differences between the "Great Recession" and other post-WW2 recessions is how much it impacted private service jobs. To compare, here are the same two categories of jobs, "goods and government" (red) and private service jobs (blue) showing the relative impact of the two previous worst recessions since WW2 - 1974 and 1981-82 - on those categories, by showing the number of jobs in each gained or lost since their peaks just before the 1974 recession:


You can see that private service jobs were barely scratched in 1981,and actually increased during the 1974 recession!

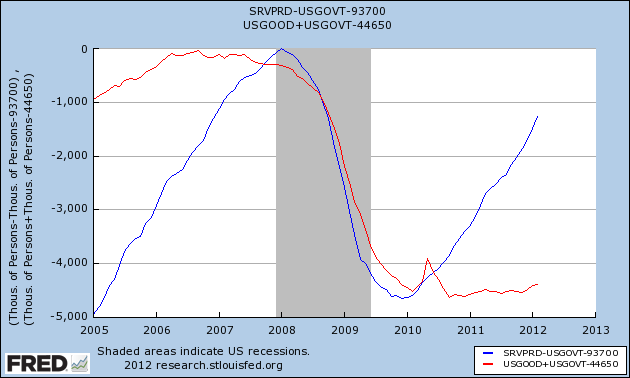
Now let's look at job losses and recoveries for the two sectors in the Great Recession. The difference between this graph and Karl's is that both categories are shown on the same scale, and show the number of jobs lost since their respective peaks immediately prior to this recession:


Unlike every other post-WW2 recession, private service jobs were slammed in this last recession. As many private service jobs were lost - about 4.5 million - as were lost in the goods and government sectors. Further, the private service sector is having close to a V-shaped recovery. Three-fourths of all private service jobs lost during the recession have already been made up. If the current rate continues, by the end of this year there will be no remaining job losses in that sector (although it will not have caught up with population growth).

Virtually the entire 5,000,000+ continuing job losses are in manufacturing, construction, and government. Manufacturing has long-standing issues of automation and offshoring, and it can be debated how much of its long-term losses are due to each factor.

Construction and government job losses, however, are another matter entirely, reflecting a colossal and unnecessary waste due to ideological political failure. We need something like $3 trillion in infrasctructure repairs to bridges, sewer and water mains, and the electric grid. We have several million idle construction workers. And we could finance the infrastructure repairs that would make this country so much more competitive and pay for itself multiple times over (see, e.g., Erie Canal and interstate highway system) by issuing debt at 2% in the open market. Further, whatever one's opinion regarding government inefficiency, police officers, firefighters, and teachers are not by any stretch its primary source -- and yet those are the government workers who have been most impacted.

If it were not for this utterly unnecessary waste, we would not have to pay for so many food stamps, we would not have to fund so much extended unemployment compensation, we would have the benefit of the professional and constructed infrastructure, and there would be probably a million or more persons employed in Karl Smith's "backbone jobs." Those employees would be supporting their families, and paying withholding, property and income taxes, with all of the resulting positive multiplier effects throughout the economy.

Instead here we are, almost three years since the bottom of the recession, having made up less than half of the total jobs lost, tolerating a bifurcated jobs recovery.