Saturday, March 31, 2007

Two Really Important Points From Barron's

This is from the trader column (subscription required):

Point 1:

Excluding erratic aircraft data, orders for big-ticket items fell in February for a second straight month -- a possible sign corporate belt-tightening may have begun. Will increasing fiscal thrift put a kibosh on hiring -- or worse, lead to job cuts?

So far, the robust job market has been a pillar holding up consumer spending and economic growth. And it's even more crucial now, as tightening credit and declining home prices put in peril America's wealth effect and spending habits.


Point 2

So far this decade, nominal gross domestic product has risen at a 5.1% pace, while outstanding credit-market debt is increasing at 8.4%, notes Punk Ziegel analyst Richard Bove. "If the long-term rates were to rise further or incomes grow at slower rates, then it seems highly likely that there would be a rash of defaults throughout the economy," he says.

The "Just Enough" Job Market

In his latest Congressional testimony, Bernanke made positive comments about the job market:

Employment has continued to expand as job losses in manufacturing and residential construction have been more than offset by gains in other sectors, notably health care, leisure and hospitality, and professional and technical services, and unemployment remains low by historical standards.


He went on to note:

The continuing increases in employment, together with some pickup in real wages, have helped sustain consumer spending, which increased at a brisk pace during the second half of last year and has continued to be well maintained so far this year. Growth in consumer spending should continue to support the economic expansion in coming quarters.


In other words, job growth is very important right now because it supports consumer spending. In fact, job growth is more important in light of decreased business and residential investment in the 4th quarter of 2006.

So, let's look at the job market to see exactly where we are. All of this information is from the Bureau of Labor Statistics. In addition, I'm going to use averages. I know this is not the best statistical methodology to use, but I want to get a feel for the employment picture.

The total civilian labor force was 142,267,000 in January 2001 and 152,974,000 in January 2007. That's an increase of 10,707,000 over 6 years, or 1,784500/year or 148,708/month. Here's a graph of the growth. It's a fairly constant upward sloping line.
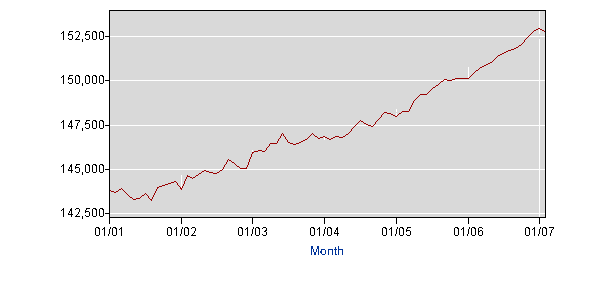
Photo Sharing and Video Hosting at Photobucket

The total number of employed people was 137,778,000 in January 2001 and 145,957,000 in January 2007, or an increase of 8,179,000, or 1,363166/year or 113,597/month. However, this figure languished until roughly the beginning of 2004 when it increased a bit faster than population growth:
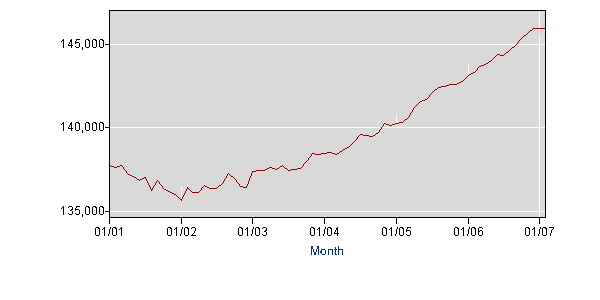
Photo Sharing and Video Hosting at Photobucket

In other words, on average, the economy has created 35,111 jobs month/less than population growth since January 2001.

However, the labor participation rate has decreased over this time from 67.2% in January 2001 to 66.2% in January 2007. In other words, a smaller percentage of the labor force is working today than in January 2001. In addition, the LPR decreased from January 2001 to early 2004 when the total number of jobs in the economy also languished. This indicates the lower participation rate may have permanently removed a certain amount of people from the market, at least for the duration of this expansion. Here's a graph of the LPR:
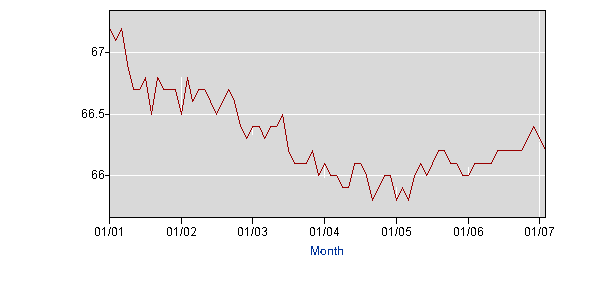
Photo Sharing and Video Hosting at Photobucket

This is why the average difference between the number of jobs created and the average increase in the total labor force isn't resulting in a higher unemployment rate. Simply put, a smaller percentage of people who could be working are in fact working.

When I labeled the job market the "just enough" job market, I was referring to the fact the market is creating just enough jobs to absorb the population that wants/can find a job/is willing to work (etc...) to work.

So long as this remains the situation, the job market should support the economy. It may prevent the housing market problems from bleeding into growth.

Friday, March 30, 2007

The Long View

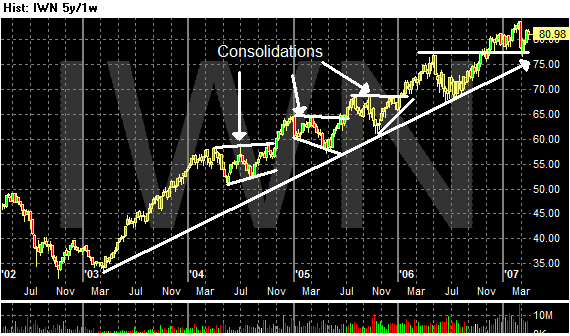
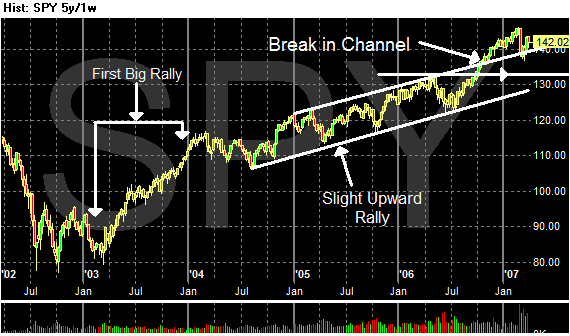
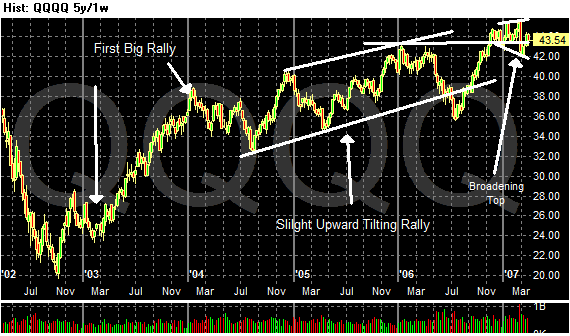
Sometimes it's a really good idea to see where the markets are in relation to the longer trend. This helps to give us an idea of where the markets are in an overall cycle.

Of the three averages I track (IWN, QQQQ, and SPY), the IWNs have the most bullish chart. It's a simple 5-year rally with various consolidations along the way.

Photo Sharing and Video Hosting at Photobucket

The SPYs had a strong rally in 2003. They sold-off in the first half of 2004. Then they entered a slightly upwardly biased pattern for the next two years. Here's the key: they broke through resistance, rallied, then fell back and slightly through resistance earlier this year. Now they have rallied from those levels.

This is still a fairly bullish chart, although all systems are not go. If the chart falls back through the upper channel line the overall 5-year rally could be in trouble. But the chart would still be within the channel started in mid-2004. If the average approaches the lower channel line, get a bit worried.

Photo Sharing and Video Hosting at Photobucket

The QQQQs have a similar chart to the SPYs, although there is one key difference. They are currently forming a broadening top that is within the upper-channel line. In addition, the average is bouncing on top of support from a high set in early 2006.

However, if the average breaks below this trend line it will still be within the channel that started in mid-2004. Bulls should worry if and when the QQQQs start to approach the lower channel line.

Photo Sharing and Video Hosting at Photobucket

The Markets Last Week

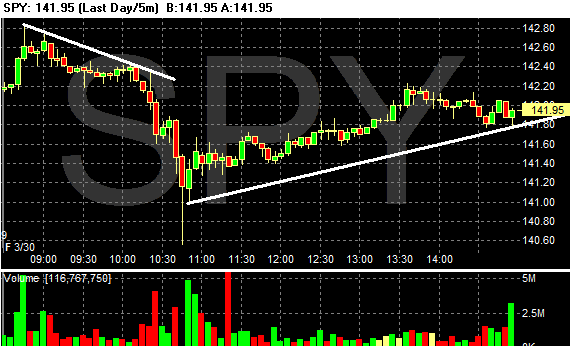
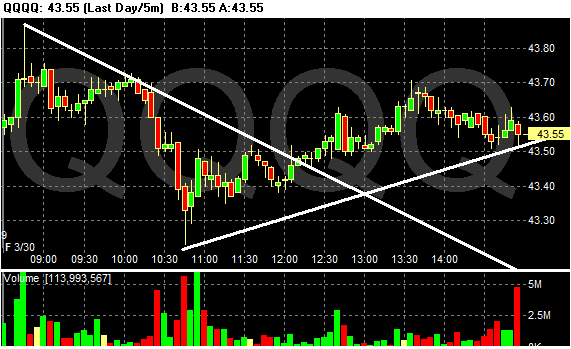
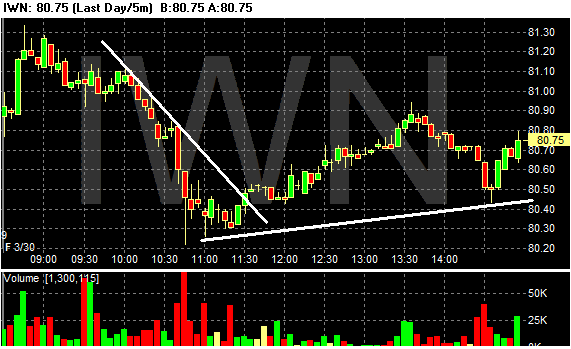
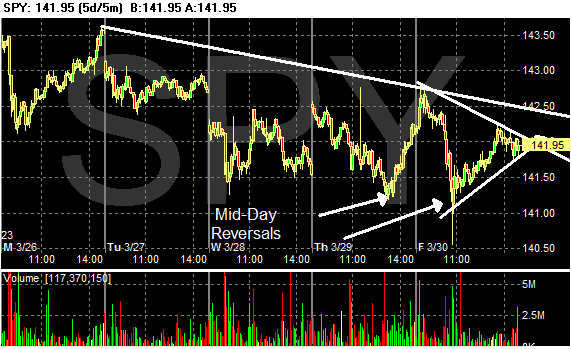
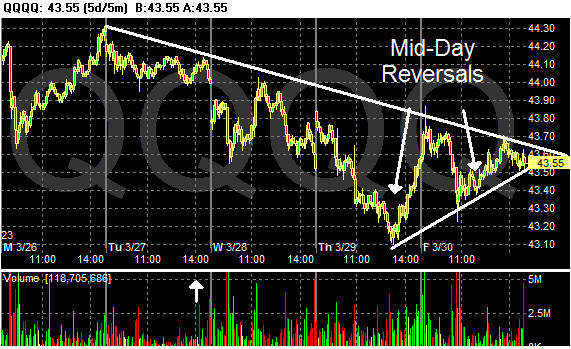
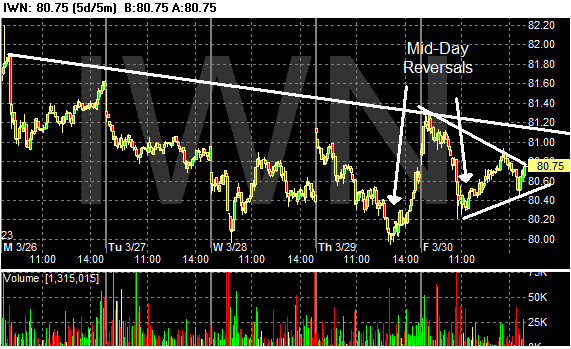
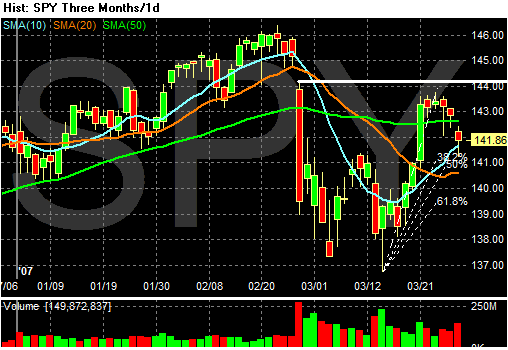
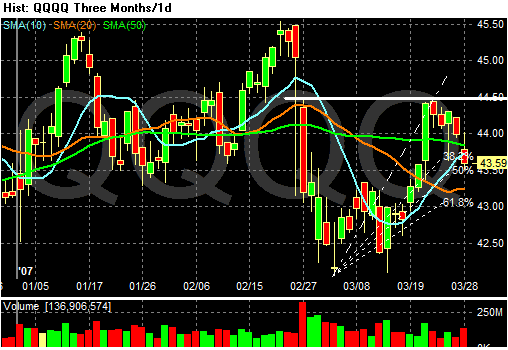
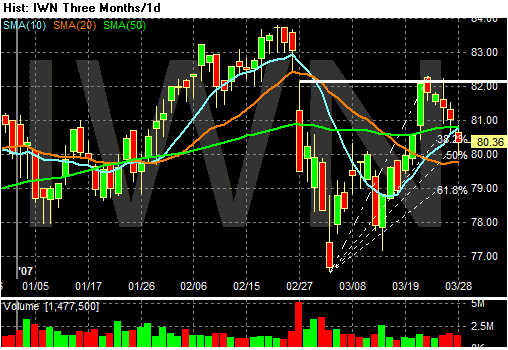
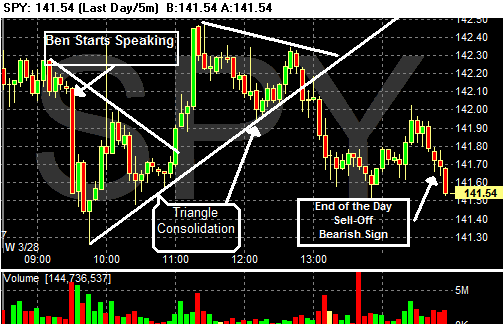
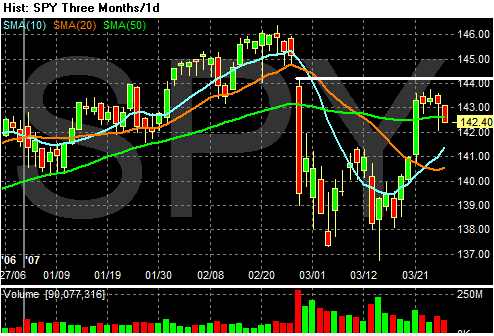
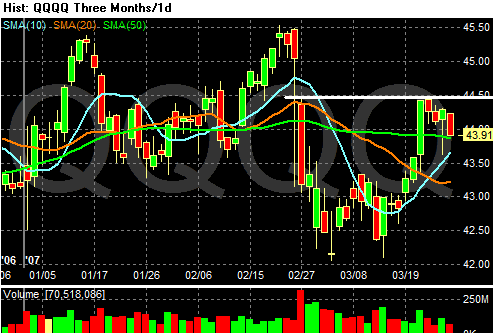
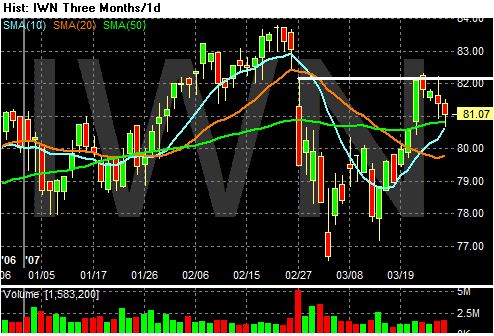
First, here are today's charts. They look very similar to yesterday's chart because -- once again -- we had a change in momentum during the trading day. Mid-day reversals are considered bullish because they indicate there is enough bullish sentiment in the markets to change direction -- to halt a downtrend.

Photo Sharing and Video Hosting at Photobucket

Photo Sharing and Video Hosting at Photobucket

Photo Sharing and Video Hosting at Photobucket

Looking at the charts for the week, you'll notice a slight downward bias, with the QQQQs being the most pronounced. However, also notice that each average ended the day in a triangle consolidation pattern for the day. That implies there could be strong price action at the beginning of the week.

Photo Sharing and Video Hosting at Photobucket

Photo Sharing and Video Hosting at Photobucket

Photo Sharing and Video Hosting at Photobucket

Chicago PMI Spikes

From CBS:

Business conditions improved markedly in the Chicago region in March, according to a closely watched business barometer.
The Chicago purchasing managers index rose to 61.7% from 47.9% in February, the NAPM-Chicago reported Friday.

It was the largest month-to-month gain in the 39-year history of the index. It was the highest reading since April 2005.

Economists were expecting an increase in the Chicago PMI to about 50%, according to a survey conducted by MarketWatch. See Economic Calendar.

Readings over 50% indicate a majority of firms in the region reported improving conditions.


This is good news, although it has definitely taken me by surprise. First -- this is a huge spike. This is not just a few points, but the largest in the reports history. Secondly, this is taking place when overall business investment dropped in the 4th quarter of 2006. That means that business sentiment has really reversed in a big way. Given the overall news we've had over the last few weeks (lower durable goods, big mortgage problems) this number just seems out of whack. I could be wrong on that, but that's just what it seems to me.

Construction Spending Up .3%

From the Census Bureau

Residential construction spending dropped 1%; all of the gains came from non-residential spending which increased 1.5%.

Residential spending is down 15% from year ago levels while non-residential spending is up 13.6%.

Non-residential construction has increased from 44% of the construction market in February 2006 to 51% in February 2007. That means so long as non-residential construction increases at more or less the decrease in residential spending, non-residential should be able to take-up the slack in residential spending.

Personal Income Up .6%

First a mea culpa. I used to use the NBER site for links to current news releases. I used their link today to get the personal income information. Unfortunately for me, they still had the old link up so I analyzed the February report. This is the second time the NBER has been late in switching links, so I won't be using their site for this purpose anymore.

Anonymous (a regular commenter) caught that and commented on it. Thanks to his pointing that out I only looked like a schmuck for about an hour.

NOW -- onto this month's report.

From Bloomberg:

Both incomes and spending gained 0.6 percent last month from January, the Commerce Department said today in Washington, twice the gains anticipated by economists. The report's price gauge tied to spending patterns and excluding food and energy rose 0.3 percent from the prior month.

Growth in wages and employment means consumers have money to help offset rising gasoline prices and weakening home values. At the same time, the higher-than-expected price report gives Fed Chairman Ben S. Bernanke, who this week described inflation as his chief concern, less room to reduce rates should the economy falter.


Looking at the numbers in the report, we have some interesting developments.

At an annual rate, the quarterly figures for consumer spending at an annual rate on durable goods was a lackluster 1.6% in the 4th quarter. That follows as an annual increase of 18.6%, -.9 and and increase of 5.3%
in the 1st - 3rd quarter of 2006. Assuming that consumers purchase durable goods when they are feeling confident (usually because these purchases involve longer-term financing) these numbers may indicate a decrease on overall consumer confidence.

Once again, the personal savings rate was negative for February. This trend has been in place for a long time now and it indicates the US consumer continues to spend more than he makes. If the US economy has a bad recession, this lack of savings could be a real problem.

Are Oil Prices Breaking Out?

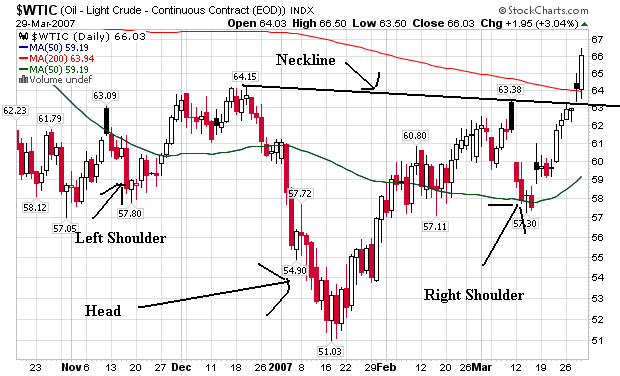
Here's a daily of oil prices. Recent price action has taken prices above the neckline in the head and shoulders formation.

Photo Sharing and Video Hosting at Photobucket

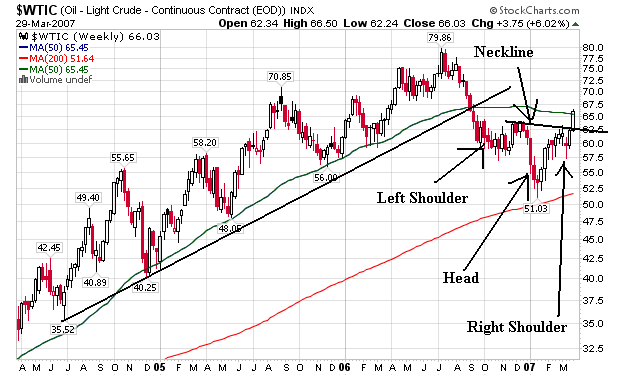
Here's a look at the weekly chart. This gives us a better view of how this price action is playing out over the longer term.

Photo Sharing and Video Hosting at Photobucket

Also remember, we have a strong fundamental reason for this price action -- the Iranian situation and lower stockpiles of oil and gasoline. In other words, fundamental and technical events have converged to run prices higher for now.

It's possible that when the Iranian situation is solved prices will make a pullback. When that happens, we'll have to see if the neckline provides support rather than resistance for prices.

Here's more:

Although the market has come off highs struck earlier this morning, analysts expect price increases to be sustained going into the weekend. "People are taking long positions (ahead of the weekend) as a precautionary move," said BNP Paribas analyst Harry Tchilinguirian. "If the situation doesn't get resolved quickly, momentum from the event will be maintained." But although the situation remains uncertain, the market is not betting on further sharp increases in price

"A lot of people are betting on resistance heading towards the 70 usd level," said Michael Davies, an analyst at Sucden, adding however that he still sees more risks to the upside. The US sought to allay fears the situation could escalate yesterday. "There is no reason for us to choose a confrontational path now," US Under-Secretary Of State Nicholas Burns told Congress


Traders taking long positions before the weekend indicates they are bullish. Essentially, these moves indicate traders think the news has a higher possibility of being bullish for the oil market. They purchase the contracts to take advantage of that possibility.

$70/bbl resistance makes sense. Round numbers usually provide technical support and resistance. Also, a move to $70 from recent lows will be an increase of 22% (assuming the recent low of around $57/bbl). And $70/bbl provided resistance in the 3rd quarter of 2005 and early 2006.

Thursday, March 29, 2007

GDP Revised Upwards to 2.5%

From CBS Marketwatch:

The nation's economy grew at a 2.5% annual pace in the final three months of 2006, slightly faster than the previous estimate of 2.2%, the Commerce Department reported Thursday.

The upward revision to gross domestic product mainly reflected higher prices for trucks that boostedvehicle inventories. Investments in software were revised slightly lower. Exports were revised higher.

"The expansion is intact, but growth remains below potential," wrote Augustine Faucher, an economist for Moody's Economy.com.


Bloomberg adds:

The difference between the second and third estimates of growth was that inventories grew more than previously thought, suggesting production may be slow to pick up. Stockpiles subtracted 1.2 percentage points from growth, less than the 1.4 percentage points previously estimated.

Little Help

``More notable than the aggregate revision per se were the sources of revision,'' said Peter Kretzmer, a senior economist at Banc of America Securities LLC in New York. ``The slightly higher inventory accumulation in the final report does not add to economic momentum.''


From Reuters:

"The (GDP) headline number looks better, but the gut of the report is a little worse," said Robert Brusca, chief economist for Fact and Opinion Economics in New York. "Going forward, we still don't know, but you should be disturbed by the lack of capital spending."

Business investment spending fell at a 3.1 percent annual rate in the fourth quarter rather than the 2.4 percent decline the government estimated a month ago. That contrasted with a 10 percent third-quarter jump.

Spending on new-home building plummeted at a 19.8 percent rate -- steeper than the 19.1 percent fall estimated a month ago -- after an 18.7 percent drop in the third quart

It was the fifth quarter in a row that residential spending has fallen and the steepest since a 21.7 percent plunge in the first quarter of 1991 when the economy was on the brink of recession.


The drop in business investment should raise a lot of concerns. Corporations have a ton of cash on their balance sheets -- according to the Fed's Flow of Funds report they're the only economic sector that is saving right now. It's not as though they don't have enough money.

And it's not as though business couldn't use some more capacity. According to the Federal Reserve:

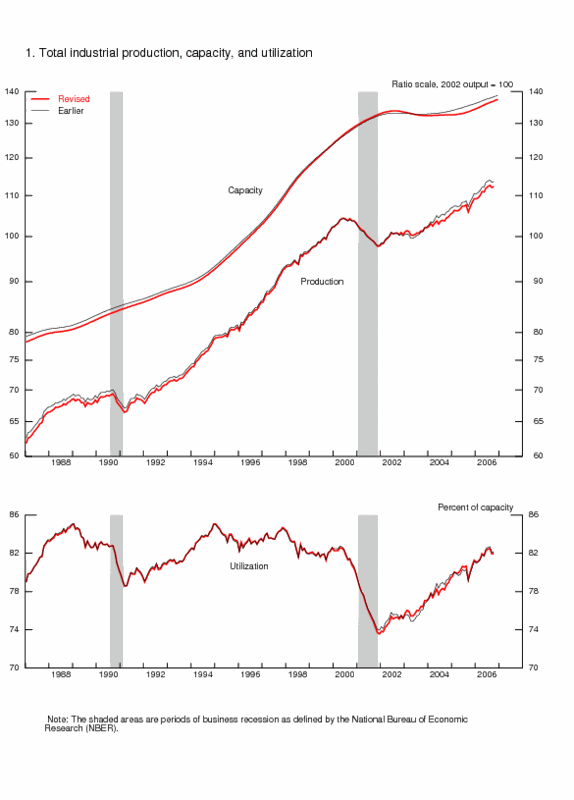
The capacity utilization rate for total industry was 82.3 percent in the third quarter of 2006, 1.3 percentage points above its 1972-2005 average and 0.2 percentage point lower than reported earlier. The utilization rate for total industry was revised up 1/4 percentage point in the fourth quarters of 2003 and 2005 and revised down 0.4 percentage point in the fourth quarter of 2004.


Here's a chart from the same Fed report. While capacity utilization isn't as high as it was in the 1990s, it's still over 80%.

Photo Sharing and Video Hosting at Photobucket

So - business has the money to invest and could probably use a bit more capacity. Yet they're not increasing the rate of their investment.

That's not a good sign.

Markets Turnaround

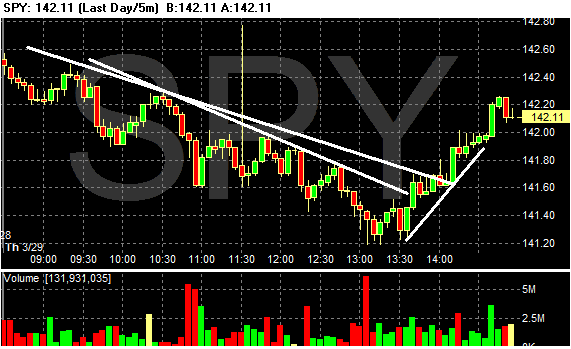
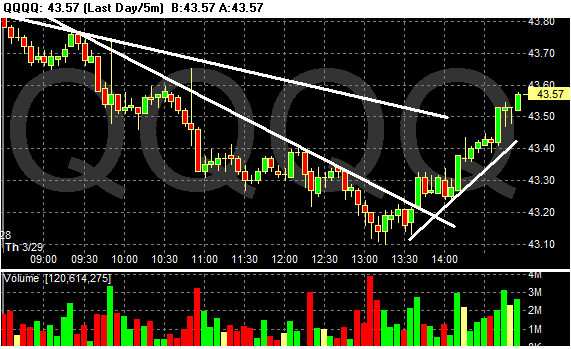
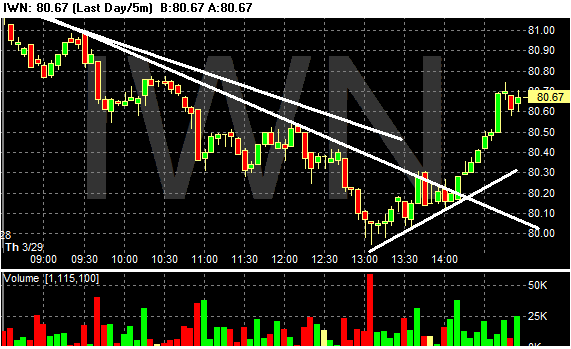
The market had a nice reversal today. All the markets moved in tandem and in two directions. They all sold off until about 1 PM and then rallied to close near even.


Photo Sharing and Video Hosting at Photobucket

Photo Sharing and Video Hosting at Photobucket

Photo Sharing and Video Hosting at Photobucket

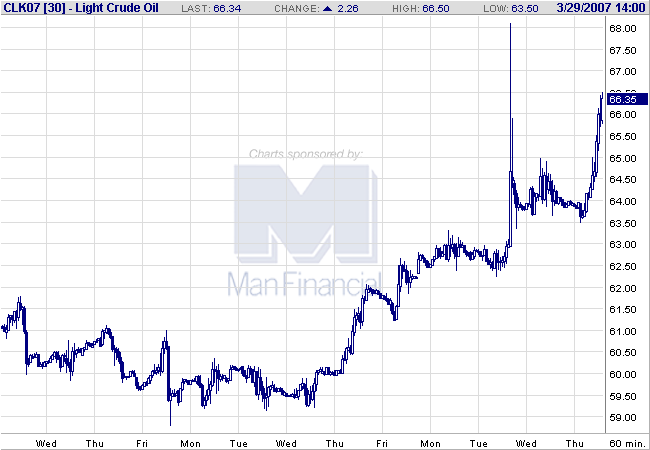
Oil Prices Jump

Here's a 2-week chart as of 2 PM EST.

Photo Sharing and Video Hosting at Photobucket

From Bloomberg

Crude oil rose above $66 a barrel in New York, approaching a six-month high, on concern that Iran's capture of 15 British sailors and marines increases the likelihood of a disruption of shipments from the Persian Gulf.

Iran, the world's fourth-biggest oil producer, won't release the only woman being held, a government official indicated today. Iran's foreign minister had said earlier she might be freed. Prearranged orders to buy futures at specific prices, known as stop orders, were triggered as prices rose.

``The Iranian tensions remain the main driver of this market,'' said Tom Bentz, an oil broker with BNP Paribas Inc. in New York. ``I wish there was something new to point to but there isn't. Once we got above $65 stops were triggered and the market went crazy.''


While the increase of tensions in the Middle East may be a reason for the increase, Boone Pickens argued fundamentals were driving oil prices:

The billionaire CEO of BP Capital said in an interview on "Squawk Box" that the current market is "very tight" because inventories have declined for seven straight weeks. He expects that will continue.

Thus, he rates the current market as being influenced by "90% fundamentals, but only 10% geopolitical." That could change, however, if the situation with Iran's seizure of 15 British sailors worsens and causes a blockage of the Straits of Hormuz, the waterway linking the Persian Gulf with the Indian Ocean.


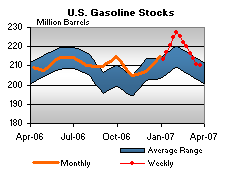
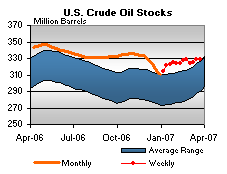
Pickens does have a point. Here are the charts of gasoline and oil inventories, respectively. Gas inventories have dropped sharply for the last few weeks and oil inventories are lower now than at the same time last year.

Photo Sharing and Video Hosting at Photobucket

Photo Sharing and Video Hosting at Photobucket

While I think the tensions with Iran are more important than Pickens gives them credit for, the dwindling supplies are a classic reason for price increases as well. In short -- we need an increase in stockpiles to alleviate this situation somewhat.

However, with the summer driving season coming on, it may be too late.

SubPrime Shakeout Hitting Retail Sales

From Bloomberg:

Atlanta-based Home Depot, the world's largest home- improvement retailer, said last month it expects its first annual profit drop since at least 1990 this year, citing the housing market. The company said profit will decrease this year to as little as $2.55 a share from $2.79, or $5.76 billion, last year.

....

Wal-Mart spokesman John Simley declined to comment. The Bentonville, Arkansas-based company will report March sales on April 12. Wal-Mart in 2006 had the smallest same-store sales gain in at least 27 years. Its shares have increased 1 percent this year.

....

Subprime borrowers' woes also may curb business at casual- dining restaurants targeting low-income consumers, according to a March 19 report by JPMorgan Chase & Co. Applebee's International Inc. has more low-income consumers than its competitors, JPMorgan said.

Same-store sales at Applebee's, a chain with more than 1,940 restaurants, declined in 10 of 12 months through February. Applebee's spokeswomen Carol DiRaimo and Laurie Ellison didn't return messages seeking comment.


Home Depot is a bell weather company for home improvement.

Wal-Mart is a bell weather company for retail.

Wednesday, March 28, 2007

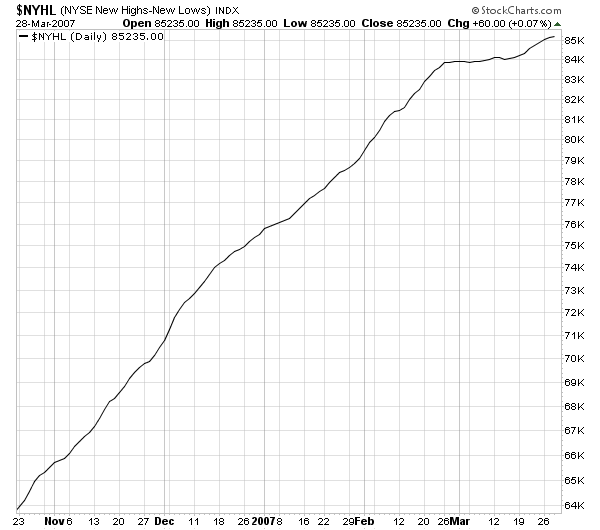
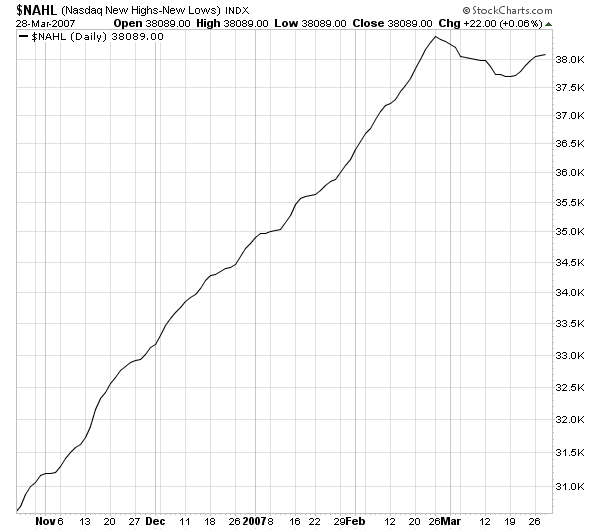
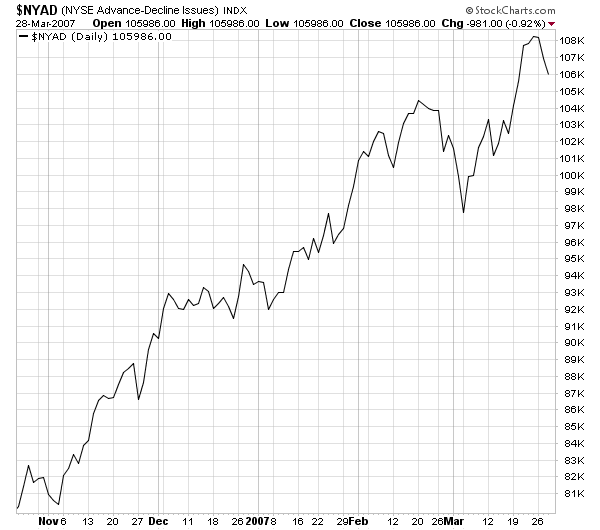
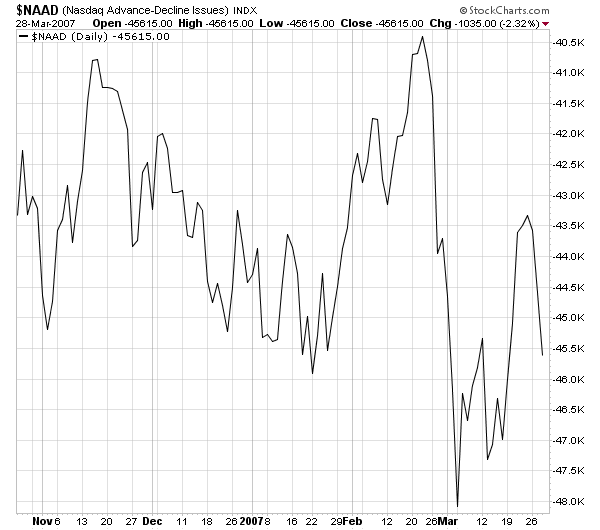
Market Breadth Turning Neutral

These charts are from Stockcharts. They show a market that is moving away from a bullish sentiment.

Fewer new highs means there is less of an upward pull in trading.

Photo Sharing and Video Hosting at Photobucket

Photo Sharing and Video Hosting at Photobucket

A moderating advance/decline line also means a moving away from bullish sentiment.

Photo Sharing and Video Hosting at Photobucket

Photo Sharing and Video Hosting at Photobucket

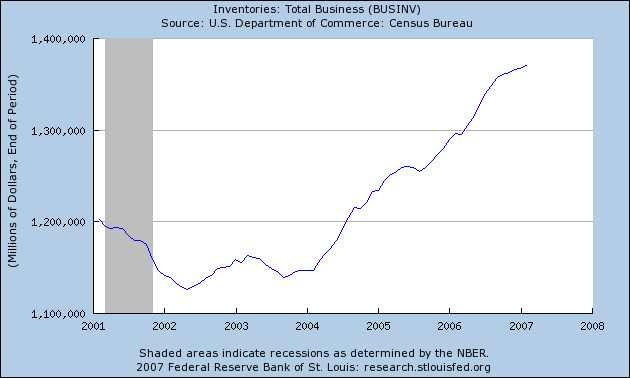
Big Inventory Build Out There ....

After yesterday's durable goods report, I looked at overall business inventories from the St. Louis Fed. There's a lot of stuff in the system.

Photo Sharing and Video Hosting at Photobucket

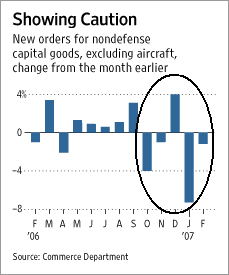
This inventory build may be one reason durable goods orders have dropped 4 of the last 5 months (from the WSJ)

Photo Sharing and Video Hosting at Photobucket

"It's looking like capital expenditures aren't going to be able to offset housing and autos with respect to investment," says Joseph Brusuelas, chief U.S. economist for IDEAglobal, an economic-consulting firm in New York.

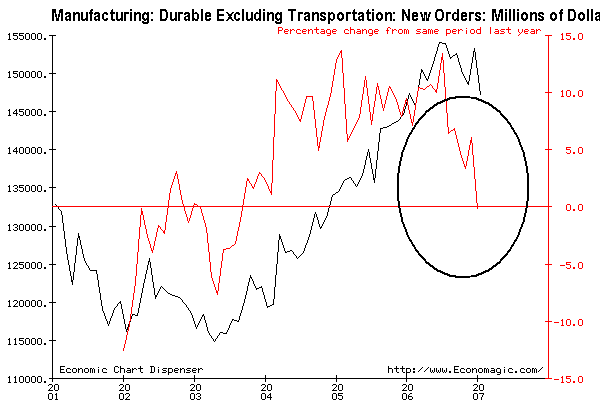
Economists monitor new orders for nondefense capital goods excluding aircraft because it gives a clearer picture of how businesses view future economic conditions. In addition to reporting a decline for February, the government also revised January's number to a decline of 7.4% from last month's estimate of a 6.0% decline.


Food for thought...

Markets Looking A Bit Weaker

At the end of last week there was a lot of bullishness to the hourly and daily charts. The market trended up until mid-Wednesday, popped big-time after the FOMC announcement and followed with two days of consolidation.

That trend is reversing itself this week. I added the Fiboinacci fans to get an idea of where the pullbacks stood in relation to Fib analysis. We're at or near the 50% retracement level for all three averages. We're also approaching moving averages. A cross below would add another point to the bearish argument.

Notice a few points about these charts.

1.) The markets have not rallied above resistance.

2.) The SPYs and QQQQs have an increase in volume as prices decline.

3.) A fairly standard bear market pattern has the market making lower lows and lower highs.

Photo Sharing and Video Hosting at Photobucket

Photo Sharing and Video Hosting at Photobucket

Photo Sharing and Video Hosting at Photobucket

Bernanke on Housing

From his Congressional Statement:

The principal source of the slowdown in economic growth that began last spring has been the substantial correction in the housing market. Following an extended boom in housing, the demand for homes began to weaken in mid-2005. By the middle of 2006, sales of both new and existing homes had fallen about 15 percent below their peak levels. Homebuilders responded to the fall in demand by sharply curtailing construction. Even so, the inventory of unsold homes has risen to levels well above recent historical norms. Because of the decline in housing demand, the pace of house-price appreciation has slowed markedly, with some markets experiencing outright price declines.

The near-term prospects for the housing market remain uncertain. Sales of new and existing homes were about flat, on balance, during the second half of last year. So far this year, sales of existing homes have held up, as have other indicators of demand such as mortgage applications for home purchase, and mortgage rates remain relatively low. However, sales of new homes have fallen, and continuing declines in starts have not yet led to meaningful reductions in the inventory of homes for sale. Even if the demand for housing falls no further, weakness in residential construction is likely to remain a drag on economic growth for a time as homebuilders try to reduce their inventories of unsold homes to more normal levels.


Translation:

1.) Housing is the main reason why US GDP growth dropped about 2% points over the last three quarters.

2.) There are a ton of homes on the market.

3.) If demand levels remain at these levels and don't fall any further, it's going to take a long time to clear available inventory.

Therefore:

4.) Housing will remain a drag on the economy for longer than we would like.

And on top of that, inflation isn't behaving. Right now it really sucks being head of the Federal Reserve.

The Markets Today

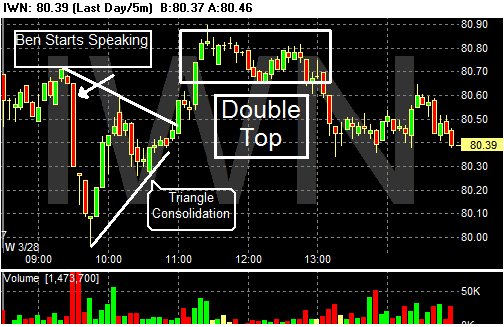
Here are today's daily charts of the SPY, QQQQ and IWN. These charts have a bearish bias for the following reasons:

1.) The SPY and the QQQQ all sold-off at the end. The SPY's selling volume was higher than previous bars and the QQQQs had a volume spike at the end.

2.) The indexes tried to rally from the post-Ben sell-off, but couldn't keep the momentum going.

Photo Sharing and Video Hosting at Photobucket

Photo Sharing and Video Hosting at PhotobucketPhoto Sharing and Video Hosting at Photobucket

Gas Prices Are Still Rising

From This Week in Petroleum:

Retail Gasoline Prices Up, Diesel Falls Slightly
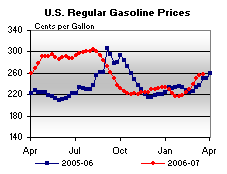
Gasoline prices were up for the seventh consecutive week, increasing 1.8 cents to 257.7 cents per gallon as of March 19, 2007. Prices are now 7.3 cents per gallon higher than at this time last year.
All regions reported price increases. East Coast prices were up 2.0 cents to 255.3 cents per gallon, while Midwest prices rose 0.3 cent to 249.0 cents per gallon. Prices for the Gulf Coast were up 1.6 cents to 241.8 cents per gallon. The largest regional increase was in the Rocky Mountains, where prices increased 9.0 cents to 250.2 cents per gallon. West Coast prices were up 2.6 cents to 294.6 cents per gallon, with the average price for regular grade in California up 1.0 cent to 307.8 cents per gallon, 44.3 cents per gallon above last year’s price.


The rate of increase has slowed. But, prices are still increasing and they are still higher than this time last year. In addition, the price increases are across the nation, indicating a local situation isn't skewing the numbers.

Bernanke's Opening Statement, pt. I Inflation

Here is the link to his complete testimony

Let me now turn to the inflation situation. Overall consumer price inflation has come down since last year, primarily as a result of the deceleration of consumers� energy costs. The consumer price index (CPI) increased 2.4 percent over the twelve months ending in February, down from 3.6 percent a year earlier. Core inflation slowed modestly in the second half of last year, but recent readings have been somewhat elevated and the level of core inflation remains uncomfortably high. For example, core CPI inflation over the twelve months ending in February was 2.7 percent, up from 2.1 percent a year earlier. Another measure of core inflation that we monitor closely, based on the price index for personal consumption expenditures excluding food and energy, shows a similar pattern.


Translation: Inflation came down for awhile. But it's increased over the last few months, and we don't like that too much. It makes our job a whole lot harder.

Core inflation, which is a better measure of the underlying inflation trend than overall inflation, seems likely to moderate gradually over time. Despite recent increases in the price of crude oil, energy prices are below last year�s peak. If energy prices remain near current levels, greater stability in the costs of producing non-energy goods and services will reduce pressure on core inflation over time. Of course, the prices of oil and other commodities are very difficult to predict, and they remain a source of considerable uncertainty in the inflation outlook.


Translation: We've been saying inflation would moderate for awhile and it hasn't.

Also -- Ben might want to take a look at this chart of gas prices, which indicates they're higher now than this time last year.

Photo Sharing and Video Hosting at Photobucket

I also think it's interesting he did not mention anything about agricultural prices, which have been increasing for the last few years and have started to increase over the last 3 months in the PPI and CPI report.

Although core inflation seems likely to moderate gradually over time, the risks to this forecast are to the upside. In particular, upward pressure on inflation could materialize if final demand were to exceed the underlying productive capacity of the economy for a sustained period. The rate of resource utilization is high, as can be seen most clearly in the tightness of the labor market. Indeed, anecdotal reports suggest that businesses are having difficulty recruiting well-qualified workers in a range of occupations. Measures of labor compensation, though still growing at a moderate pace, have shown some signs of acceleration over the past year, likely in part the result of tight labor market conditions.


Translation: We still think inflation is more likely to increase than decrease. So much for my statement at the beginning that "we expect inflation pressures to moderate".

Short version: The Fed is still focused on raising rates if inflation increases.

Durable Goods Orders Disapppoint

From Bloomberg:

U.S. durable-goods orders excluding transportation unexpectedly fell for a second month in February, jeopardizing the Federal Reserve's forecast for a recovery in investment.

The 0.1 percent drop followed a 4.0 percent slide a month earlier, the Commerce Department said in Washington today. None of the 35 economists surveyed by Bloomberg News predicted the decline. Orders for all durable goods -- those made to last several years -- rose 2.5 percent, less than analysts anticipated.

Companies are reluctant to buy new machinery and equipment until inventories are reduced, suggesting the economy may slow further, economists said.

``This raises a major warning flag for the economy,'' said Douglas Porter, deputy chief economist at BMO Capital Markets in Toronto. ``It casts some serious doubt on what had been a leader for the economy in the last year or two.''


First, the Year-over-year percent change in new orders was -.27%. Ex-transportation, the YOY change was +.68%. These numbers are not seasonally adjusted. Here's where the problem lies (also a link to the Census report):

Inventories of manufactured durable goods in February, up twelve consecutive months, increased $0.5 billion or 0.2 percent to $298.0 billion. This followed a 0.4 percent January increase.


12 straight months of inventory builds indicates 1.) there isn't a need for new orders -- and may not be for awhile, and 2.) the sell side of inventories is slowing.

A Look At Homebuilders

After yesterday's announcement of a Federal investigation into Beazer Homes, a look at the homebuilders stocks seems like a good idea.

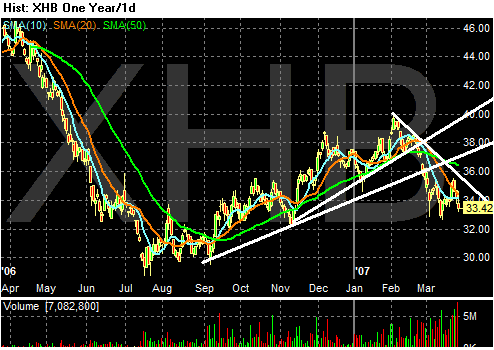
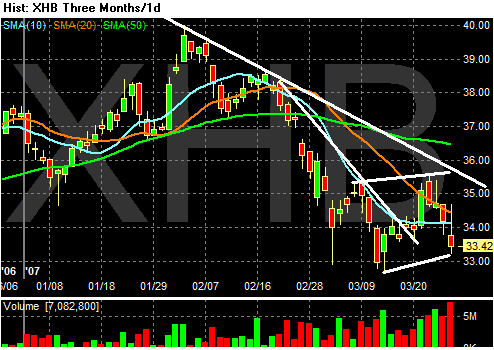
Here's the yearly chart. Like the rest of the market, this sector rallied starting in September of last year. However, in late February the sector broke the upward trend line and fell below the 10, 20 and 50 day SMA. The index lost about 10%. It is currently consolidating its losses in a bear market wedge pattern.

Photo Sharing and Video Hosting at Photobucket

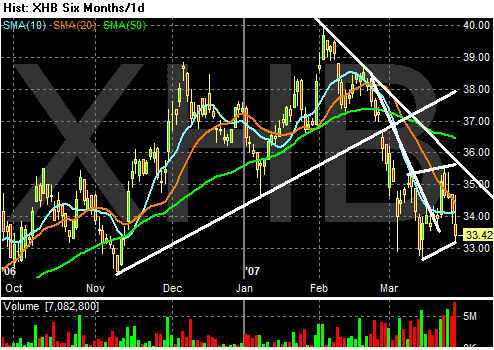
Here's a look at the 6 month chart, which betters shows the clear upward trend break.

Photo Sharing and Video Hosting at Photobucket

On the three month chart notice a few things.

1.) There are actually two downtrends in place. While recent action has broken the latest, steeper trend, the secondary trend is still firmly in place.

2.) The last 4 bars of downward price action have been on increasing volume. This may indicate selling pressure is increasing.

3.) We're near a low price, meaning a move and close below say $32.75 would be a bearish signal.

Photo Sharing and Video Hosting at Photobucket

Could Be an Interesting Day

1.) We have ongoing tensions between Iran and Britain, which are driving up oil prices.

2.) Bernanke testifies on Capital Hill. To get a better idea of what this testimony is really about Read this article from Barry Ritholtz at the Big Picture

3.) We have durable goods data coming out. Pay particular attention to the year-over-year number. Here are the charts for total orders YOY and total orders ex-transportation YOY.

Photo Sharing and Video Hosting at Photobucket

Photo Sharing and Video Hosting at Photobucket


4.) Federal Authorities announced a probe of Beazer Homes. Watch XHB -- the homebuilders ETF. I'll post a chart later.

2006 Subprime Bonds May be Worst Performing Ever

From Bloomberg:

Subprime mortgage-backed securities from 2006 may be the ``worst-performing in recent history,'' with delinquencies on the underlying debt ``consistently higher'' than in the prior five years, Standard & Poor's said,.

About 13 percent of mortgages made last year to people who have poor or bad credit are delinquent, S&P analysts Michael Stock and Scott Mason said in a report yesterday, with 6.65 percent of the total classified as ``seriously delinquent,'' or more than 90 days late. Losses on bonds backed by the loans will be between 5.25 percent and 7.75 percent, compared with 5.5 percent in 2000, S&P forecasted.

About $540 billion of bonds backed by subprime mortgages made in 2006 are outstanding, making up more than a third of all securities derived from such home loans, according to New York- based Bear Stearns Cos.


This article makes it appear there is a big divergence in performance between 2006 bonds and all other subprime bonds. If that is the case, than we have an isolated year where we have large problems. That doesn't make it any easier to deal with, but it does at lease limit the damage.

Money Managers Say Housing Biggest Risk to Markets This Year

From the WSJ:

Many managers fear that a housing slowdown could crimp consumer spending, a major driver of economic growth, according to Russell Investment Group's quarterly Investment Manager Outlook survey set to be released today. As stocks moved sharply lower in late February and early March, managers became increasingly bearish on market sectors sensitive to an economic downturn, such as basic materials and financial services.

The survey, conducted from Feb. 26 to March 5, overlapped with a stock-market slide. The Standard & Poor's 500-stock index fell 3.5% on Feb. 27 and dropped nearly 6% from Feb. 21 through March 5.

Of those managers responding after the downturn, 20% said a softening real-estate market is the biggest risk to U.S. stocks' performance over the next year, compared with 8% before the selloff. And as stocks dropped, managers became substantially more bullish on U.S. Treasury bonds, a traditional haven in times of market volatility. Of the managers responding after the downturn, 30% were bullish on Treasurys, compared with 10% of those before the downturn.

Managers cited increasing inflation as the greatest risk to U.S. stocks' performance, with many managers concerned that the economy's growth may be too strong.


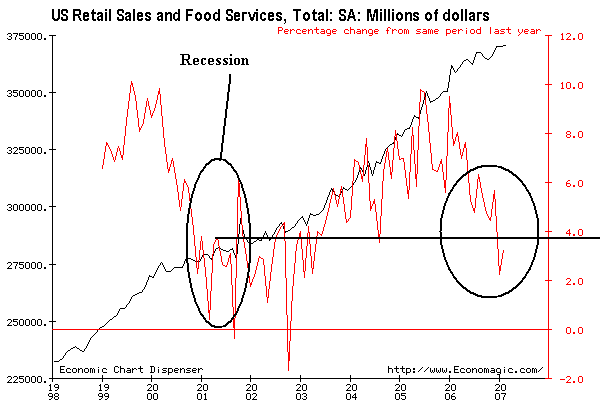
Consumer spending is responsible for about 70% of US growth. Therefore, anything that effects it is important. This is a graph I put up yesterday, but it seems very pertinent to this story. It shows the year-over-year change in retail sales in red with the scale on the right and the actual sales numbers in black with the scale on the left.
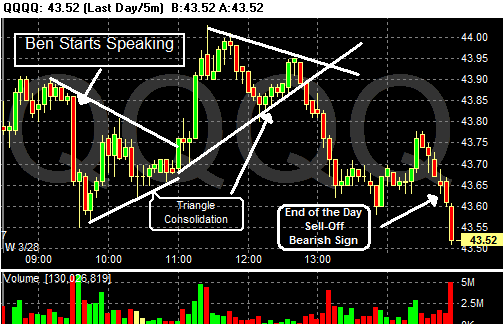
Photo Sharing and Video Hosting at Photobucket

Tuesday, March 27, 2007

Fed's Investigating Beazer Home on Fraud

From Business Week:

Atlanta-based Beazer, the nation's sixth-largest residential homebuilder, rode high during the heyday of the housing boom—profiting from both selling the homes it constructed and often financing the buyers as well through a wholly owned mortgage arm. It's common in the industry, but Beazer may have pushed the bounds: The North Carolina field offices of the Federal Bureau of Investigation, the Internal Revenue Service, and the Justice Dept. have recently opened a joint investigation into the company over such matters.

The Inspector General of Housing and Urban Development is also part of the group since a large percentage of Beazer's loans were made to low-income borrowers and insured by the federal government through the Government National Mortgage Assn., according to people familiar with the investigation.

Investigators, however, are not limiting their probe to possible mortgage fraud. "There's all sorts of potential fraud issues here," FBI spokesman Ken Lucas told BusinessWeek. "We're looking at all types of [potential] fraud associated with Beazer—corporate, mortgage, investments." Beazer did not comment by press time.


This is the worst possible news for the new home industry at this time. Yesterday, the Census Bureau reported a 3.9% drop in new home sales. Subprime mortgage lenders are already tightening their credit standards, and over 40 have with gone out of business, declared bankruptcy or sold their assets.

Now we learn the FBI, Justice Department and the IRS are investigating the 6th largest homebuilder in the country for "all types of potential fraud." This has the potential to cast a shadow over all homebuilders and mortgage lenders at a time when they least need negative publicity.

The Markets Today

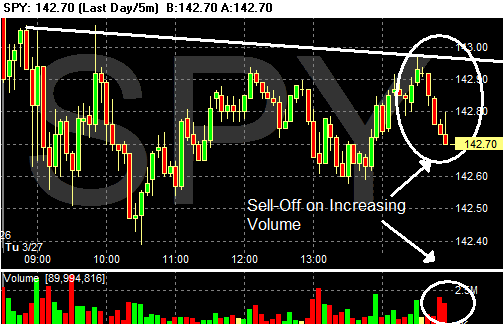
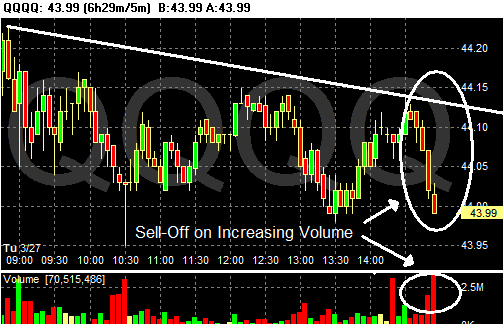
All of the markets have a downward bias today. They all opened lower and zig-zagged a bit. However, pay particular attention to the SPYs and QQQQs end of the day action. They both sold-off on heavy volume. This is never a good sign because it indicates traders saw something that led them to want to get out of the market. The QQQQs ended the day at their low point.

Photo Sharing and Video Hosting at Photobucket

Photo Sharing and Video Hosting at Photobucket

Looking at the daily chart, notice none of the averages has closed above the drawn resistance lines from the sell-off a few weeks ago. Something is keeping the markets from advancing above these points. However, the price action for the last few days could be considered a standard pull-back during a rally. In other words, the fact the markets haven't sold-off is also important. This qualifies as a "we'll have to wait and see" how it all shakes out.

Photo Sharing and Video Hosting at Photobucket

Photo Sharing and Video Hosting at Photobucket

Photo Sharing and Video Hosting at Photobucket

How Confident Are Consumers?

Here is a chart of the Year-over-year change in retail sales. The figures aren't adjusted for inflation, but are adjusted for seasonal factors.

Photo Sharing and Video Hosting at Photobucket

How Confident is Business?

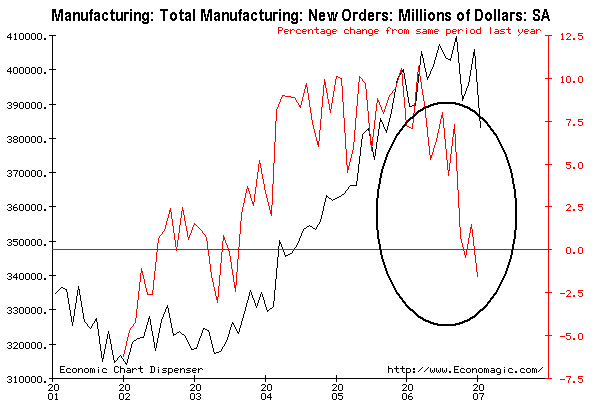
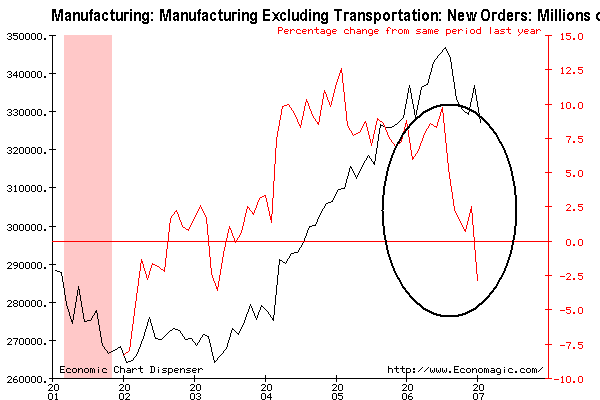
Business is ordering less and less new "stuff". Here is a chart of new orders, seasonally adjusted. The black line is total orders. The red line is the percentage change from year ago levels.

Photo Sharing and Video Hosting at Photobucket

Transportation orders can really skew these numbers, so let's take them out of the graph. The same color scheme applies:
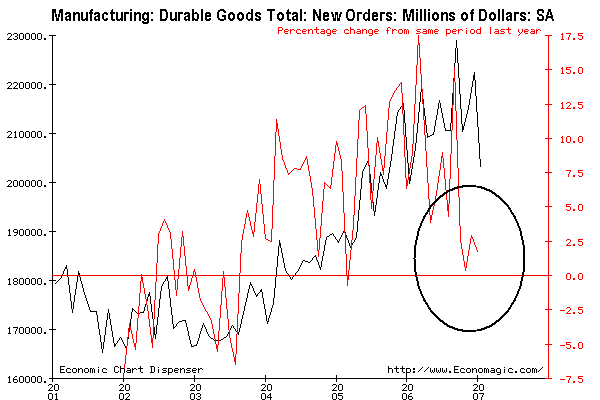
Photo Sharing and Video Hosting at Photobucket

Oil Refineries Are Breaking Down With More Frequency

From the LA Times:

Refineries across the country are breaking down with unusual frequency this year, boosting prices at the pump and endangering workers and communities.
The rash of oil plant problems may not be a coincidence. The breakdowns stem from the hard use of aging equipment, a shortage of trained workers, corporate cost-cutting and ownership changes, refinery experts say.

In the first six weeks of 2007, there were 43 incidents involving pipeline leaks, chemical releases, plant breakdowns and fires, more than has been typical, Kim Nibarger, a safety expert for the United Steelworkers Union, told Congress during a hearing last week on refinery safety.


If it continues, this will only add upward pressures on gas prices.

Lennar Earnings Drop

From Bloomberg:

Lennar Corp., the largest U.S. homebuilder by revenue, said earnings plummeted 73 percent in the fiscal first-quarter as demand waned in the worst housing slump in more than a decade.

Net income for the three months ended Feb. 28 declined to $68.6 million, or 43 cents a share, from $258.1 million, or $1.58, a year earlier, the Miami-based company said today in a statement. Lennar said it will likely miss its 2007 profit forecast as the normally stronger spring selling season had not materialized.

``Given the state of the market, we do not expect to achieve our previously stated 2007 profit goal,'' Chief Executive Officer Stuart Miller said in the statement. ``We are not comfortable providing a new earnings goal at this time.''


Pay particular attention to what the CEO said:

``The housing market continues to demonstrate overall weakness,'' Miller said in today's statement. ``While some markets are performing better than others, the typically stronger spring selling season has not yet materialized. These soft market conditions have been exacerbated by the well-publicized problems in the subprime lending market.''


When industry insiders stop spinning and start using words like "weakness" and "the typical stronger spring selling season has not materialized", you know two things.

1.) It's an accurate statement. CEOs as paid to make positive public statements to support the company and the industry.

2.) Things are pretty damn bad to force that level of straight talk.

Gasoline Futures Hit 7-Month High

From IBD:

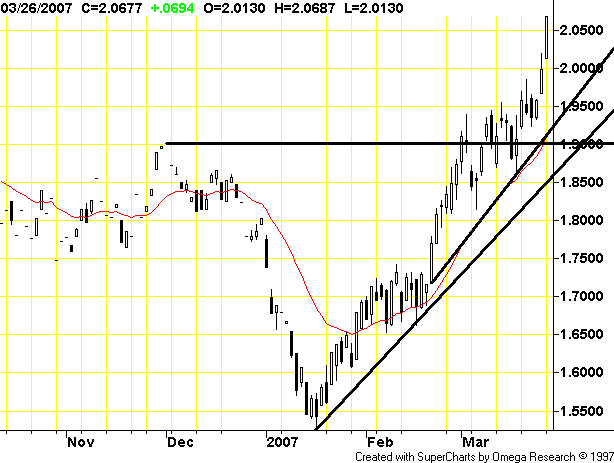
April gasoline rose 6.94 cents to $2.0677 a gallon, its highest since Aug. A BP refinery in Indiana is running below pace after a small fire there, reports say. That's the latest in a slew of refinery woes. Crude rose 63 cents to $62.91, a 3-month high amid rising tensions with Iran, OPEC's No. 2 producer. Retail gas prices are up 42 cents in the last 7 weeks to $2.655 a gallon.


Here's a daily chart of gasoline prices.

Photo Sharing and Video Hosting at Photobucket

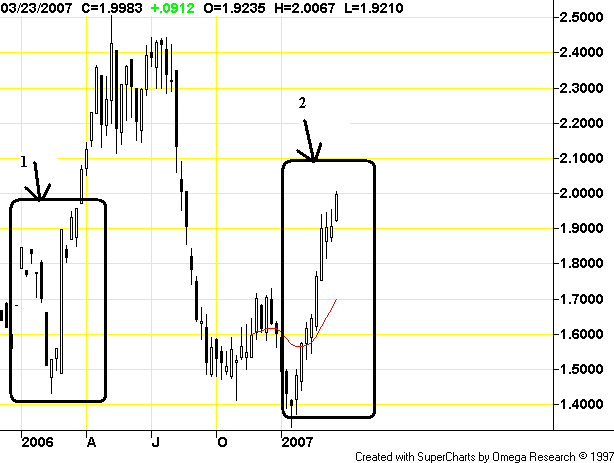
While that chart looks like prices are out of control, notice in the chart below the seasonality of gas prices. Gas prices this year (denoted as #2) are more or less following the same pattern as last year (denoted as #1). Gas prices typically spike in the summer.

Photo Sharing and Video Hosting at Photobucket