Showing posts with label industrial production. Show all posts

Wednesday, June 19, 2013

US Industrial Production Slowdown

The latest contraction in the ISM manufacturing report indicates the US manufacturing sector is slowing.  There have been signs this was happening for the last few months.  First, we've seen weak readings from some of the regional manufacturing reports.  For example, here is the latest Empire State report:

The May 2013 Empire State Manufacturing Survey indicates that conditions for New York manufacturers declined marginally. The general business conditions index fell four points to -1.4, its first negative reading since January. The new orders index also edged into negative territory, and the shipments index fell to zero. The prices paid index declined eight points to 20.5, indicating a slowdown in selling price increases, while the prices received index was little changed at 4.6. Employment indexes were mixed, showing both a modest increase in the number of employees and a slight decline in the length of the average workweek. Indexes for the six-month outlook were generally lower, suggesting that optimism about future conditions had weakened.    

And  the latest Philadelphia Fed Report:

The survey’s broadest measure of manufacturing conditions, the diffusion index of current activity, decreased from 1.3 in April to -5.2 this month. The current activity index has shown no pattern of sustained growth over the past seven months, generally alternating between positive and negative readings (see Chart). The number of firms reporting decreased activity this month (29 percent) edged out those reporting increased activity (24 percent).

Richmond also shows a slowdown:

In May, the seasonally adjusted composite index of manufacturing activity — our broadest measure of manufacturing — gained four points settling at −2 from April's reading of −6. Among the index's components, shipments recouped seventeen points to 8, the gauge for new orders slipped two points to finish at −10, and the jobs index subtracted six points to end at −3.

 We also see this slowdown in the overall industrial production numbers coming from the Federal Reserve.


The above chart breaks the US down into market groups.  In 4 of the last 7 months we've seen weak readings from the final products and non-industrial supplies sector.    Non-durable goods have printed weak readings in 3 of the last 7 months, and non-energy has printed weak readings in 2 of the last 3 prints.

Let's look at the anecdotal reports from the latest ISM report to get some more insight into this section of the economy:
  • "Customers are anticipating resin price decreases and holding back orders." (Plastics & Rubber Products)
  • "Slight uptick in overall business but not substantial." (Textile Mills)
  • "Government spending has tightened, which has moved out program awards and caused some reduction in force." (Computer & Electronic Products)
  • "Market outlook is relatively flat, with some promise of raw materials inflation relaxing." (Electrical Equipment, Appliances & Components)
  • "General economy seems sluggish and pensive. Buyers are not buying much beyond lead times." (Fabricated Metal Products)
  • "Downturn in European and Chinese markets is having a negative effect on our business." (Machinery)
  • "We are having a difficult time hiring skilled employees." (Transportation Equipment)
  • "Business continues to increase, but over the past 20 days we have seen the trend flatten." (Furniture & Related Products)
  • "Market was holding strong until mid-month — then softened." (Wood Products)
  • "Decline in sales for FYQ2 over same period a year ago due to softer demand [in] both domestic and exports." (Chemical Products)
Summing up the information we get the following points:
  • The overall domestic economy is "sluggish and pensive" with a "flat' outlook and some markets have recently "softened."  Cuts to government spending are having an impact.
  • The international slowdown is also hurting.  
In addition, consider the excess capacity in the system:

In another sign of recent weakness in the manufacturing sector, capacity utilization in the US has stalled, as demand remains soft. US industries are producing significantly below their capacity and "5.5 percentage points below long-run average" according to the Fed. We are certainly far under the 82-85% level at which economists believe that the traditional measures of inflation are expected to rise.
The sky is not falling.  But things are definitely grinding lower. 

Thursday, April 12, 2012

1955: Industrial Production

This post is part of the Bonddad  Economic History Project.  For more information, please see the right side of the blog

In 1955, the US was an island in the world.  Countries that would eventually become our international competitors were still rebuilding from WWII.  As such, the explosion in consumer demand was satiated by goods produced domestically.  Consider the following table of consumer goods:

US consumer demand was booming; US industry was the primary source of goods sold to US consumers.  As such, we see that overall industrial production rose for 1955:


The top chart shows that overall IP was at record levels in 1955.  The second chart shows that total mineral production was the first sector to hit multi-year highs.  But by the end of the year, durable, non-durable and total manufacturers production had reached multi-year levels.


The above table puts the charts into numerical perspective, as does the following excerpts from the Federal Reserves Annual Report and the Economic Report to the President, 1956.


Friday, March 23, 2012

1955: Industrial Production


The above FRED chart shows that industrial production grew throughout the year.  We see production increase in the first quarter, sow its rise in the second and third, and then continue to rise in the fourth.

The above chart from the ERP shows that both durable, minerals and non-durable manufacturing contributed to the rise.


Steel production rose for most of the year, while auto production saw a mid-year dip and a tailing off at year end.

The annual report of the Federal Reserve explains the industrial production situation like this:


Essentially, industrial production was the beneficiary of consumer demand.  As the US consumer wanted more and more "stuff" the industrial sector obliged with products.

Tuesday, March 6, 2012

1954: Industrial Production/Manufacturing


The above chart of industrial production from the FRED system shows that industrial production did not take off until the last quarter of the year.  There is a good reason for that.  Remember -- the reason for the slowdown was a systemic manufacturing situation.  Briefly, inventories built but demand did not.  As a result, there was a manufacturing recession where most of the lay-offs occurred in the manufacturing area.  The charts below help to fill in the gaps.


The above charts shows that the primary reason for the slowdown was the drop in durables goods manufacturing that started in 1953.


The above chart shows that inventories built at the end of 1953 and the inventory/sales ratio rose, peaking in early 1954.  As this ratio declined, industrial production came back on line, primarily starting in the fourth quarter of the year.


The lower chart shows shows that manufacturers placed more orders than there were sales for most of 1953 and 1954.  This is what caused the slowdown.  Remember that in 1954, there was no "just in time" inventory system; instead, businesses had to anticipate demand and place orders accordingly.  As such, inventory build-ups were far more common.

Thursday, December 22, 2011

1950: Industrial Production

Below are excerpts from the 1951 Economic Report to the President on 1950's production.


In addition, here is the accompanying chart:


Thursday, July 16, 2009

Industrial Production Drops .4%

From the Federal Reserve:

Industrial production decreased 0.4 percent in June after having fallen 1.2 percent in May. For the second quarter as a whole, output fell at an annual rate of 11.6 percent, a more moderate contraction than in the first quarter, when output fell 19.1 percent. Manufacturing output moved down 0.6 percent in June, with declines at both durable and nondurable goods producers. Outside of manufacturing, the output of mines fell 0.5 percent in June, and the output of utilities increased 0.8 percent. The rate of capacity utilization for total industry declined in June to 68.0 percent, a level 12.9 percentage points below its average for 1972-2008. Prior to the current recession, the low over the history of this series, which begins in 1967, was 70.9 percent in December 1982.


This is one set of statistics that still gives me the willies. Or -- to put it another way -- if there is anything that could screw up the bottoming process it's this series of numbers. Thankfully there are finally in a "less worse" situation.

Click for a larger image


Notice the following on the above chart:

1.) The monthly decline series has been improving in fits and starts for the last six months. However, it is still negative.

2.) The first quartet numbers were worse than the second quarter numbers (although both are still negative).

In addition, the charts are downright ugly still (click on all for a larger image):


The capacity utilization number indicates we're going to have a low investment total at the beginning of the next expansion as manufacturers ramp up existing production at the expense of new buildings/facilities etc...

Bottom line: if there is one series that really threatens a recovery this is it.

Wednesday, June 17, 2009

Industrial Production Blows

From the Fed:

Industrial production decreased 1.1 percent in May after having fallen a downward-revised 0.7 percent in April. The average decrease in industrial production during the first three months of the year was 1.6 percent. Manufacturing output moved down 1.0 percent in May with broad-based declines across industries. Outside of manufacturing, the output of mines dropped 2.1 percent, and the output of utilities fell 1.4 percent. At 95.8 percent of its 2002 average, overall industrial output in May was 13.4 percent below its year-earlier level. The rate of capacity utilization for total industry declined further in May to 68.3 percent, a level 12.6 percentage points below its average for 1972-2008. Prior to the current recession, the low over the history of this series, which begins in 1967, was 70.9 percent in December 1982.


If there is one figure that can blow the "things are getting better" argument it's the latest industrial production figure. Now -- the overall month to month chart is still encouraging (click on all images for a larger image):


Notice the rate of decline has decreased over the last six months save the current month. That means the current month could be a "blip" on the way to things getting better. But it also means we have to keep a very strong eye on all the industrial figures for the next few months. In addition, there has already been a ton of damage done to overall industrial production. Consider the following charts:


Notice that we've lost all production gains of the previous expansion. In addition


Utilization is at multi-decade lows. That means when the economy starts back up there is little incentive for business to engage in any capital expansion as their first priority will be to use the big slack in their production systems.

Again -- if there is a set of statistics that could really screw us up, this is it.

Friday, May 1, 2009

ISM Increases Bit

From the Institute for Supply Management:

The report was issued today by Norbert J. Ore, CPSM, C.P.M., chair of the Institute for Supply Management™ Manufacturing Business Survey Committee. "The decline in the manufacturing sector continues to moderate. After six consecutive months below the 40-percent mark, the PMI, driven by the New Orders Index at 47.2 percent, shows a significant improvement. While this is a big step forward, there is still a large gap that must be closed before manufacturing begins to grow once again. The Customers' Inventories Index indicates that channels are paring inventories to acceptable levels after reporting inventories as 'too high' for eight consecutive months. The prices manufacturers pay for their goods and services continue to decline; however, copper prices have bottomed and are now starting to rise. This is definitely a good start for the second quarter."


The real news here is the new orders index:

ISM's New Orders Index registered 47.2 percent in April, 6 percentage points higher than the 41.2 percent registered in March. This is the 17th consecutive month of contraction in the New Orders Index. A New Orders Index above 48.8 percent, over time, is generally consistent with an increase in the Census Bureau's series on manufacturing orders (in constant 2000 dollars).


This is consistent with the GDP/inventory situation -- the contraction in inventories will lead to an increase in orders which will lead to an uptick in manufacturing. However -- before we get too excited, let's take note of a few things:


Industrial production has dropped pretty hard and


Is currently dropping at a rate not seen since the early 1970s. In addition


Capacity Utilization is at the lowest level in almost 40 years.

In other words, once we are back in positive territory on the ISM we have a lot of capacity to use up before we are back on a solid path.

Thursday, April 16, 2009

Inside the Latest Industrial Production Numbers

From the Federal Reserve:

Industrial production fell 1.5 percent in March after a similar decrease in February. For the first quarter as a whole, output dropped at an annual rate of 20.0 percent, the largest quarterly decrease of the current contraction. At 97.4 percent of its 2002 average, output in March fell to its lowest level since December 1998 and was nearly 13 percent below its year-earlier level. Production in manufacturing moved down 1.7 percent in March and has registered five consecutive quarterly decreases. Broad-based declines in production continued; one exception was the output of motor vehicles and parts, which advanced slightly in March but remained well below its year-earlier level. Outside of manufacturing, the output of mines fell 3.2 percent in March, as oil and gas well drilling continued to drop. After a relatively mild February, a return to more seasonal temperatures pushed up the output of utilities. The capacity utilization rate for total industry fell further to 69.3 percent, a historical low for this series, which begins in 1967.


First quarter production dropped at a 20% annual rate. There is no way to spin that as good news. That is terrible news. In addition, production has dropped 13% below the same level as last year -- another terrible statistic. Finally, there have been 5 monthly drops in production. That -- again -- is terrible.

Now -- consider this chart of overall industrial production. Click on a larger image:


Above is a long-term chart of overall industrial production with a logarithmic scale. Notice the latest contraction that started in December 2007 has wiped out any production gain made during the latest expansion. That has not happened since the great depression. Here's a closer look at the last 40 years or so:


In addition:


Capacity utilization is at its lowest level in over 40 years. Let's assume we get of this recession by the end of the year. Do you think companies that are at 40+ year lows in capacity utilization are going to be purchasing new equipment? Neither do I. This does not bode well for equipment and software investment, which is about 8.4% of US chained GDP. This means we can't count on that to pull us out of the recession in any meaningful way.

Consider these charts from the report. Notice that construction and durable goods are dropping like stones.


And all of this is having a negative impact on manufacturing stocks:

Tuesday, March 17, 2009

Industrial Production Drops -- Again

From the Federal Reserve:

Industrial production fell 1.4 percent in February; the overall index has now declined for 4 consecutive months and for 10 of the past 12 months. At 99.7 percent of its 2002 average, output in February was 11.2 percent below its year-earlier level and was the lowest level since April 2002. Production in the manufacturing sector moved down 0.7 percent, with broad-based declines among its components. An increase in the production of motor vehicles and parts after the extended plant shutdowns in January, however, added nearly 1/2 percentage point to the change in manufacturing production. Outside of manufacturing, the output of mines moved down 0.4 percent, while a swing to above-average temperatures contributed to a 7.7 percent drop in the output of utilities. The capacity utilization rate for total industry fell to 70.9 percent, a rate 10 percentage points below its average from 1972 to 2008. This rate matches the historical low for this series, which was recorded in December 1982; the data for total industrial utilization begin in 1967.


Let's take this apart, piece by piece.

-- IP has declined 4 consecutive months. That's called a trend. And this trend is not very good.

-- IP has declined 10 of the past 12 months. That's also called a trend. And this trend is not very good.

-- Industrial production is now below the 2002 level. Here's a relevant graph from the St. Louis Federal Reserve:


Here's a chart of utilization from the report:


We're now at the lowest level of utilization in over 40 years.

There are two areas that stand out as the main culprits of the drop: construction and autos (consumer durable goods):


However, that does not mean everything is hunky-dory in other areas. It simply means those two areas are especially bad.

Friday, February 20, 2009

Industrial Production Drops

From the Federal Reserve:

Industrial production fell 1.8 percent in January. At 101.3 percent of its 2002 average, output in January was 10.0 percent below its year-earlier level. Production in the manufacturing sector dropped 2.5 percent with broad-based declines among its components. A plunge in motor vehicle and parts production that resulted from extended plant shutdowns subtracted more than 1.0 percentage point from the change in manufacturing production. The output of mines moved down 1.3 percent. A swing to below-average temperatures contributed to an increase of 2.7 percent in the output of utilities. The capacity utilization rate for total industry fell to 72.0 percent, a rate 8.9 percentage points below its average from 1972 to 2008.

.....

In January, manufacturing output fell 2.5 percent and was 12.9 percent below its year-earlier level. The factory operating rate moved down 1.7 percentage points, to 68.0 percent, the lowest rate of utilization since this series began in 1948. The index for durable goods dropped 4.8 percent. The output of motor vehicles and parts decreased at a monthly rate of 23.4 percent in January, after having contracted at an annual rate of more than 37 percent in the fourth quarter. All of the remaining major indexes fell sharply in January with the exception of miscellaneous manufacturing, which moved up 0.3 percent. The production of nondurable goods decreased 0.5 percent. The output of food, beverage, and tobacco products rose 0.6 percent after having fallen more than 2 percent in December, but declines were recorded in all the other major nondurable goods industries.

The index for the other manufacturing category, which consists of publishing and logging, decreased 1.5 percent.


There is no good news in this report. Period.

Friday, January 16, 2009

Industrial Production Is Cratering

From the Fed:

Industrial production fell 2.0 percent in December, and declines were again widespread. Output was revised up in October, but it was revised down in November; for the fourth quarter as a whole, total industrial production decreased 11.5 percent at an annual rate. At 103.6 percent of its 2002 average, output in December was 7.8 percent below its year-earlier level. In December, manufacturing production dropped 2.3 percent. The output of mines moved down 1.6 percent, and the output of electric and gas utilities was little changed. Capacity utilization for total industry fell to 73.6 percent in December, a level 7.4 percentage points below its average level from 1972 to 2007.


Those are some huge losses in the year over year numbers. Let's see what the charts say:


That chart is what economists call cliff diving, meaning the number is just falling head over heels into lower territory.


This is also a very important number from a future GDP perspective. Remember that total private domestic investment is a component of GDP growth. This chart tells us that part of net private investment will not be moving higher anytime soon.

Thursday, December 18, 2008

Manufacturing Tanking Hard

We've had all the monthly manufacturing data released. The news is terrible.

Let's start with the ISM manufacturing survey. Here is the relevant graph:


Click for a larger image

Notice the index as dropped off a cliff over the last two months. Consider the following from the report:

PERFORMANCE BY INDUSTRY

The two industries reporting growth in November — listed in order — are: Apparel, Leather & Allied Products; and Paper Products. The industries reporting contraction in November are: Nonmetallic Mineral Products; Fabricated Metal Products; Textile Mills; Printing & Related Support Activities; Machinery; Electrical Equipment, Appliances & Components; Primary Metals; Transportation Equipment; Furniture & Related Products; Plastics & Rubber Products; Computer & Electronic Products; Chemical Products; Petroleum & Coal Products; Miscellaneous Manufacturing; Food, Beverage & Tobacco Products; and Wood Products.

WHAT RESPONDENTS ARE SAYING ...

* "The only positive thing of late is that the U.S. dollar has strengthened significantly against other currencies. We import the majority of our materials so this will have the effect of lowering our COGS." (Transportation Equipment)
* "Steel industry is our main customer, and they have had a real slowdown." (Computer & Electronic Products)
* "Criteria for projects is significantly higher with very short ROI periods." (Food, Beverage & Tobacco Products)
* "We have revised downward our top-line sales estimates for CY2009 by 8 percent due to the continued softness we see in the housing sector." (Machinery)
* "Suppliers are trying to hold onto pricing, but petrochemical and commodity prices are dropping like a rock." (Plastics & Rubber Products)


And consider the historic nature of the problem:

The contraction underway in the manufacturing sector is of historic proportions, the results of November's ISM manufacturing report that shows a headline index of 36.2, down nearly 3 points in the month. The reading is the lowest since 1980 recession. Key components in the survey show greater weakness than the headline index including a 31.5 level for the production index that matches the record low in May 1980. New orders at 27.9 is at its lowest since the early 80s while, in perhaps the most stunning reading of all, prices paid is at 25.5, down 11.5 points in the month for the lowest reading since early data in 1949 -- a critical indication that demand is falling and falling very sharply.


Notice that only two industries expanded whereas 16 contracted. Sales reports are being downgraded and the criteria for projects is increasing. Simply put -- things are bad. Also note we are at lows not seen since the 1980s. That is not a comparison anyone wants to make.

Overall industrial production is also down. From the Federal Reserve:

Industrial production decreased 0.6 percent in November with declines widespread across industries. The drop in output in September was revised down, and the rebound in October was revised up, in large part because both the decrease due to the September hurricanes and the subsequent partial recovery in October were larger than previously reported.

Manufacturing production dropped 1.4 percent in November despite the resumption of activity in the commercial aircraft industry after the resolution of a strike early in the month. The output of mines advanced 2.5 percent, primarily as a result of a further post-hurricane recovery in crude oil and natural gas operations in the Gulf of Mexico. Taken together, the rebounds after the strike and the hurricanes added almost 1 percentage point to the change in industrial production. The output of utilities rose 1.6 percent.

At 106.1 percent of its 2002 average, total industrial production in November was 5.5 percent below its level of a year earlier. The capacity utilization rate for total industry fell to 75.4 percent, a level 5.6 percentage points below its average level from 1972 to 2007.


Here are the relevant graphs:


Click for larger images

The year over year number is a big concern. Also note that capacity utilization is leveling at a lower level than the level we've had for the last few years. The bottom line is we're slowing down.

The New York area's manufacturing index is also in very bad shape:

The Empire State Manufacturing Survey indicates that conditions for New York manufacturers deteriorated significantly in December. The general business conditions index, at -25.8, held near the record low set in November. The new orders and shipments indexes also remained near their recent record lows, and the unfilled orders index dropped to a new low. The indexes for prices paid and prices received fell below zero, and employment indexes remained deep in negative territory. Future indexes remained subdued, with the capital spending and technology spending indexes remaining well below zero.


The graph shows the severity of the slowdown:


Click for a larger image

Again -- this is a significant decline which happened quickly. In indicates the slowdown is extreme, sharp and very sudden.

Finally there is the Philadelphia survey:

Conditions in the region's manufacturing sector continued to deteriorate this month, according to firms polled for the December Business Outlook Survey. All of the survey's broad indicators remained negative this month and at relatively low levels. Firms reported declines in input prices and the prices for their own manufactured goods this month. Consistent with the weakness in current activity, most of the survey's indicators of future activity slid further into negative territory, suggesting that the region's manufacturing executives expect continued declines over the next six months.


Here is the relevant graph:


There is no good news in any of these releases. Simply put, manufacturing is in terrible shape.

Tuesday, September 16, 2008

Manufacturing Taking A Hit

Amidst all of yesterday's turmoil two key pieces of economic data were lost. The Empire State index and Industrial Production.

Why is this information important? It's one of the four economic areas the NBER looks at when they are dating a recession:

The committee places particular emphasis on two monthly measures of activity across the entire economy: (1) personal income less transfer payments, in real terms and (2) employment. In addition, we refer to two indicators with coverage primarily of manufacturing and goods: (3) industrial production and (4) the volume of sales of the manufacturing and wholesale-retail sectors adjusted for price changes. We also look at monthly estimates of real GDP such as those prepared by Macroeconomic Advisers (see http://www.macroadvisers.com). Although these indicators are the most important measures considered by the NBER in developing its business cycle chronology, there is no fixed rule about which other measures contribute information to the process.


Let's start with the Empire State Index, which is from the NY Fed:

The Empire State Manufacturing Survey indicates that manufacturing activity in New York State weakened in September. The general business conditions index slipped 10 points, to -7.4. The new orders and shipments indexes rose modestly and were slightly above zero. Current employment indexes were negative. Current and future price indexes, though still elevated, retreated noticeably—particularly for prices paid. Indexes for future business conditions and most future activity measures remained close to last month’s levels or rose moderately in September.


Here's a chart from econoday:


This number (the gray line on the chart) has been weak for the last year. That's 8 months of sketchy reads which is not good. The only good news in this release is the current and future prices component which dropped. In conjunction with yesterday's CPI release, we're getting more and more indications inflation is becoming less of an issue.

As for industrial production:

Industrial production decreased 1.1 percent in August and was revised down in June and July to show smaller gains of 0.2 percent and 0.1 percent respectively. After little movement over the previous three months, factory output was down 1.0 percent in August, in part because of a drop of 11.9 percent in the production of motor vehicles and parts. Excluding motor vehicles and parts, the index for manufacturing decreased 0.3 percent. The output of mines declined 0.4 percent, and the output of utilities fell 3.2 percent, as temperatures in August were unseasonably mild.


Here are the relevant charts from econoday:


Note the year over year decline has been going on for the last 8 months and has been negative since the beginning of the year.

Also note that capacity utilization is still dropping, indicating the country is using less and less of its manufacturing capacity:


The bottom line is this is terrible news. Exports -- which have been an important growth component for the last year or so -- haven't been strong enough to keep these readings anywhere except stagnant. And domestic demand is obviously not strong enough to keep things humming. The capacity utilization drop indicates manufacturing is slowing shutting down what it can to remain profitable.

Friday, June 20, 2008

Manufacturing Looking Weak

Over the last few weeks we've seen three important manufacturing reports released: industrial production from the Federal Reserve, the Empire State index from the NY Fed and the Philadelphia Index from the Philadelphia. All three point to a continued slowdown in the manufacturing sector.

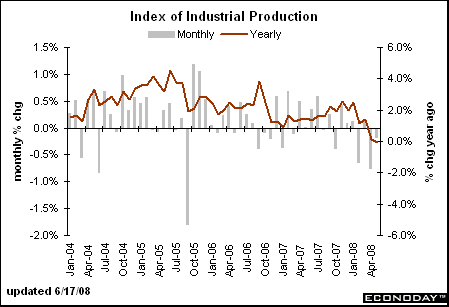
First up is overall industrial production:

U.S. industrial production fell unexpectedly by 0.2 percent in May as output at utilities shrank, while capacity use slipped to the lowest level in almost three years, the Federal Reserve said on Tuesday.

Economists polled by Reuters were expecting a 0.1 percent rise in output at the nation's factories, utilities and mines after a 0.7 percent fall in April.

Manufacturing output was unchanged during the month after a 0.9 percent decrease in April. Utilities output dipped by 1.8 percent.

Overall industrial production is 0.1 percent below its year-earlier level.

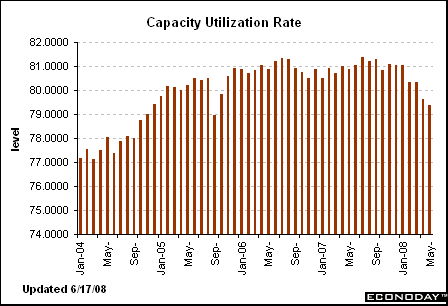
In further evidence of the slowing economy, total industry capacity use fell to 79.4 percent, the lowest since September 2005, from 79.6 percent.


The year over year chart indicates this indicator has been in a downward trend for some time. In addition, the overall report was weak with declines in a variety of sectors. In other words, there wasn't one number within the report the sent it lower; it was all the individual parts of the report sending it lower.


Also note the capacity utilization has been dropping. That means we're using less of our productive capacity to make stuff. That means manufacturing facilities are slowly cutting resources to save money. That's not a good development either.

The individual reports were not good either. From the Empire State survey:

The Empire State Manufacturing Survey indicates that manufacturing activity in New York State continued to deteriorate in June. The general business conditions index fell 5 points, to -8.7. The indexes for new orders, shipments, and unfilled orders were negative and lower than their May levels. The prices paid index remained elevated, falling only slightly below last month’s record high. The prices received index rose markedly and, at 26.7, approached a record level; the future prices received index also rose sharply, reaching a record high of 47.7. Employment indexes hovered around zero. Future indexes generally improved only slightly from the relatively low levels of the past several months, although the capital expenditures index rose several points.


This report shows a double whammy. First, overall activity is dropping right now. At the same time, prices are increasing. That places policy makers in a serious bind. To stimulate activity they need to lower interest rates (which they already have). However, to do so would increase the possibility of inflation.

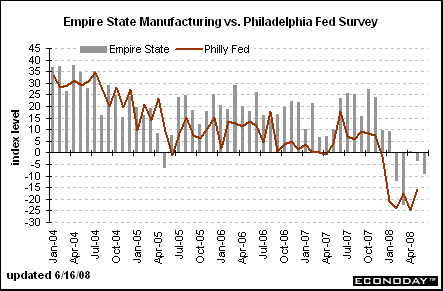
Here is a chart of the Empire and Philly indexes:


Note the Empire state number has been down 4 of the last 5 months.

The Philly report is not much better:

The region’s manufacturing sector continued to contract this month, according to firms polled for the June Business Outlook Survey. Indexes for general activity, new orders, shipments, and employment were all negative this month and registered lower readings than in May. There was an appreciable increase in the share of manufacturers reporting price pressures this month, and about one-third of the firms continued to report higher prices for their own products. The region’s manufacturing executives remained optimistic about future activity, but most future indicators fell back from their May readings.


Notice the exact some conditions as the Empire state number: declining activity and increasing price pressures. Not a good combination.

Short version: there is an overall slowdown underway right now.