Saturday, June 1, 2013

Weekly Indicators: return to deterioration edition


 - by New Deal democrat

April monthly data reported this past week included Case Shiller house prices up over 10% YoY, consumer confidence up sharply to five year highs, the Chicago manufacturing index up strongly to a six month plus high, personal income flat, the savings rate flat, and personal spending down slightly, but real income minus transfer payments up slightly. In the rear view mirror, Q1 GDP was revised down slightly.

Let's start this week's look at the high frequency weekly indicators by focusing on employment metrics, which are now decidedly mixed:

Employment metrics

American Staffing Association Index
  • 94 up 1 w/w, down -0.5% YoY
Initial jobless claims
  •   354,000 up 14,000

  •   4 week average 347,250 up 7,750
Tax Withholding
  • $154.2 B 20 days into May vs. $135.6 B last year, up $18.6 B or +13.7%
In the last month, the ASA has deteriorated to being negative compared with last year, and had its worst comparison yet this week. On the other hand, tax withholding had its best YoY comparison in over 4 months. Initial claims remain within their recent range of between 325,000 to 375,000.

Transport

Railroad transport from the AAR
  • -9300 or -3.3% carloads YoY

  • -4100 or -2.3% carloads ex-coal

  • +3400 or +1.4% intermodal units

  • -5900 or -1.1% YoY total loads
Shipping transport Rail transport has now had four negative weeks in the last two months. This is a real cause for concern.  The Harpex index has flattened after improving slowly from its January 1 low of 352. The Baltic Dry Index remains above its recent low.

Consumer spending Gallup's YoY comparisons have generally been extremely positive since last December, and were so again this week.  The ICSC varied between +1.5% and +4.5% YoY in 2012, while Johnson Redbook was generally below +3%. This week both were in the upper part of those ranges, and Gallup once again was strongly positive.

Housing metrics

Housing prices
  • YoY this week +6.8%
Housing prices bottomed at the end of November 2011 on Housing Tracker, and averaged an increase of +2.0% to +2.5% YoY during 2012. This weeks's YoY increase is again tied with its 6 year record.

Real estate loans, from the FRB H8 report:
  • up 0.1% w/w

  • up +0.5% YoY

  • +2.2% from its bottom
Loans turned up at the end of 2011 and averaged about 1% gains YoY through most of 2012.  In the last several months the comparisons have softened significantly.

Mortgage applications from the Mortgage Bankers Association:
  • +3% w/w purchase applications

  • +14% YoY purchase applications

  • -12% w/w refinance applications
Refinancing applications had their worst week in almost 6 months, due to higher interest rates, but purchase applications continue their slightly rising trend established earlier this year.

Interest rates and credit spreads
  •  4.78% BAA corporate bonds up +0.04%

  • 1.99% 10 year treasury bonds up +0.06%

  • 2.79% credit spread between corporates and treasuries down -.02%
Interest rates for corporate bonds, although rising strongly in the last month, have generally been falling since being just above 6% two years ago in January 2011, hitting a low of 4.46% in November 2012. On the other hand, Treasuries have returned in the last two weeks to their 2% high established in late 2011, compared with thier low of 1.47% in July 2012. Spreads have varied between a high over 3.4% in June 2011 to a low under 2.75% in October 2012, so spreads are still a positive.

Money supply

M1
  • +0.2% w/w

  • -0.5% m/m

  • +10.0% YoY Real M1

M2
  • -0.1% w/w

  • +0.2% m/m

  • +5.7% YoY Real M2
Real M1 made a YoY high of about 20% in January 2012 and has generally been easing off since.  This week's YoY reading increased sharply.  Real M2 also made a YoY high of about 10.5% in January 2012.  Its subsequent low was 4.5% in August 2012. It has increased slightly in the last few months.

Oil prices and usage
  •  Oil $91.97 down -$1.86 w/w

  • Gas $3.64 down -$0.03 w/w

  • Usage 4 week average YoY -2.5%
The price of a gallon of gas, after declining sharply in March and April, rose again in May. The 4 week average for gas usage remained negative after two positive YoY months several months ago.

Bank lending rates The TED spread recently increased again, but is still near the low end of its 3 year range.  LIBOR remains close to a 3 year low.

JoC ECRI Commodity prices
  • down -0.32 to 124.84 w/w

  • +6.03 YoY
After several weeks of more positive signs, this week we returned to the pattern of gradual deterioration that began in February. While most indicators remain positive, the data is mixed with some important negatives.

The most important negatives are the actual decline in temporary staffing and in railroad traffic. Also negative this week were mortgage refinancing and treasury bonds, reflecting the bond selloff. Jobless claims were negative for the week, but more neutral compared with the last several months, and real estate loans, just barely positive YoY. Shipping was also neutral, and gas uage is negative but may continue to reflect increased efficiency.

Positives included house prices, YoY purchase mortgage applications, commodities, money supply, and overnight bank rates. Consumer spending was strong again. The spread between corporate and treasury bonds contracted. Gas prices moved lower. Withholding taxes had their best 20 day period since January.

For me to be sold that the data is actually rolling over, I would want to see a sustained increase in jobless claims and a sustained deterioration in consumer spending. That isn't happening now.

Have a nice weekend.

Friday, May 31, 2013

Weekend Weimar, Beagle and Pit Bull

We've had a great week here at the Bonddad Blog.  First, Prof. Thoma linked to my John Hinderaker article earlier this week.  Yesterday, the housing post (debunking the new housing bubble meme) was picked up by Abnormal Returns, Real Clear Markets and FT Alphaville.   I'm flattered our little blog could help to spread the word.

For our new readers, we usually take the weekend off.  I'll be back on Monday; NDD will be here over the weekend.  Until then:

Oh .. the picture upload is working again!


Emerging Market ETFs are At Critical Support

H/T the Reformed Broker:

From ETF Trends:

The iShares MSCI Emerging Markets Index Fund (NYSEArca: EEM) declined 4.2% year-to-date and is testing the 200-day simple moving average, the third test in under a year.

Since climbing above its long-term trend line last year, the fund has survived two tests of this indicator, once in November 2012 and again in April 2013.

The emerging markets have been underperforming. The S&P 500 index is up 17.4% so far this year and is roughly 9% above its 200-day moving average. The MSCI World Index is up 11% this year. [Is the Party Over for High-Yield Emerging Market Bond ETFs?]

If emerging market stocks break below their 200-day moving average, it could be a warning signal for global stocks as the emerging markets are more sensitive to credit risks and economic growth.

This is something that I have noticed in individual emerging markets.  The biggest drop has been south of the border where the entire Latin American ETF complex is in a downtrend.  We're also seeing weaker performance in India, Brazil and the Eastern European ETFs.   

Here is the chart from the article:


Sorry Doomers, really, seriously, we're not in a new housing bubble


- by New Deal democrat

I normally don't bother with Doomers any more. They've demonstrated for 4 consecutive years that they've been wrong about just about everything. So yesterday I was minding my own business earning a living when Bonddad let me know that he had written a response to a "ZOMG We're in another housing bubble and we're DOOOOOMED!!!" piece. I took a look and ran down their links and past pieces, and sure enough, last year they were writing that the housing market wasn't recovering at all. Now that we have over 1 million housing permits annualized being reported, and prices being up 10% YoY, suddenly they are stomping their feet at wailing that it simply must mean there is a housing bubble.

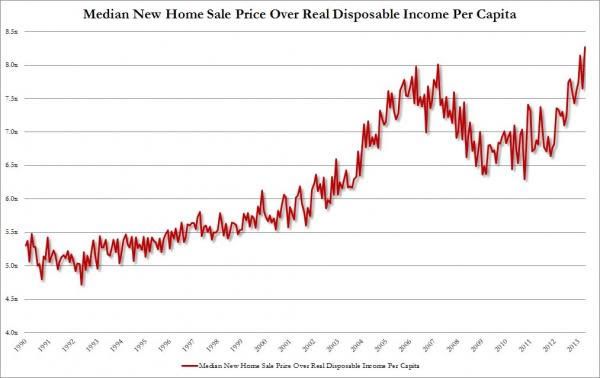
The critical graph in the article is this one, which comes from (of course) Zero Hedge:


The graph purports to show that housing prices are as out of whack as they were at the top of the housing bubble.

There's just one little problem with the graph: it is intellectually dishonest. It compares nominal house prices with inflation adjusted disposable income. To do a real comparison you need to compare nominal prices with nominal income, or inflation adjusted prices with inflation adjusted income.

Let me give an example. Suppose in a given number of years a dozen apples increased in price from $1 to $5. Meanwhile wages went up from $1 to $10, and inflation went from $1 to $7.50. Whether I compare in nominal or real terms, in my example wages went up twice as much as apples. But if I adjust wages for inflation, wages only went up from $1 to $1.33, while apples nominally went up from $1 to $5. Horrors! But intellectually dishonest. And that's exactly what Zero Hedge's graph does.

I'll go to the graphs to show you what the real story is in a moment, but let me also note a second important problem with the Zero Hedge graph. The graph shows prices from the Census Bureau's monthly report of median prices of new single family homes. Note two things: this does not include multifamily dwellings, and it does not include sales of existing homes.

The number of new homes sold in any period of time is much, much smaller than that for existing homes. For example, in April 2013, the last month reported, new single family homes were sold at a rate of 454,000 a year. But existing home sales as reported by the NAR came in at a rate of 4,970,000 a year, or more than 10 times that of new homes! Literally the entire "housing bubble" is actually claimed to be in less than 10% of the market!

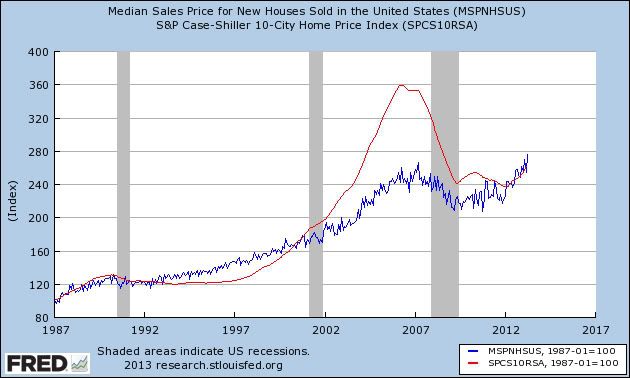
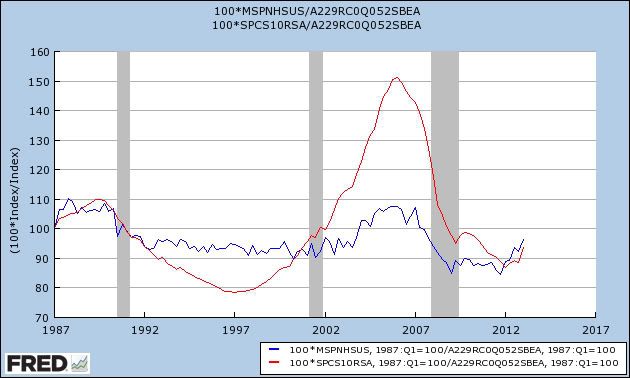
So now let's see what is really happening. In this first graph, I have shown the median price for new houses in blue, and the Case Shiller Housing Index which includes existing home sales in red, both normed to 100 in 1987. Both of these are nominal prices:


Note that existing homes were in a much bigger bubble than new single family homes, and fell much further during the bust.

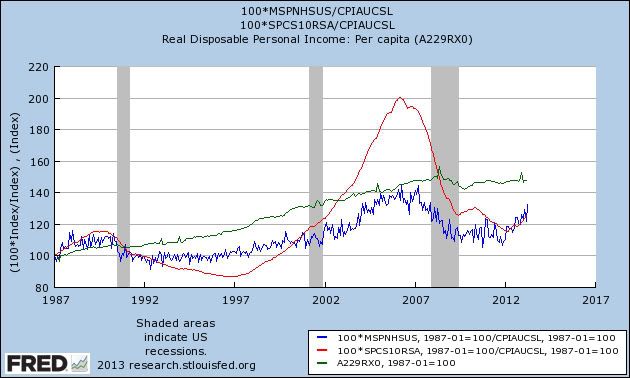
Next, let's adjust each for inflation, using the consumer price index:


The relationship between the two series is the same, but note that, for example real prices for existing homes doubled in real terms rather than going up 3.6x in nominal terms.

Now let's add a line (green) showing real disposable personal income, also normed to 100 in 1987:


Note that real disposable personal income actually increased more than either real existing home prices or new home prices at all times except briefly during the late 1980's and again during the bubble in existing home prices.

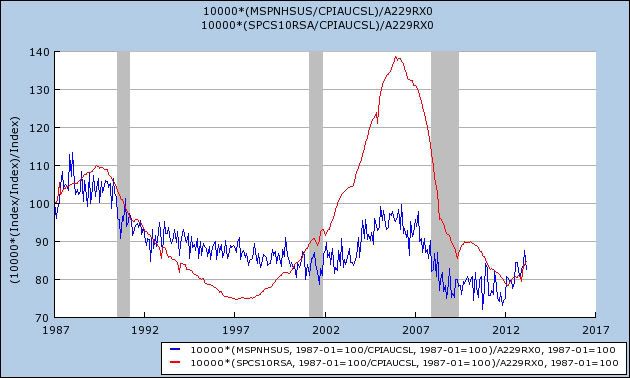
So now let's make the intellectually honest graphs. First, here's the graphcomparing real new home prices divided by real disposable pesonal income (blue) and real existing home prices divided by real disposable personal income (red):


And finally,just so you don't think I'm pulling a stunt with the inflation adjustment, here's a graph of the same thing using nominal prices and income without any Inflation adjustment:


Do those little upturns beginning in 2012 look like a bubble to you? If not, we're not in a new housing bubble and Zero Hedge and their acolyte Doomers are wrong < sigh > Again.

Market Analysis: Australia

As I've noted before, I'm bearish on Australia (see here, and here). Their central problem is that they are very dependent on China as an export market for Australian raw materials.  So as China slows, Australia's economy will follow suit.

Here is a summary of the Australian economy from the latest central bank's minutes:

Prices of tradable items fell substantially in the March quarter, with price declines widespread across items despite the relative stability of the exchange rate over the past couple of years. Members discussed the downward pressures on domestic costs and margins and the resulting declines in tradables prices, and whether these pressures would continue. In contrast to tradables inflation, non-tradables inflation appeared to have increased a little over the past year (abstracting from the direct effect of government policy changes). In the March quarter, inflation in new dwelling costs had risen, although inflation in a range of market services and non-traded food prices had eased. 

Other domestic data over the past few months had been mostly consistent with the earlier forecasts for growth of economic activity to remain a little below trend over 2013. Labour market conditions had remained somewhat subdued in recent months and the unemployment rate had edged higher, with trend employment growth below the rate of growth in the working-age population. Indicators of job advertisements suggested a degree of stabilisation, albeit at relatively low levels, while the Bank's liaison suggested that firms remained cautious about hiring staff.

Members noted that household consumption appeared to have strengthened early this year. The volume of retail sales had increased noticeably in the March quarter, and liaison suggested that retail sales had increased further in April. Indicators of consumer sentiment were above average levels, with reported buying conditions for dwellings and motor vehicles at relatively high levels. Sales of motor vehicles declined in the March quarter but remained at a high level. 

Dwelling prices were around 4 per cent above their trough in mid 2012, and auction clearance rates had increased. New borrowing for housing had also picked up, while forward-looking indicators and the Bank's business liaison suggested that demand for new housing was improving – notwithstanding a decline in building approvals in the March quarter – with enquiries from prospective purchasers and visits to display homes increasing. New dwelling investment had increased since the middle of the previous year, with members observing that approvals for higher-density dwellings had increased, while approvals for detached dwellings had been flat over this period. 

Members noted that survey-based measures of conditions in the business sector remained below average, although some measures of business confidence had picked up a little in recent months. Indicators of business investment in the near term remained soft: capital imports had declined in recent months, office vacancy rates had risen and indicators of capacity utilisation were below long-run average levels. Liaison continued to suggest that firms remained cautious about undertaking significant expansion. Consistent with this, growth of business debt had been more modest in the early part of 2013.

There are a few important developments mentioned above.
  • Australia is a raw materials exporter, so the recent decline in commodity prices is very important for their economy.  Right now, the overall condition of the commodity markets they are weak.  While there is not an imminent crash around the corner, the Chinese slowdown and ample supplies of copper and oil are having a depressing effect on prices.
  • The Australian consumer appears to be holding his own.  While unemployment has ticked up, it is still low at 5.5%.  While auto sales were down month to month, they did increase 3.3% from last year.   And the trend in retail sales is strong.
  • However, the business environment is not good.  Consider this summation from the latest monthly business survey: The business environment remained difficult in April, with business conditions improving only marginally, after slumping to the lowest level in almost four years in March. There were only modest improvements in trading conditions and profitability, mostly offset by worse employment conditions – the weakest in four years. Implied job losses were most prevalent in manufacturing, wholesale and now recreation & personal services sectors, (where labour cost pressures were highest). Persistent weakness in forward indicators of demand, combined with tight fiscal policy settings, imply little improvement in near-term activity – indeed suggest modest weakening.
Let's turn to the Australian ETF:


Prices penetrated the near year-long rally earlier this month and have continued lower since.  Prices have brought the shorter EMAs lower and have also led to the shorter EMAs crossing below the longer EMAs.  We also see s slight bump in volume on the sell-off.  Prices are now slightly below the 200 day EMA.  Momentum is declining and volatility is increasing.

The Fib levels and Fib fan levels are now downside targets for price action.

 
In addition to a drop in the Australian ETF, prices of the Australian dollar's ETF have also dropped.  The key point on this chart is prices have moved through key technical support at the 100-100.5 level.  This makes the yearly low around the 94.5 level the logical price target.

The Australian dollar has become more important over the last few years as a reserve currency, which is the reason it has remained at high levels.  However, the Australian Central Bank recently lowered rates (which were some of the highest in the world), which helped to lead to the decline in prices.

Thursday, May 30, 2013

No, We're Nowhere Near A Housing Bubble

Dear God ... I am constantly amazed at the doomers and their complete inability to look at data through anything but a "sky is falling" mentality.  Now there's talk of a new housing bubble forming.  Let me debunk this right now.

First, yes prices are increasing at strong rates.  There are several reasons for this, the most important of which is a small inventory (all graphs are from Calculated Risk).


Notice that the months of available inventory for new homes is near the lowest level seen for nearly 50 years.  Economics 101: low inventory+higher demand = increasing prices.


And we see the exact same situation in the existing home sales market.  Again, to rehash basic econ: diminished supply+increased demand = increasing prices.

And -- how can we have another bubble when sales are still this low?  Consider the following charts of new and existing home sales:


New homes sales are still near 50 year lows and existing home sales are at levels from the early 2000s.

But Bonddad!  Lumber is crashing!  That means the new home market is drying up!

No.  First, take a look at the pace of building permits:


Building permits bottomed hard at the end of 2009, but have been steadily climbing since.  And then there is housing starts:


Housing starts are also increasing.

But Bonddad! Last month the number of starts CRASHED!!!!!! WE'RE Doomed!!!!!  Ah .... no.  Let's compare housing starts and housing permits:


Last month permits increased while housing starts decreased.  The most logical answer is that housing starts decreased because of the large increase the previous month -- meaning last month was a cooling off period from a big bump.

So -- why is lumber dropping?  Because all commodities are dropping.   As I noted on May 17, there is no inflation in the system.  As a result, commodity bets are dropping across the boards.  All major asset classes -- grains, softs, oil, copper, precious metals -- are at low levels.  The great commodity bull run is over; hedge funds and large investors are dropping this asset class in a big way. Take a look at the charts for these sectors in this post from a few weeks ago.

To make the argument that we're in the middle of a housing bubble when the economy is slowly growing (2.4% annual growth rate), with unemployment still over 7% is just ridiculous.    


Market Analysis: Chile

Let's start with the international and domestic assessment of the Chilean Central Bank from their latest policy announcement where they kept rates at 5%:

International financial conditions show some improvement. The Eurozone
remains in recession and in a fragile fiscal and financial situation, while there is
increased optimism in the United States and Japan. Incoming indicators for
China and other emerging economies point at marginally weaker growth, while
several central banks have lowered their policy rates. The dollar has appreciated
in international markets. Metal prices receded in recent weeks, especially for
copper.


Domestically, first-quarter indicators show decelerating output and demand. The
labor market is still tight. Headline and core inflation measures remain close to
1% y-o-y, while surveys suggest that inflationary expectations over the policy
horizon remain around the target. The exchange rate has depreciated; however, in real terms it is still in the lower part of the range that is compatible with its longterm fundamentals


Copper is Chile's primary export, so it's price and the demand for the metal is obviously paramount to the economic outlook for the country.


As the weekly chart above shows, copper prices are very weak, trading near a three year low.  China's expansion is slowing, the EU is in a depression, US growth is weak and there is excess supply on the market. I detailed the market in more detail here, however, the overall condition for this market is still bearish.

As a result of the weaker copper and export market, the Chilean economy is decelerating, as seen in this chart of the year over year (Y/O/Y) percentage change in seasonally adjusted GDP:


Coming out of the recession we see large percentage year over year changes.  However this is due more to the weak comparison to the previous year's numbers then strength in the underlying economy.  Starting in 2012 we see strong consistent Y/O/Y/ growth rates in the 5% range.  While this pace has been decelerating for the last three quarters, YOY GDP growth is still printing around 5%.  But remember that growth is relative.  While this number would be remarkable for the US, the deceleration of the percentage change over the last two quarters raises concerns.

Let's look at the underlying economic numbers.


Overall PCEs have settled down from their post recession highs into a more manageable range of 1%-2%.  However, the drop in both service and non-durable expenditures in the 1Q13 is probably causing concern for the central bankers.


The drop in machinery investment is also causing concern, as it indicates the mining sector -- an important component of the Chilean economy -- is slowing its pace of investment.

Finally, there is the balance of trade:


In late 2011 and through the first half of 2012, we see a strong balance of trade.  This number went negative in the last half of 2012, but returned to a positive trend in 2013.  But the rate of change now is weaker than the numbers from the first half of 2012.

Let's take a look at the chart of the Chile ETF.


Since the beginning of February, the Chile ETF has been in a clear decline.  It has moved through all Fib levels established between June 2012 and February 2013 and is fast approaching a 100% retracement.  Prices are below the 200 day EMA and have pulled all the shorter EMAs lower as well.


Wednesday, May 29, 2013

EU Austerity Starts to Crumble

From the FT:

Brussels will on Wednesday give its clearest signal yet that it is moving away from a crisis response based on austerity, allowing three of the EU’s five largest economies to overshoot budget deficit limits and pushing instead for broader reform.
In its annual verdict on national budgets of all 27 EU members France, Spain and the Netherlands will be given a waiver on the annual 3 per cent deficit limit. Brussels will also free Italy from intensive fiscal monitoring despite its new prime minister’s decision to reverse a series of tax increases imposed by his predecessor.
The European Commission will make these moves on the condition that national governments embark on stalled labour market reforms. Brussels believes the delay in implementing them has contributed to Europe’s unemployment crisis. “There are limits to what can be achieved with austerity,” said Maarten Verway, a senior European Commission economist. 

I should add that there's a difference between the anti-austerity policies mentioned in the article such as letting budget deficits remain at certain levels for an extended period of time and true anti-austerity measures such as using government spending to grow the economy.  But, this is a start nonetheless. 

Belly of the Treasury Curve Is At Critical Technical Levels


The charts above are for the ETFs that represent the belly of the treasury curve -- the 3-7year (IEIs) and 7-10 year (IEFs) areas.  Yesterday there was an incredibly large sell-off in this area of the market, leaving prices right at important support levels.

Until now, the assumption that the Fed would buy bonds in the open market has provided a technical price floor.  However, last week's release of the most recent Fed meeting had this paragraph which indicated the bond buying program may be running into internal resistance:

A few members expressed concerns that investor expectations of the cumulative size of the asset purchase program appeared to have increased somewhat since it was launched last September despite a notable decline in the unemployment rate and other improvements in the labor market since then. In contrast, a few other members focused on evidence that market expectations about the total size of the program had changed little, on net, since the program was launched or had responded appropriately to incoming information. Members generally agreed on the need for the Committee to communicate clearly that the pace and ultimate size of its asset purchases would depend on the Committee's continued assessment of the outlook for the labor market and inflation in addition to its judgments regarding the efficacy and costs of additional purchases and the extent of progress toward its economic objectives. To highlight its willingness to adjust the flow of purchases in light of incoming information, the Committee included language in the statement to be released following the meeting that said the Committee was prepared to increase or reduce the pace of its purchases to maintain appropriate policy accommodation as the outlook for the labor market or inflation changes. 

And there was this line from the latest Fed policy statement:

The Committee will closely monitor incoming information on economic and financial developments in coming months. The Committee will continue its purchases of Treasury and agency mortgage-backed securities, and employ its other policy tools as appropriate, until the outlook for the labor market has improved substantially in a context of price stability. The Committee is prepared to increase or reduce the pace of its purchases to maintain appropriate policy accommodation as the outlook for the labor market or inflation changes. In determining the size, pace, and composition of its asset purchases, the Committee will continue to take appropriate account of the likely efficacy and costs of such purchases as well as the extent of progress toward its economic objectives. 

See this post from Barry for an explanation.

Market Analysis: Mexico

On May 16th, I highlighted the current Mexican president's reform agenda along with an upgrade in Mexican debt -- both of which were positive developments for the economy.

Yet the next day, 1Q GDP was issued, and the news was decidedly bearish:

Gross domestic product in the first three months of the year rose 0.8 percent from the year-ago period, less than the 1.1 percent median estimate in a Bloomberg survey of 18 economists. GDP grew 0.5 percent from the previous quarter, an annualized rate of 1.83 percent. The median estimate from seven analysts surveyed by Bloomberg was for a 0.3 percent gain. 

The economy is growing at its slowest pace since GDP contracted 6.2 percent in 2009 in the aftermath of Lehman Brothers Holdings Inc.’s collapse. Today’s report showing industrial output is contracting increases the probability policy makers will cut rates as soon as July, said Gabriel Casillas, chief economist and head of research at Grupo Financiero Banorte SAB.

“It’s a very low growth figure and shows the economy is decelerating,” Casillas, who is based in Mexico City, said in a telephone interview. Mexico was hurt by “the slowdown in manufacturing of the U.S. that started in the fourth quarter of last year.” 

And retail sales have contracted on a year over year basis for the second month in a row:


Mexico’s retail sales (MXWRTRYO) surprised analysts in March by contracting for a second straight month for the first time since 2009, bolstering bets policy makers will cut interest rates again this year. 

Sales fell 2.4 percent from a year earlier, the national statistics agency said today, more than forecast by any of the 19 analysts surveyed by Bloomberg. The median estimate was for an increase of 0.3 percent. Retail sales climbed 0.25 percent from the previous month. 

Also consider that recent fund flow data indicates that foreign investors are decreasing their inflows. 

Other economic data in recent days have added to the worries. Foreign direct investment last year plunged to $12.7 billion, from an average of around $23 billion during the past decade, according to CEPAL, a UN-linked research organisation. It said the figure was affected by one-offs, such as a decision by Spain’s Banco Santander to list its Mexican subsidiary, raising $4 billion. That counted as an outflow of foreign investment. Some economists pointed to concerns that high levels of drug-related crime may also be taking a toll on investment, notably in tourism. Last year Mexico slipped out of the top ten of global tourist destinations.

As a result the Mexican market has sold off over the last week:


Technical support for the ETF was around the 70 level.  Prices moved through that level last week in a convincing manner on large volume spikes.  Support exists at various Fib levels; currently, the 61.8% Fib level from the June-April rally along with the middle Fib fan are supporting prices. 

Tuesday, May 28, 2013

The Unknowing John Hinderaker

At some point, a leading figure in the conservative movement told John Hinderaker that he had a tremendous amount of economic knowledge which he should share with the world, and, in doing so, provide enlightenment and deep economic insights for his blog's readers.

Whoever said this to Mr. Hinderaker lied with impunity.

Remember, this is the same person who still believes that hyper-inflation is around the corner, the CRA led to the economic collapse and that the economy just hasn't grown at all in the last four years.  I demonstrated the depth and degree of Hinderaker's economic incompetence and ignorance in this piece a few months ago. 

Now Mr. Hinderaker is back with a piece titled, The Uncivil Mr. Krugman.  Here's the money quote:

For the last year or two, Krugman has been campaigning in favor of public debt. As a liberal, the end point of his ambitions is the expansion of government, and Krugman has argued vociferously that ballooning debts around the world should not constrain the relentless march of big government. As part of that effort, he has viciously attacked academic work by Harvard’s Carmen Reinhart and Kenneth Rogoff, which shows that at a high level (90% of GDP), government debt impairs economic growth. Reinhart and Rogoff have finally had enough, and on Saturday they published an open letter to Krugman

Mr. Hinderaker: over the last few months, the 90% threshold has been shown to be non-existent.  Mike Konczal over at the Next New Deal was the one who best summarized the work which exposed the fallacy of RR's claim.  Since this data was published, there has been a fair amount of back and forth between RR on one side and Krugman/DeLong on the other debating the impact of RR's original work, with RR attempting to downplay their actual impact and rehabilitate their reputation while Krugman and others (most notably Brad DeLong) have shown that RR are at best being disingenuous regarding their attempted rehabilitation.

Over the weekend, Brad DeLong pretty much destroyed RR's attempt at a rebuttal to the debunking.  For me, the money paragraph is here:

The third thing to note is how small the correlation [between high debt and lower growth] is. Suppose that we consider a multiplier of 1.5 and a marginal tax share of 1/3. Suppose the growth-depressing effect lasts for 10 years. Suppose that all of the correlation is causation running from high debt to slower future growth. And suppose that we boost government spending by 2% of GDP this year in the first case. Output this year then goes up by 3% of GDP. Debt goes up by 1% of GDP taking account of higher tax collections. This higher debt then reduces growth by… wait for it… 0.006% points per year. After 10 years GDP is lower than it would otherwise have been by 0.06%. 3% higher GDP this year and slower growth that leads to GDP lower by 0.06% in a decade. And this is supposed to be an argument against expansionary fiscal policy right now?….

Also read this post from Robert's Stochastic Thoughts which thoroughly dismantles RR's open letter to Krugman.

But here's the real issue: like all issues economic, Mr. Hinderaker is a day late and a dollar short.  First, the debunking of RR's 90% claim occurred over a month ago.  Since the revelation that the paper's data was caused by an Excel coding error (very much a rookie mistake and something that if it had occurred in the economic left would have been touted by Powerline from all points on high), the entire austerity argument has come off the rails.  While this occurred, there was not a peep from the political right on the topic -- and remarkably little from the economic right.  In fact, in his post, Mr. Hinderaker obviously still believes the 90% line exists, when in fact it does not (see DeLong's post above).  That shows just how behind the eight ball Mr. Hinderaker is regarding the current state of the austerity debate.


But more to the point: Krugman's analysis of the current economic scenario has been dead-on accurate for the last four years and  Krugman's work on an economy at the 0% lower band has proven to be the best model for understanding and interpreting current macro-level economic events. Like him or not, there is no ignoring the fact that his analysis has been correct.

Mr. Hinderaker, on the other hand, has proven to be 100% wrong regarding his economic analysis.  He still believes in hyper inflation, when the exact opposite is happening.  He still claims there is no growth in the economy.  He has yet to acknowledge that the stock market is making new highs or that housing is growing again.  In short, if he took his own advice regarding economics, he'd probably lost money the last four years because his ineptitude is that severe.

So, please, Mr, Hinderaker: you're really embarrassing yourself now.  The amount of economic ignorance you've displayed in your two most recent economic posts indicates that you're not competent to participate in an economic discussion.  Please stop trying.


Market Analysis: US

First, let's review the economic news of the US from last week.  The trend from the numbers was very positive; none of the numbers released was negative.
  
The Good

The Chicago Fed's national activity index's three month moving average ticked up from -.05% to -.04%.  However, the month to month reading was negative, with three of four broad categories declining and no section making a positive contribution.  This is a "just barely good" level, especially considering the negative reading (and negative breadth of the underlying data) on the month to month basis.

The housing rebound continues: Existing home sales increased .6%.  As CR notes, the best part of this news is the low inventory level, which will lead to further upward pressure on prices.  New home sales increased 2.3%, with previous months readings revised upwards. with low inventory as well.  As with the existing home market, this is leading to an increase in prices.

Durable goods orders increased:  New orders for manufactured durable goods in April increased $7.2 billion or 3.3 percent to $222.6 billion, the U.S. Census Bureau announced today. This increase, up two of the last three months, followed a 5.9 percent March decrease. Excluding transportation, new orders increased 1.3 percent. Excluding defense, new orders increased 2.1 percent  Even without transportation numbers, we see an increase.

The Markit "flash" reading declined but was still positive: The Markit Flash U.S. Manufacturing Purchasing Managers’ Index™ (PMI™)1 fell for the second month running in May, falling to its lowest reading since last October. At 51.9, down marginally from April’s 52.1, the flash PMI index, which is based on around 85% of usual monthly replies, was consistent with a moderate improvement in overall manufacturing business conditions. 

As noted in the report, the one big negative reading came from the employment sub-series, which printed at a 7-month low.  However, this reading is relative, as it printed at a 52.2 level (with 50 being the level marking the line between expansion and contraction).

The Kansas City Fed manufacturing number was positive, but just barely:  The month-over-month composite index was 2 in May, up from -5 in both April and March (Tables 1 & 2, Chart). The composite index is an average of the production, new orders, employment, supplier delivery time, and raw materials inventory indexes. The rise in production came from both durable and non-durable goods-producing plants, with the biggest increase coming from machinery and metals manufacturing. Other month-over-month indexes were mixed. The production index edged up from 1 to 5, and the shipments, new orders, and new orders for export indexes also rose. In contrast, the employment index fell from -3 to -7, while the order backlog index was unchanged. The raw materials inventory index rebounded from -17 to 0, and the finished goods inventory index moved slightly higher.

There has been an odd divergence between the ISM/Markit numbers and the regional numbers, with the former being strong and the second showing weakness to being just barely positive.

The Bad: 

None of the numbers issued was negative.

Last week we had testimony from Fed Chair Bernanke on the overall condition of the US economy.  Here's his summation:

Economic growth has continued at a moderate pace so far this year. Real gross domestic product (GDP) is estimated to have risen at an annual rate of 2-1/2 percent in the first quarter after increasing 1-3/4 percent during 2012. Economic growth in the first quarter was supported by continued expansion in demand by U.S. households and businesses, which more than offset the drag from declines in government spending, especially defense spending. 

Conditions in the job market have shown some improvement recently. The unemployment rate, at 7.5 percent in April, has declined more than 1/2 percentage point since last summer. Moreover, gains in total nonfarm payroll employment have averaged more than 200,000 jobs per month over the past six months, compared with average monthly gains of less than 140,000 during the prior six months. In all, payroll employment has now expanded by about 6 million jobs since its low point, and the unemployment rate has fallen 2-1/2 percentage points since its peak. 

Despite this improvement, the job market remains weak overall: The unemployment rate is still well above its longer-run normal level, rates of long-term unemployment are historically high, and the labor force participation rate has continued to move down. Moreover, nearly 8 million people are working part time even though they would prefer full-time work. High rates of unemployment and underemployment are extraordinarily costly: Not only do they impose hardships on the affected individuals and their families, they also damage the productive potential of the economy as a whole by eroding workers' skills and--particularly relevant during this commencement season--by preventing many young people from gaining workplace skills and experience in the first place. The loss of output and earnings associated with high unemployment also reduces government revenues and increases spending on income-support programs, thereby leading to larger budget deficits and higher levels of public debt than would otherwise occur. 

Consumer price inflation has been low. The price index for personal consumption expenditures rose only 1 percent over the 12 months ending in March, down from about 2-1/4 percent during the previous 12 months. This slow rate of inflation partly reflects recent declines in consumer energy prices, but price inflation for other consumer goods and services has also been subdued. Nevertheless, measures of longer-term inflation expectations have remained stable and continue to run in the narrow ranges seen over the past several years. Over the next few years, inflation appears likely to run at or below the 2 percent rate that the Federal Open Market Committee (FOMC) judges to be most consistent with the Federal Reserve's statutory mandate to foster maximum employment and stable prices. 

Over the nearly four years since the recovery began, the economy has been held back by a number of headwinds. Some of these headwinds have begun to dissipate recently, in part because of the Federal Reserve's highly accommodative monetary policy. Notably, the housing market has strengthened over the past year, supported by low mortgage rates and improved sentiment on the part of potential buyers. Increased housing activity is fostering job creation in construction and related industries, such as real estate brokerage and home furnishings, while higher home prices are bolstering household finances, which helps support the growth of private consumption.
 
Severe fiscal and financial strains in Europe, by weighing on U.S. exports and financial markets, have also restrained U.S. economic growth over the past couple of years. However, since last summer, financial conditions in the euro area have improved somewhat, which should help mitigate the economic slowdown there while also reducing the headwinds faced by the U.S. economy. Also, credit conditions in the United States have eased for some types of loans, as bank capital and asset quality have strengthened.


Let's turn to the US markets, starting with the SPYs:


The overall uptrend in the market is still very much intact.  While there is a trend line connecting the mi-November and early 2013 lows (the blue line), the better trend line is the one connecting the early 2013 and mid-April lows (the red line).  Last week's action led to some negative technical developments.  First, notice the sell-off on a volume spike, indicating there was a rash to traders looking to get out.  Prices are now below the 10 day EMA and are using the 20 day EMA for technical support.  The MACD is about to give a sell-signal as well.

Given last week's price action, a sell-off the the 159-160 level (the mid-April highs) seems more likely now.


The 60-minute chart shows the price action in more detail.  Notice the rally from April 21 to May 21, with last week's price action breaking the trend.  Also note the 159 price level is not only a price high, it is also a Fib level on the 60-minute chart, adding gravity to that level.


Despite the continued ups and downs of the treasury market, the IEFS are still in a trading range bound by ~105 at the lower end and 107.75-108.5 at the top end.  With the Fed still buying bonds in the open market, there is little hope for a drop in this market.


Despite several efforts to move through the 21.5 level, prices found support there.  Starting in early February, we see a rally as prices moved to the Fib mid-levels during March and April, then moved through resistance to move to the 23 price area.  Prices moved lower last week, finding support in the 22.7 area.

Monday, May 27, 2013

In memoriam: Lincoln's Gettysburg address


The observance of Memorial Day, specifically reserved to honor US war dead, began as Decoration Day, when fresh May flowers were picked and laid upon the graves of the nearly 600,000 Civil War dead, observed independently for both the Union and the Confederate soldiers.

In solemn observance, here is Lincoln's speech dedicating the cemetery for the Union fallen at Gettysburg:
Four score and seven years ago our fathers brought forth on this continent a new nation, conceived in liberty, and dedicated to the proposition that all men are created equal.

Now we are engaged in a great civil war, testing whether that nation, or any nation so conceived and so dedicated, can long endure. We are met on a great battlefield of that war. We have come to dedicate a portion of that field, as a final resting place for those who here gave their lives that that nation might live. It is altogether fitting and proper that we should do this.

But, in a larger sense, we can not dedicate, we can not consecrate, we can not hallow this ground. The brave men, living and dead, who struggled here, have consecrated it, far above our poor power to add or detract. The world will little note, nor long remember what we say here, but it can never forget what they did here. It is for us the living, rather, to be dedicated here to the unfinished work which they who fought here have thus far so nobly advanced. It is rather for us to be here dedicated to the great task remaining before us—that from these honored dead we take increased devotion to that cause for which they gave the last full measure of devotion—that we here highly resolve that these dead shall not have died in vain—that this nation, under God, shall have a new birth of freedom—and that government of the people, by the people, for the people, shall not perish from the earth.

Sunday, May 26, 2013

An appreciation: Ray Manzarek


- by New Deal democrat

I'd like to address this post to our younger readers.

Long time readers of this blog know that one of my guilty pleasures was being a big fan of the Doors. When their lead singer died over 40 years ago, he did more than destroy his own 27 year old body with booze and drugs, he also left three other extremely talented musicians high and dry.

The band collectively was the Edgar Allen Poe of rock music. And just like the poetry of Edgar Allen Poe, I outgrew the overwrought florid poetry of Jim Morrison by the time I hit college. But the virtuoso embellishments of the three musicians, especially keyboardist Ray Manzarek, remained. Truth be told, even as a teenybopper it was the keyboards more than the voice or lyrics that I paid attention to most. Every now and then, I still went back and listened.

You may disdain most of the Boomer music (and actually most of the popular music of most generations is forgettable), but it would be a shame if the overhyped legend of Morrison caused you to avoid the great contributions of the other musicians. In that spirit, here is "Spanish Caravan," a 3 minute piece 2/3's of which has no singing at all. The first half is a duet between flamenco guitar and harpsicord, and the second half an acid rock recapitulation between electric guitar and organ:


With the passing of Ray Manzarek, I am feeling very old. Someday it will all pass. Really, truly, YOLO.

Weekly Indicators: no one here gets out alive edition


 - by New Deal democrat

April monthly data reported this past week included new and existing home sales, both up modestly, and durable goods orders, up significantly, but still less than March's decline.

And in very sad news, my favorite rock musician from my childhood, Doors' keyboardist Ray Manzarek, died at age 74.

Let's start our look at the high frequency weekly indicators again with transport:

Transport

Railroad transport from the AAR
  • +5300 or +1.9% carloads YoY

  • +1400 or +2.3% carloads ex-coal

  • +8500 or +3.5% intermodal units

  • +13,600 or +2.6% YoY total loads
Shipping transport Rail transport had a third decent week after turning negative for three recent weeks.  The Harpex index continues to improve slowly from its January 1 low of 352, and the Baltic Dry Index remains above its recent low.

Consumer spending Gallup's YoY comparisons have generally been extremely positive since last December, and were so again this week.  The ICSC varied between +1.5% and +4.5% YoY in 2012, while Johnson Redbook was generally below +3%. This week both were in the upper part of those ranges.

Employment metrics

Initial jobless claims
  •   340,000 down 20,000

  •   4 week average 339,500 down 250
American Staffing Association Index
  • 93 unchanged w/w, down -0.1% YoY

Tax Withholding
  • $125.3 B 17 days into May vs. $112.4 B last year, up $12.9 B or +11.5%

  • $149.0 B for the last 20 days vs. $133.7 B last year, up $15.3 B or +11.4%
Initial claims declined after spiking last week, and remain within their recent range of between 325,000 to 375,000.  The ASA has deteriorated to the point of being essentially unchanged from last year as well. Tax withholding was robust compared with the first few months of the year.

Housing metrics

Housing prices
  • YoY this week +6.8%
Housing prices bottomed at the end of November 2011 on Housing Tracker, and averaged an increase of +2.0% to +2.5% YoY during 2012. This weeks's YoY increase is tied with its 6 year record.

Real estate loans, from the FRB H8 report:
  • unchanged w/w

  • unchanged YoY

  • +2.1% from its bottom
Loans turned up at the end of 2011 and averaged about 1% gains YoY through most of 2012.  In the last several months the comparisons have softened significantly.

Mortgage applications from the Mortgage Bankers Association:
  • -3% w/w purchase applications

  • +10% YoY purchase applications

  • -12% w/w refinance applications
This year purchase applications have finally established a slightly rising trend.  Refinancing applications were very high for most of last year with record low mortgage rates, but decreased slightly since then.

Interest rates and credit spreads
  •  4.74% BAA corporate bonds up +0.09%

  • 1.93% 10 year treasury bonds up +0.10%

  • 2.79% credit spread between corporates and treasuries down -.01%
Interest rates for corporate bonds, although rising in the last month, have generally been falling since being just above 6% two years ago in January 2011, hitting a low of 4.46% in November 2012.  Treasuries have fallen from about 2% in late 2011 to a low of 1.47% in July 2012. Spreads have varied between a high over 3.4% in June 2011 to a low under 2.75% in October 2012.

Money supply

M1
  • +0.1% w/w

  • -2.3% m/m

  • +10.3% YoY Real M1

M2
  • +0.1% w/w

  • +0.2% m/m

  • +5.8% YoY Real M2
Real M1 made a YoY high of about 20% in January 2012 and has generally been easing off since.  This week's YoY reading increased sharply.  Real M2 also made a YoY high of about 10.5% in January 2012.  Its subsequent low was 4.5% in August 2012. It has increased slightly in the last couple of months.

Oil prices and usage
  •  Oil $93.83 down -$2.19 w/w

  • Gas $3.67 up +$0.07 w/w

  • Usage 4 week average YoY -3.3%
The price of a gallon of gas, after declining sharply in March and April, has risen again in May. The 4 week average for gas usage remained negative after previously spending nine weeks in a row being positive YoY.

Bank lending rates The TED spread recently increased again, but is still near the low end of its 3 year range.  LIBOR remained at its new 52 week low and is close to a 3 year low.

JoC ECRI Commodity prices
  • down =0.33 to 125.16 w/w

  • +4.61 YoY
After months of gradual deterioration, two weeks ago there were no negatives in the weekly indicators. Last week was a great big "meh." This week was mixed but more positive than negative.

Positives included the decrease in initial jobless claims, house prices, and YoY purchase mortgage applications. Money supply was positive. Overnight bank rates are somnolent. Consumer spending was strong again. Rail traffic had another decently positive week.

Negatives included real estate loans, temp staffing, increasing bond rates, and the Baltic Dry Index, but these were all minor.

Sooner or later, we all belong to the ages. And the ages don't care. So enjoy today.