It's that time of the week. It's time to stop thinking about the economy and markets and think about anything else. For me, I'm thinking about my thesis! What fun! So, I'll see you bright and early Monday morning.
Until then, here is a dose of dog cuteness.
Friday, April 4, 2008
Payroll Report, Well, Stinks
From the BLS:
There is no way to spin these numbers as anything but horrible.
Also -- get ready to hear a lot of "job losses aren't that big so we're not in a recession" talk (Remember -- we live in the age of spin and faith-based policies rather than fact). To this statement, note that job creation for the last expansion was the weakest of any recovery since WWII. Weak job creation = far fewer job losses on the flip side.
The WSJ's Marketbeat Blog had the best take:
The unemployment rate rose from 4.8 to 5.1 percent in March, and nonfarm payroll employment continued to trend down (-80,000), the Bureau of Labor Statistics of the U.S. Department of Labor reported today. Over the past 3 months, payroll employment has declined by 232,000. In March, employment continued to fall in construction, manufacturing, and employment services, while health care, food services, and mining added jobs. Average hourly earnings rose by 5 cents, or 0.3 percent, over the month.
The number of unemployed persons increased by 434,000 to 7.8 million in March, and the unemployment rate rose by 0.3 percentage point to 5.1 percent. Since March 2007, the number of unemployed persons has increased by 1.1 million, and the unemployment rate has risen by 0.7 percentage point.(See table A-1.)
In March, the number of persons unemployed because they lost jobs increased by 300,000 to 4.2 million. Over the past 12 months, the number of unemployed job losers has increased by 914,000.
There is no way to spin these numbers as anything but horrible.
Also -- get ready to hear a lot of "job losses aren't that big so we're not in a recession" talk (Remember -- we live in the age of spin and faith-based policies rather than fact). To this statement, note that job creation for the last expansion was the weakest of any recovery since WWII. Weak job creation = far fewer job losses on the flip side.
The WSJ's Marketbeat Blog had the best take:
For another month, the data was worse than expected, and the previous months were revised lower, and futures markets are quickly adjusting from previous lofty levels. This is the worst jobs figure since March of 2003, and stock futures have backed off a bit, although those markets were already pulling back prior to the release.
Nonfarm payrolls fell by 80,000 in March, and January and February figures were revised lower as well. Both months were revised to a loss of 76,000 jobs, according to the Labor Department. The unemployment rate rose to 5.1% from 4.8% in February.
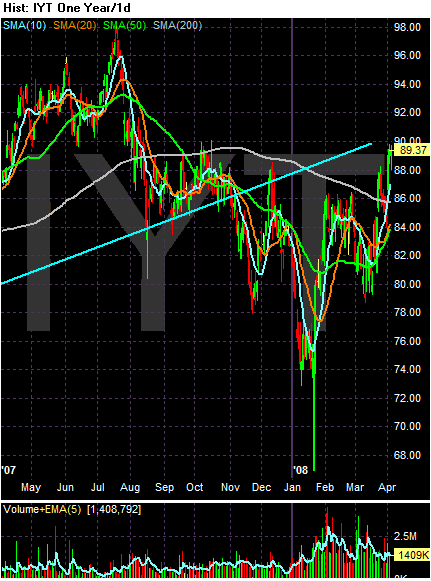
Are Transports Signaling a Rebound?
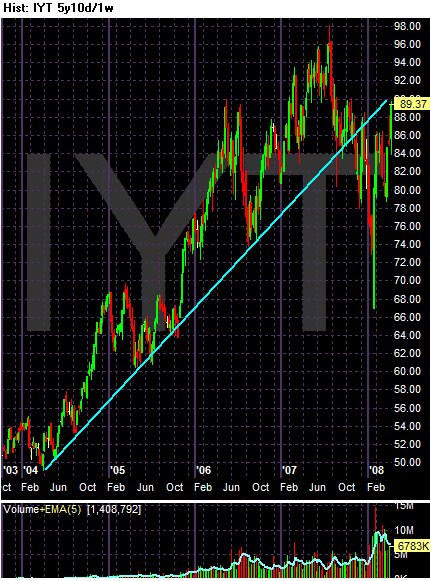
The Transportation average is a very important market. When the economy is expanding we need to ship more and more stiff from point A to point B. When the economy is slowing we ship less stuff from point A to point B. The transports should response to these events by rising and falling.
Let's look at the averages to see what's going on.
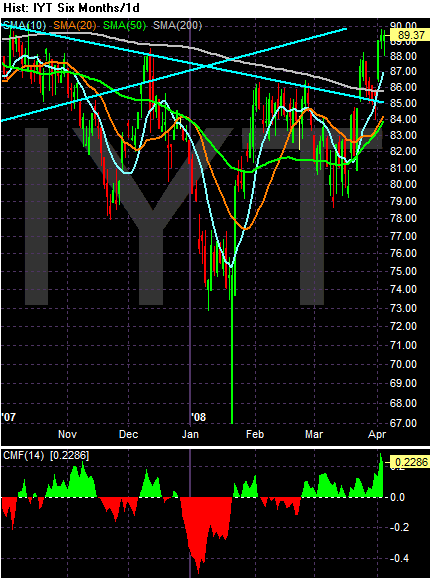
The is a chart that originally led me to concern about the overall health of the markets. Notice the transports broke the long-term trend line last year, but have since risen to that line again.
A key will be what happens when prices hit the line. A move through will indicate strength while a move away (bouncing off of) will indicate weakness.
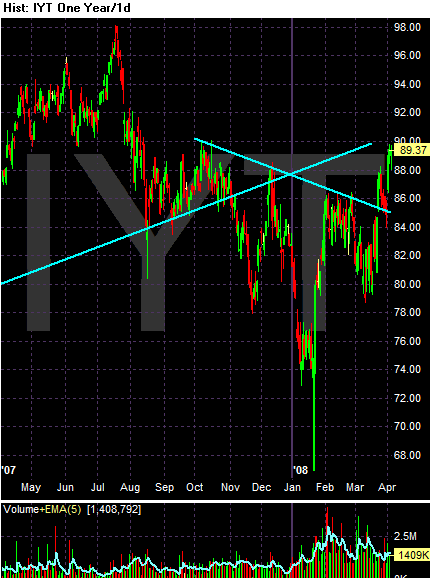
This is a closer look at the one year chart, which gives us a better idea where prices are in relation to the long term trend line.
Here's another interesting point: Notice the head and shoulders reversal pattern and the fact that prices have moved from this pattern to a higher point.
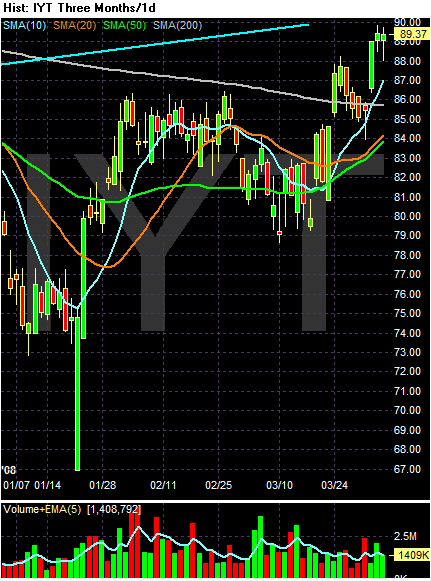
On the simple moving average chart, notice the following:
-- The 10 day SMA is above the 20, which is above the 50 -- a bullish orientation.
-- The 10, 20 and 50 day SMAs are all moving higher.
-- Prices have crossed the 200 day SMA
-- Prices are above all the SMAs
-- The main drawback to this rally is the lack of volume. Note the 10 day SMA of volume hasn't risen significantly.
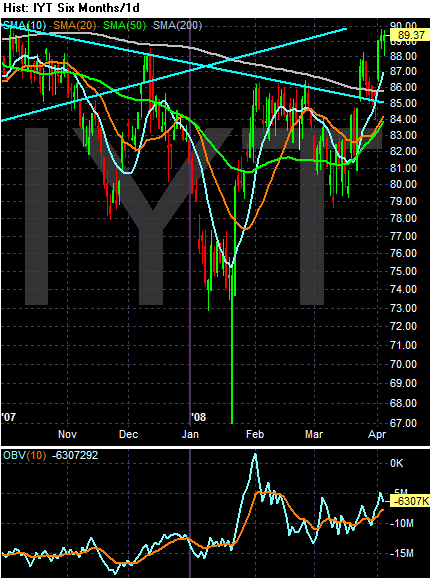
OBV is up a bit, and
The Chaikin Money Flow has a nice spike.
So, a majority of the technicals are bullish with the exception of volume. And the underlying story to volume is it's a mixed bag. And then there are stories like this:
My guess is there are two inter-related thoughts here.
1.) Transport companies are increasing prices faster than their fuel surcharges. This will increase profits.
2.) The bankruptcies are increasing pricing power of the remaining companies.
I think there is also continued hope for a merger in the major airlines.
Finally, we've seen a stronger government response over the last month or so. The Federal Reserve has provided a back-stop to the investment banking community with their aid on the Bear Stearns deal. We're also seeing Congress more involved as well. Both of these factors could help to mitigate the downside pain from a slowdown.
The big issue is a rally above the previous long-term support line. And remember the move through that doesn't have to happen on the first time. So keep your eyes open.
Let's look at the averages to see what's going on.
The is a chart that originally led me to concern about the overall health of the markets. Notice the transports broke the long-term trend line last year, but have since risen to that line again.
A key will be what happens when prices hit the line. A move through will indicate strength while a move away (bouncing off of) will indicate weakness.
This is a closer look at the one year chart, which gives us a better idea where prices are in relation to the long term trend line.
Here's another interesting point: Notice the head and shoulders reversal pattern and the fact that prices have moved from this pattern to a higher point.
On the simple moving average chart, notice the following:
-- The 10 day SMA is above the 20, which is above the 50 -- a bullish orientation.
-- The 10, 20 and 50 day SMAs are all moving higher.
-- Prices have crossed the 200 day SMA
-- Prices are above all the SMAs
-- The main drawback to this rally is the lack of volume. Note the 10 day SMA of volume hasn't risen significantly.
OBV is up a bit, and
The Chaikin Money Flow has a nice spike.
So, a majority of the technicals are bullish with the exception of volume. And the underlying story to volume is it's a mixed bag. And then there are stories like this:
Struggling to cope with record oil prices and a weakening economy, Northwest Airlines Corp. said it will raise fares, fuel surcharges and baggage fees and cut its domestic flight schedule by 5%.
The move is the latest by a major carrier to trim service and pile extra fees on customers as relentless growth in the cost of fuel threatens the industry's attempt to put a half-decade slump and a round of bankruptcies behind it.
Northwest also said it has suspended plans to hire more pilots and flight attendants and will cut capital spending that doesn't involve airlines by about $100 million this year, to $150 million. Employees' pay won't be cut, and any job losses will happen through attrition if possible.
"Over the past several months, the price of oil has risen dramatically to all-time highs and there is no reasonable basis to conclude that oil prices will materially decline anytime soon," Chief Executive Doug Steenland said. "These increased costs are significant and call for a strong response from us."
.....
This week, three airlines have announced they would close: ATA Airlines Inc., Aloha Airgroup Inc. and Champion Air.
My guess is there are two inter-related thoughts here.
1.) Transport companies are increasing prices faster than their fuel surcharges. This will increase profits.
2.) The bankruptcies are increasing pricing power of the remaining companies.
I think there is also continued hope for a merger in the major airlines.
Finally, we've seen a stronger government response over the last month or so. The Federal Reserve has provided a back-stop to the investment banking community with their aid on the Bear Stearns deal. We're also seeing Congress more involved as well. Both of these factors could help to mitigate the downside pain from a slowdown.
The big issue is a rally above the previous long-term support line. And remember the move through that doesn't have to happen on the first time. So keep your eyes open.
What Inflation?
From Bloomberg:
The tug of war between commodities bulls and bears continues, with the bulls winning.
Notice the use of the phrase "anti-hoarding campaign" and "food riots." We're no longer in a hypothetical "what if this happens" world. We're in a harsh reality that is impacting people's lives in a very negative way.
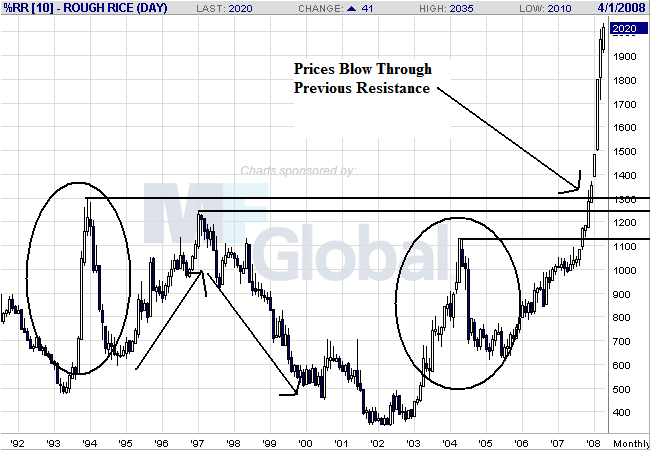
And here's a chart of rice
Notice the following:
-- All the simple moving averages are moving higher
-- The shorter SMAs are above the longer SMA
-- Prices are above all the SMA
-- Prices have continually consolidated and moved higher
-- Prices have continually broken through previous resistance
On the monthly chart, notice the following:
-- Prices are are all-time highs by a wide margin
-- Rice has had three other price spikes over the last 15 years, all of which were temporary
-- At the end of 1993 and at the beginning of 2004 there were large price spikes, followed by sell-offs. Both lasted about a year, with the 1993 spike having an equal amount of time of build-up and sell-off which the 2004 spike had a longer build-up and faster sell-off
-- There was a longer build-up from 1005-1997 followed by a gentler decline from 1997 - 1999.
The point of looking at the weekly chart is to demonstrate rice is a pretty volatile market that has been through ups and downs in the past 15 years. Rise is a staple of the Asian diet and the Asian region has grown over the last 15 years at strong rates. Putting these two facts together you get natural ebbs and flows in the price cycle.
India's inflation accelerated at the fastest pace in more than three years in the week ended March 22. Philippine inflation quickened at the fastest pace in 20 months in March. Consumer prices gained 8.7 percent in February in China, an 11-year high. Food prices in the country, based on a government index, jumped 28 percent in February, the most since July.
The tug of war between commodities bulls and bears continues, with the bulls winning.
Thailand, the world's biggest rice exporter, pledged to maintain supplies and India vowed to crack down on hoarding as shortages drove prices to a record and threatened to trigger protests in Asia and Africa.
The nation ``has enough rice for export to neighboring countries'' and may be able to deliver as much as 1.2 million tons a month, Prasert Gosalvitra, head of the rice division of the farm ministry, said today in Bangkok. Thailand has shipped about 1.1 million tons a month since October, he said.
Rice, the staple food for about 3 billion people, gained 1 percent to its highest ever in Chicago today after doubling in the past year. Higher imports by the Philippines, the biggest buyer, and export cuts by China, India, Egypt and Vietnam pushed up prices, contributing to food riots in Ivory Coast and anti- hoarding campaigns in Pakistan and the Philippines.
``We expect a significant rise in prices, well above the long-term average, in the short-to-medium term,'' Les Gordon, president of the Rice Growers Association of Australia, said today. Population growth, urban encroachment on land, and rising grain prices are contributing to the increase.
Notice the use of the phrase "anti-hoarding campaign" and "food riots." We're no longer in a hypothetical "what if this happens" world. We're in a harsh reality that is impacting people's lives in a very negative way.
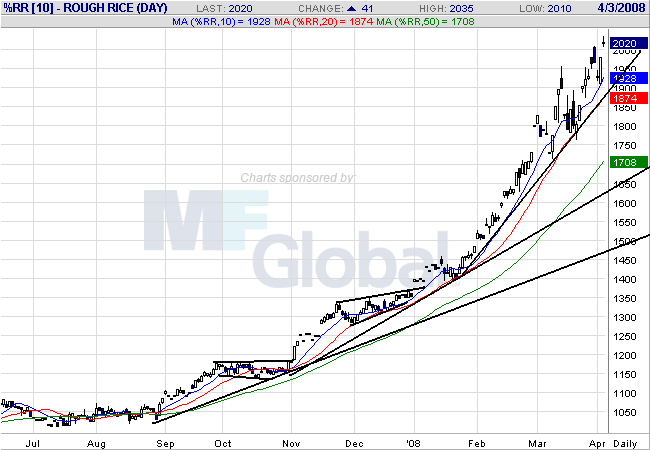
And here's a chart of rice
Notice the following:
-- All the simple moving averages are moving higher
-- The shorter SMAs are above the longer SMA
-- Prices are above all the SMA
-- Prices have continually consolidated and moved higher
-- Prices have continually broken through previous resistance
On the monthly chart, notice the following:
-- Prices are are all-time highs by a wide margin
-- Rice has had three other price spikes over the last 15 years, all of which were temporary
-- At the end of 1993 and at the beginning of 2004 there were large price spikes, followed by sell-offs. Both lasted about a year, with the 1993 spike having an equal amount of time of build-up and sell-off which the 2004 spike had a longer build-up and faster sell-off
-- There was a longer build-up from 1005-1997 followed by a gentler decline from 1997 - 1999.
The point of looking at the weekly chart is to demonstrate rice is a pretty volatile market that has been through ups and downs in the past 15 years. Rise is a staple of the Asian diet and the Asian region has grown over the last 15 years at strong rates. Putting these two facts together you get natural ebbs and flows in the price cycle.
Thursday, April 3, 2008
Today's Markets
Not a good day for economic news. Although the heads of JPM and the NY Fed came out swinging to defend the Fed's help with the Bear Stearns deal it still reminds people the fifth largest investment bank was a breath away from bankruptcy. In addition, jobless claims spiked to a tw year high -- even Google is laying people off. Not only did Bernanke use the "R" word recently, even the Treasury Secretary is saying it may not be a great quarter. And we also learned that consumer's late payments are at the highest level since 1992. But we did learn that Lehman underwrote it's own CLO (dubbed freedom) to help it deal with a ton of loans on the books.
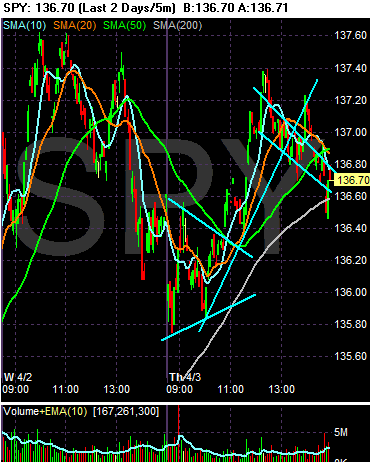
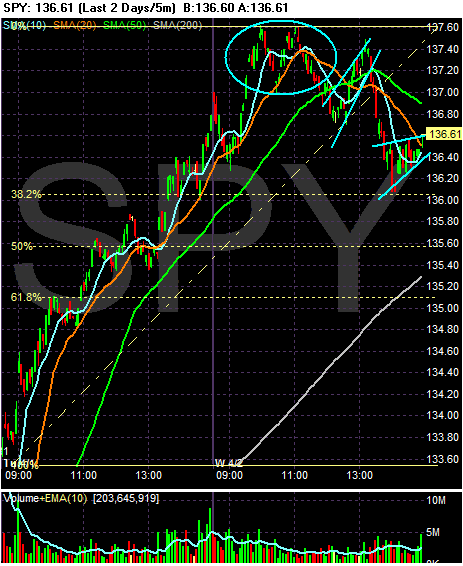
The SPYs dropped at the beginning, but formed a triangle base. The broke the upper resistance and moved through the 50 SMA, rallying until a bit after lunch. Then the market traded in a downward sloping pennant formation until the close. Prices did bounce off the 200 SMA at the end of trading.
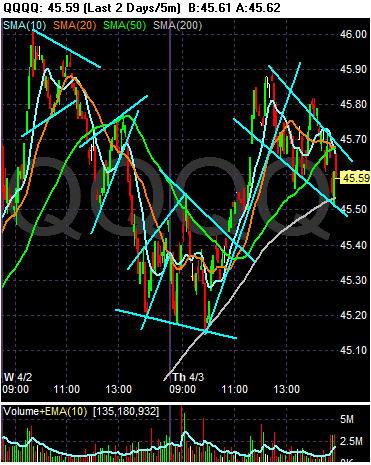
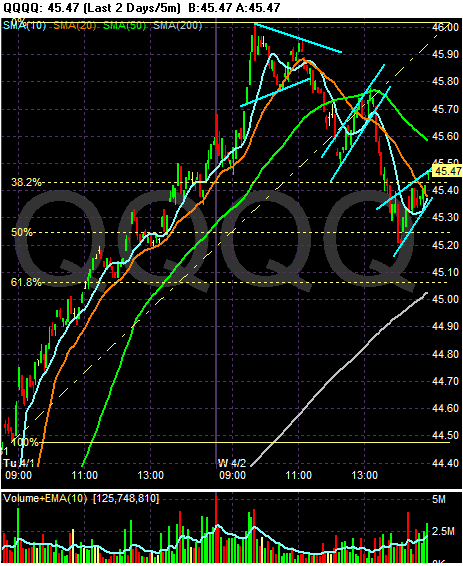
The QQQQs formed a triangle starting at the end of yesterday, then rallied hard until they also formed a pennant formation. Note they also bounced off the 200 SMA.
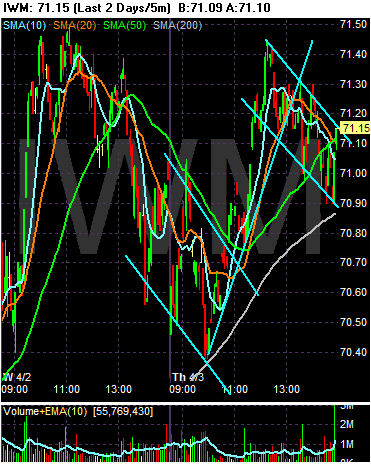
The IWMs were in a downward sloping pennant pattern from yesterday, but broke higher with the other two averages. They traded down for the rest of the day, but notice the high volume spike on the last 5-minute bar.
Translating "Fedspeak" or, Everything You Wanted to Know About the Economy But Were Afraid to Ask
Yesterday, Bernanke testified on capital hill. His testimony, which is available on the Federal Reserve's website, offers a good overview of how the Fed views the economy.
It's also important to remember the Fed is as much a political player as it is an economic player. While a completely honest Fed would be great it is not going to happen. The Fed has to help manage the public's economic expectations. As such, it has to ease the public into a certain economic frame of reference. This is why yesterday was the first time we heard the Fed use the word "recession". The Fed has been aware of the economic situation for some time. But if they had come out and said "we're in a recession and it's really going to suck" they would have induced panic.
Here are the relevant portions of his testimony along with commentary.
This set of paragraphs outlines the central problem faced by the markets, so let's take it slowly to see what is happening.
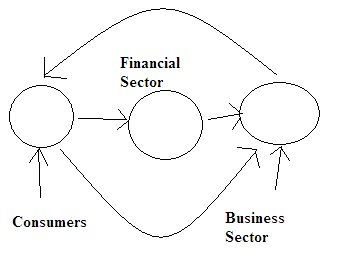
Let's start with this basic picture of the US economy.
The financial system stands at the center of the US economy; it takes savings from the public, pools it, and then lends it to business. It also stands between businesses because the financial system provides credit to buy literally everything in the economy. In other words, without a ready source of rapidly available credit the US economy drags to a halt.
And that's where the real rub comes in. For the last 9 months we have heard a continuing drum beat of news from the financial sector that banks are "writing down" the value of assets. The reason why this is so detrimental is the US financial system uses a "fractional reserve" banking system. All this means is a bank can loan out a certain percentage of its assets. For example -- and purely hypothetically -- if a bank has $1 million dollars in assets it could make loans of say $5 million. But as the bank's total assets decrease from a bunch of writedowns the bank's ability to make loans decreases. And that's where the bug problem comes in.
All of these writedwons we've been hearing about have the following negative impact.
-- Because of the just discussed fractional reserve system, the ability of banks to make loans is seriously compromised. As a result, there are fewer loans available.
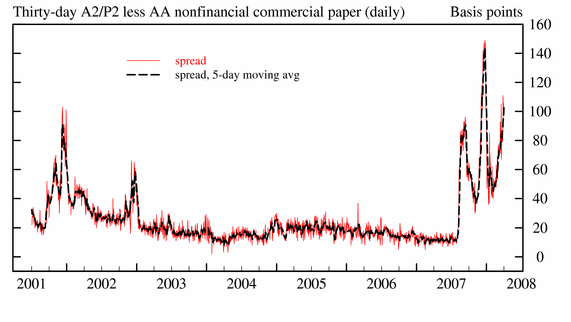
-- Because of the breadth of the writedown news (literally everyone and their brother has announced problems) banks are unwilling to lend to each other. Why? Because even in the short-term market of commercial paper (which has a maximum maturity of 270 days) the possibility of the borrower announcing they have to writedown the value of their assets is high. This means the possibility of a borrower saying "we can't repay the loan" is much higher, leading to a drop in the total amount of loans being made. It also means the cost of short-term funding is increasing. Here is a chart of the commercial paper spreads from the Federal Reserve
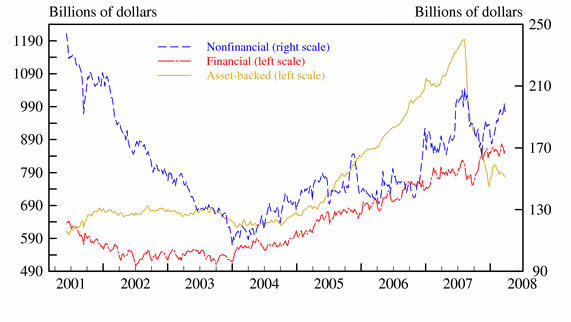
Those spikes indicate risk is increasing. Here is a chart of total commercial paper outstanding. Pay attention to the yellow line
There's been a huge drop in the amount of commercial paper outstanding.
Putting all of these factors together we get a very disturbing picture. Because of all the writedowns in the financial sector the ability of financial players to make loans is seriously hampered. In addition, because of the increased fear of borrowers announcing they have writedowns to make, there are fewer short-term loans being written. As a result, the amount of short-term credit is decreasing and the cost of making these loans is increasing. This slows the US economy.
I've written about why the housing market is nowhere near bottom. Short version: there's a ton of supply combined with an already massively indebted US consumer decreasing demand. Let's not forget tightening credit markets limiting credit. The only way for this imbalance to be cured is for prices to drop hard.
Here are the relevant charts:
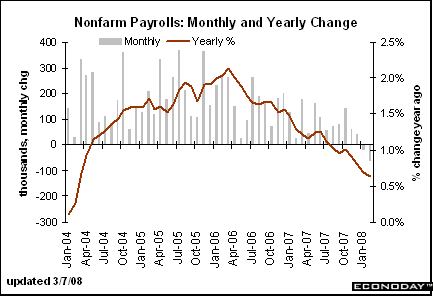
The year-over-year change in payroll growth has been slowing substantially and is now in negative territory.
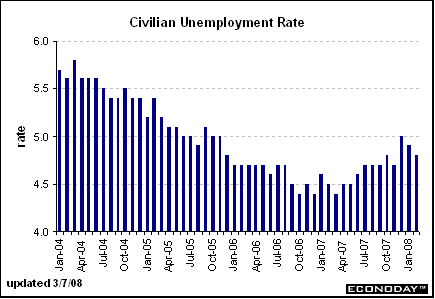
The unemployment rate is ticking up.
Short version: the job market is in terrible shape.
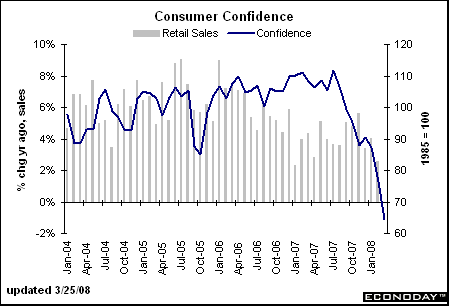
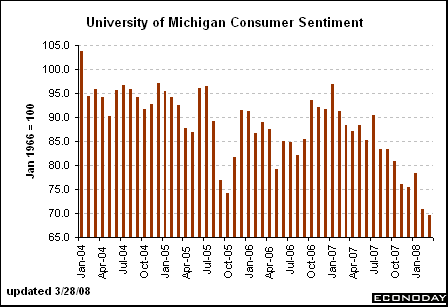
This is leading to declining consumer confidence and sentiment:
Which will further lower spending.
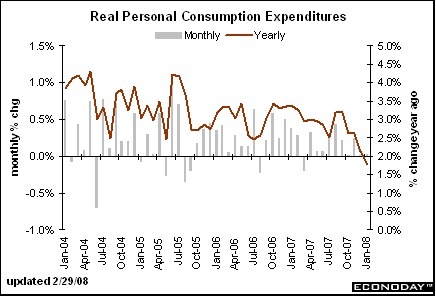
Here are the relevant charts:
Remember the decreasing employment from above? That is leading to
Dropping income. When consumer's have less money to spend
Real (inflation-adjusted) personal consumption expenditures are decreasing.
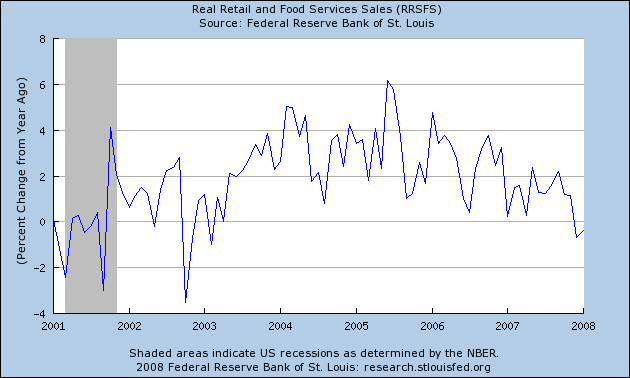
It also means that real (inflation-adjusted) retail sales are decreasing on a year-over-year basis.
Because consumers are cutting back on spending, businesses are cutting back on investment.
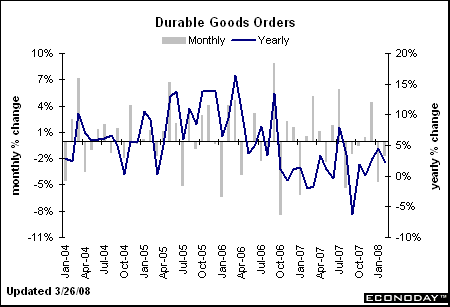
Durable goods year-over-year change has been negative for some time.
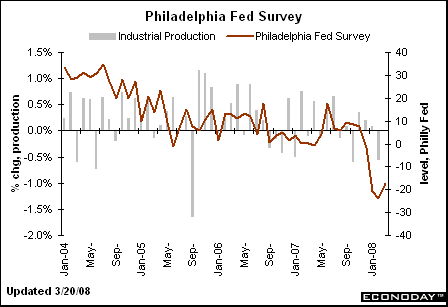
But the Philadelphia Fed survey is clearly weaker.
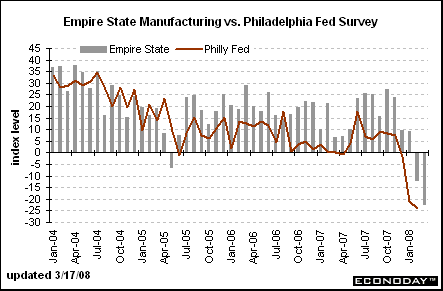
As is the empire state (New York) index.
Let's review:
-- There are big problems in the credit markets that aren't going away anytime soon.
-- Housing is still a mess.
-- Employment growth is decreasing
-- Real Disposable income is decreasing, leading to
-- Decreasing consumer spending, leading to
-- Lower business investment.
It's also important to remember the Fed is as much a political player as it is an economic player. While a completely honest Fed would be great it is not going to happen. The Fed has to help manage the public's economic expectations. As such, it has to ease the public into a certain economic frame of reference. This is why yesterday was the first time we heard the Fed use the word "recession". The Fed has been aware of the economic situation for some time. But if they had come out and said "we're in a recession and it's really going to suck" they would have induced panic.
Here are the relevant portions of his testimony along with commentary.
Although our recent actions appear to have helped stabilize the situation somewhat, financial markets remain under considerable stress. Pressures in short-term bank funding markets, which had abated somewhat beginning late last year, have increased once again. Many lenders have been reluctant to provide credit to counterparties, especially leveraged investors, and have increased the amount of collateral they require to back short-term security financing agreements. To meet those demands, investors have reduced their leverage and liquidated holdings of securities, putting further downward pressure on security prices.
Credit availability has also been restricted because some large financial institutions, including some commercial and investment banks and the government-sponsored enterprises (GSEs), have reported substantial losses and writedowns, reducing their available capital. Several of these firms have been able to raise fresh capital to offset at least some of those losses, and others are in the process of doing so. However, financial institutions’ balance sheets have also expanded, as banks and other institutions have taken on their balance sheets various assets that can no longer be financed on a standalone basis. Thus, the capacity and willingness of some large institutions to extend new credit remains limited.
The effects of the financial strains on credit cost and availability have become increasingly evident, with some portions of the system that had previously escaped the worst of the turmoil--such as the markets for municipal bonds and student loans--having been affected. Another market that had previously been largely exempt from disruptions was that for mortgage-backed securities (MBS) issued by government agencies. However, beginning in mid-February, worsening liquidity conditions and reports of losses at the GSEs, Fannie Mae and Freddie Mac, caused the spread of agency MBS yields over the yields on comparable Treasury securities to rise sharply. Together with the increased fees imposed by the GSEs, the rise in this spread resulted in higher interest rates on conforming mortgages. More recently, agency MBS spreads and conforming mortgage rates have retraced part of this increase, and conforming mortgages continue to be readily available to households. However, for the most part, the nonconforming segment of the mortgage market continues to function poorly.
In corporate debt markets, yields and spreads on both investment-grade and speculative-grade corporate bonds rose through mid-March before falling more recently. Issuance of investment-grade bonds by both financial and nonfinancial corporations has been quite robust so far this year, but issuance of new high-yield debt has stalled. Strains continue to be evident in the commercial paper market as well, where risk spreads remain elevated and the quantity of commercial paper outstanding, particularly asset-backed paper, has decreased. Commercial and industrial loans at banks grew in January and February, but at a considerably slower pace than in previous months.
This set of paragraphs outlines the central problem faced by the markets, so let's take it slowly to see what is happening.
Let's start with this basic picture of the US economy.
The financial system stands at the center of the US economy; it takes savings from the public, pools it, and then lends it to business. It also stands between businesses because the financial system provides credit to buy literally everything in the economy. In other words, without a ready source of rapidly available credit the US economy drags to a halt.
And that's where the real rub comes in. For the last 9 months we have heard a continuing drum beat of news from the financial sector that banks are "writing down" the value of assets. The reason why this is so detrimental is the US financial system uses a "fractional reserve" banking system. All this means is a bank can loan out a certain percentage of its assets. For example -- and purely hypothetically -- if a bank has $1 million dollars in assets it could make loans of say $5 million. But as the bank's total assets decrease from a bunch of writedowns the bank's ability to make loans decreases. And that's where the bug problem comes in.
All of these writedwons we've been hearing about have the following negative impact.
-- Because of the just discussed fractional reserve system, the ability of banks to make loans is seriously compromised. As a result, there are fewer loans available.
-- Because of the breadth of the writedown news (literally everyone and their brother has announced problems) banks are unwilling to lend to each other. Why? Because even in the short-term market of commercial paper (which has a maximum maturity of 270 days) the possibility of the borrower announcing they have to writedown the value of their assets is high. This means the possibility of a borrower saying "we can't repay the loan" is much higher, leading to a drop in the total amount of loans being made. It also means the cost of short-term funding is increasing. Here is a chart of the commercial paper spreads from the Federal Reserve
Those spikes indicate risk is increasing. Here is a chart of total commercial paper outstanding. Pay attention to the yellow line
There's been a huge drop in the amount of commercial paper outstanding.
Putting all of these factors together we get a very disturbing picture. Because of all the writedowns in the financial sector the ability of financial players to make loans is seriously hampered. In addition, because of the increased fear of borrowers announcing they have writedowns to make, there are fewer short-term loans being written. As a result, the amount of short-term credit is decreasing and the cost of making these loans is increasing. This slows the US economy.
Notably, in the housing market, sales of both new and existing homes have generally continued weak, partly as a result of the reduced availability of mortgage credit, and home prices have continued to fall.1 Starts of new single-family homes declined an additional 7 percent in February, bringing the cumulative decline since the early 2006 peak in single-family starts to more than 60 percent. Residential construction is likely to contract somewhat further in coming quarters as builders try to reduce their high inventories of unsold new homes.
I've written about why the housing market is nowhere near bottom. Short version: there's a ton of supply combined with an already massively indebted US consumer decreasing demand. Let's not forget tightening credit markets limiting credit. The only way for this imbalance to be cured is for prices to drop hard.
Private payroll employment fell 101,000 in February, after two months of smaller job losses, with job cuts in construction and closely related industries accounting for a significant share of the decline. But the demand for labor has also moderated recently in other industries, such as business services and retail trade, and manufacturing employment has continued on its downward trend. Meanwhile, claims for unemployment insurance have risen somewhat on balance, and surveys indicate that employers have scaled back hiring plans and that jobseekers are experiencing greater difficulties finding work. The unemployment rate edged down in February and remains at a relatively low level; however, in light of the sluggishness of economic activity and other indicators of a softer labor market, I expect it to move somewhat higher in coming months
Here are the relevant charts:
The year-over-year change in payroll growth has been slowing substantially and is now in negative territory.
The unemployment rate is ticking up.
Short version: the job market is in terrible shape.
This is leading to declining consumer confidence and sentiment:
Which will further lower spending.
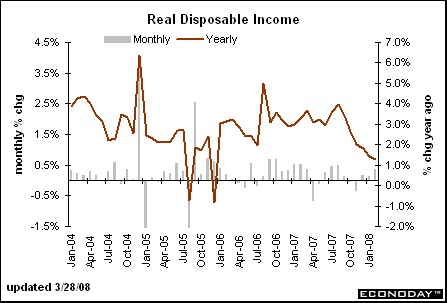
After rising at an annual rate of about 3 percent over the first three quarters of last year, real disposable income has since increased at only about a 1 percent annual rate, reflecting weaker employment conditions and higher prices for energy and food. Concerns about employment and income prospects, together with declining home values and tighter credit conditions, have caused consumer spending to decelerate considerably from the solid pace seen during the first three quarters of last year. I expect the tax rebates associated with the fiscal stimulus package recently passed by the Congress to provide some support to consumer spending in coming quarters.
Here are the relevant charts:
Remember the decreasing employment from above? That is leading to
Dropping income. When consumer's have less money to spend
Real (inflation-adjusted) personal consumption expenditures are decreasing.
It also means that real (inflation-adjusted) retail sales are decreasing on a year-over-year basis.
In the business sector, the pullback in hiring that I noted earlier has been accompanied by some reduction in capital spending plans, as weaker sales prospects, tighter credit, and heightened uncertainty have made business leaders more cautious. On a more positive note, the nonfinancial business sector remains financially sound, with liquid balance sheets and low leverage ratios, and most firms have been able to avoid unwanted buildups in inventories. In addition, many businesses are enjoying strong demand from abroad. Although the prospects for foreign economic growth have diminished somewhat in recent months, net exports should continue to provide considerable support to U.S. economic activity in coming quarters.
Because consumers are cutting back on spending, businesses are cutting back on investment.
Durable goods year-over-year change has been negative for some time.
But the Philadelphia Fed survey is clearly weaker.
As is the empire state (New York) index.
Let's review:
-- There are big problems in the credit markets that aren't going away anytime soon.
-- Housing is still a mess.
-- Employment growth is decreasing
-- Real Disposable income is decreasing, leading to
-- Decreasing consumer spending, leading to
-- Lower business investment.
Wednesday, April 2, 2008
Today's Markets
The markets sold off today, probably for a few reasons. First, Bernanke said there is a possibility of a recession. Crude oil spiked. I also think there was a simple round of profit taking after yesterday's run. There was also the realization that the credit crunch is far from over despite Lehman's ability to raise new capital. There was also the news that Bear Stearns was close to Chapter 11 which isn't good to hear given the current credit market environment. Finally, we get employment on Friday and I think traders are concerned about that number.
The SPYs formed a double top by mid-morning (which is circled). After that they sold off. There were two bear market pennant patterns where traders tried to rally the market to no avail. Also notice that prices sold-off to the 38.2% Fibonacci retracement level from yesterday's run.
Depending on who you ask, the QQQQs formed a double top or a triangle top. I think it's a triangle top, but that's a judgment call. Like the SPYs, the QQQQs sold off, but this time to the 50% retracement level. Also note the sell off went to the 50% retracement level.
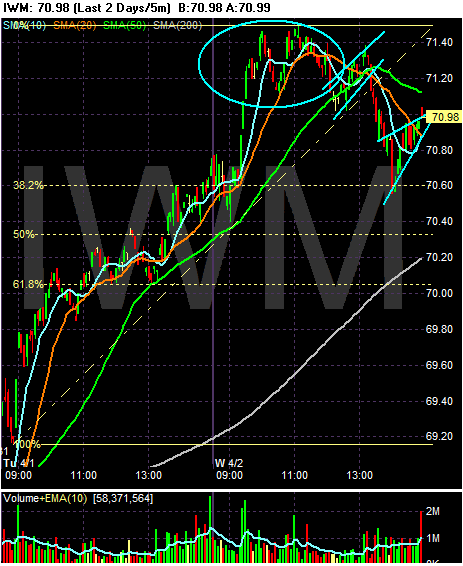
With the IWMs we get a double top and a move to the 38.2% retracement level.
A Closer Look at the QQQQs
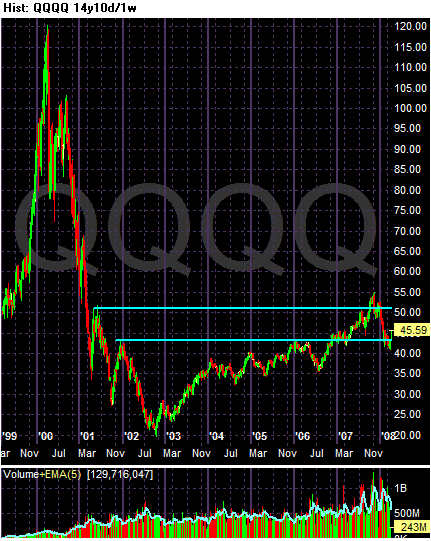
Continuing with an in-depth look at the averages, here is a look at the NASDAQ 100
On the 14 year chart, notice how far below the late 2000s tech rally the current prices are -- and this is after 5 years worth of increases. I included this chart to show how far out of whack the the late 2000s bull market was -- and how fast and hard it fell (not that home prices will do the same thing.....)
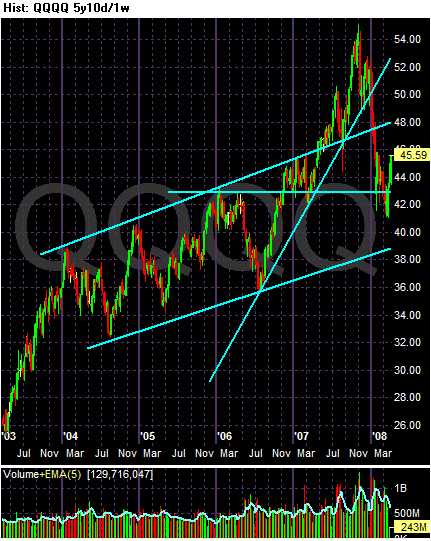
On the 5 year chart, notice the following:
-- There were two trends in place. The first was an upward sloping channel that started early 2004 and a second a sharper rally that started in mid-2006.
-- Prices have broken through two important trend lines -- the upper trend line of the 2004 rally and the sharper upward sloping trend line started in mid 2006.
-- The lower trend line of the rally that started in early 2004 remains intact.
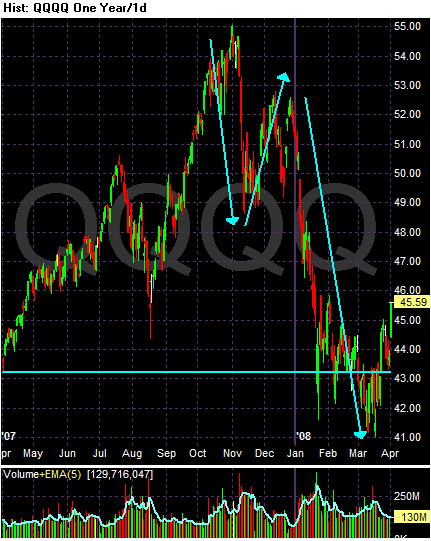
On the yearly chart, notice:
-- Prices have formed a clear downward sloping trend with a clear down, up, down pattern. Also notice that prices are forming lower lows and lower highs.
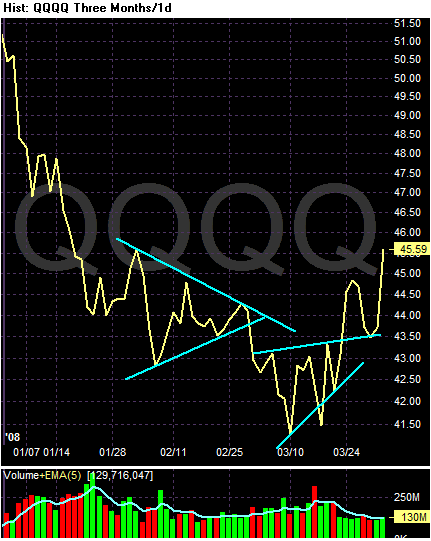
On the three month line chart, notice the following:
-- I used a line graph to clear out the noise.
-- We have two consolidation patterns.
-- Also note how round numbers (41.50, 43, and 43.50) are offering strong support for the index. This is probably the result of program trading.
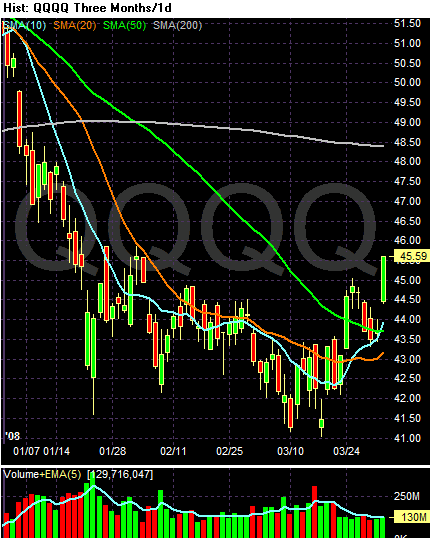
On the three month simple moving average (SMA) chart, notice the following:
-- The 10 day SMA has broken through the 50 day SMA
-- The 20 day SMA is currently neutral. Given the markets action of late this index will turn positive within the next two weeks.
-- Prices are above the 50 day SMA.
Conclusion: The QQQQs could be turning around, at least from a technical perspective. Prices have moved above important technical support lines and there is little upward resistance.
Commodities Update
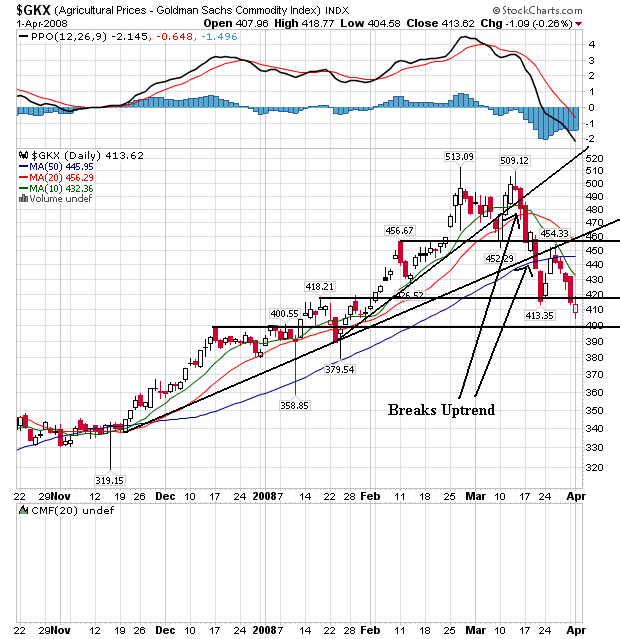
The commodities markets are correcting right now, which means my concern about agricultural and energy based inflation my be easing. Let's take a look at the charts to see what they say.
On the daily agricultural price chart, notice the following:
-- Prices have broken through two support levels
-- Prices have broken through two upward sloping trend lines.
-- The 10 day simple moving average (SMA) has moved through the 50 day SMA
-- The 10 and 20 day SMA are both heading lower
-- Prices are now below the 50 day SMA
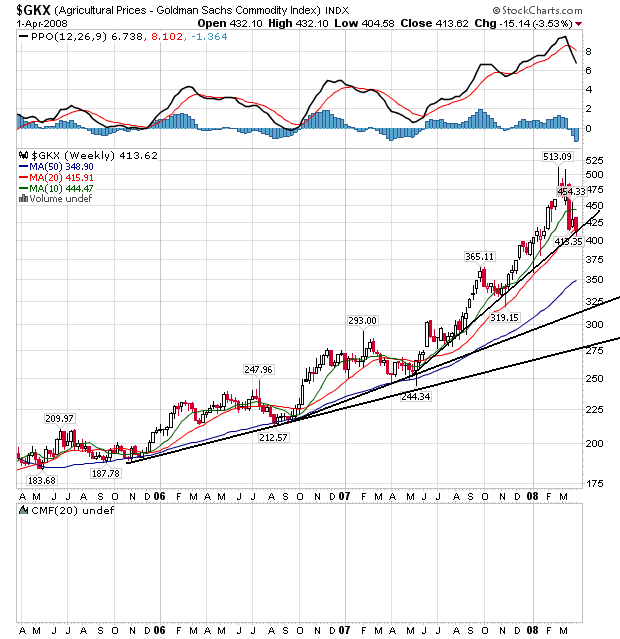
On the weekly agricultural price chart, notice that
-- Prices are at a crucial technical level. While they are still technically in an uptrend a move through this level will indicate a break of the trend.
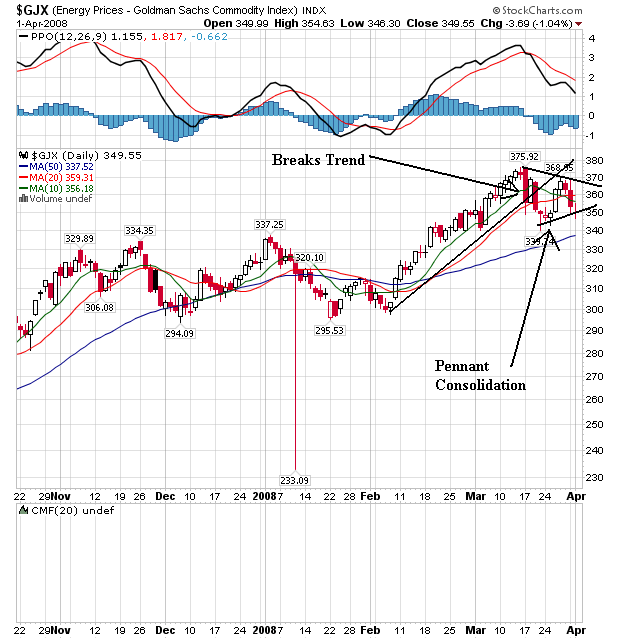
On the daily energy price chart, notice the following:
-- Prices broke the trend line started in early February
-- Prices are consolidating in a triangle pattern right now
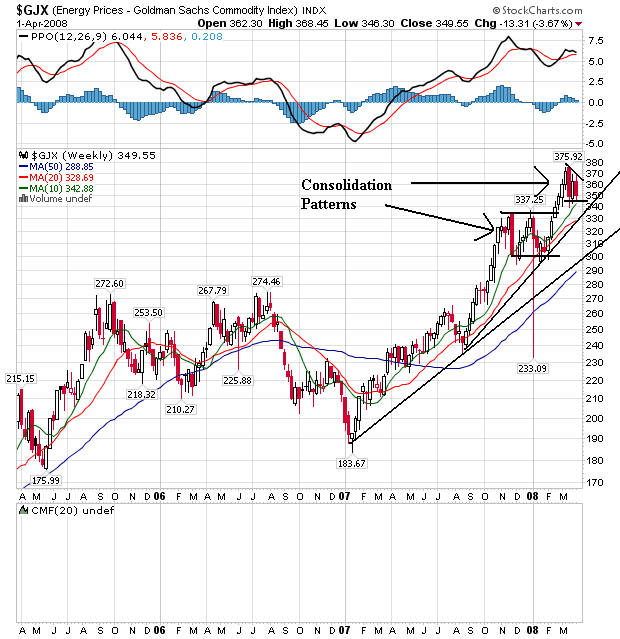
On the weekly energy price chart, notice the following:
-- Prices are still in an uptrend that started at the beginning of 2007
-- Prices are currently consolidating in a triangle consolidation pattern.
Tuesday, April 1, 2008
Today's Markets
So -- why was the market rallying today? I think Briefing.com summed it up best:
There are also some other points to consider. First, this is the beginning of the second quarter, so managers are putting money to work. There is also talk of a Federal bail-out of the mortgage market that might be boosting sentiment. The ISM number came in better than expected (although it was still below 50 indicating we're in a contraction) which may have helped as well.
But I have to wonder about the fundamental backdrop. I think it's possible the Fed has removed downside risk from the market by allowing a broader group of firms to borrow at the discount window. But that doesn't mean things are rosy either. Construction spending was terrible. Lehman had to raise cash, UBS said it has massive writedowns (as does Deutsche Bank) and car sales were terrible. All in all, things just aren't that great which leads me to question the long term viability of this rally. I should add -- I've been wrong before.
I'm going to use the daily charts because they really illustrate the market's overall situation better right now.
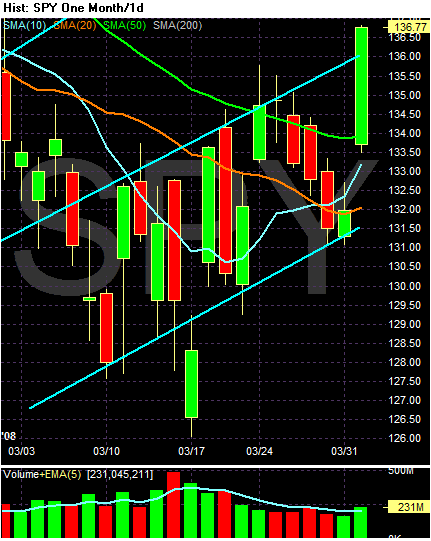
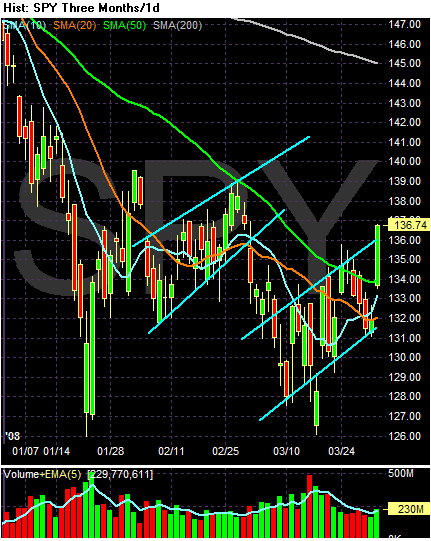
On the SPYs, notice the formation of two bear market flags. Also notice that today's price action takes prices above the upper trend line for on of those flag patterns. Finally, notice the SPYs could be forming a double bottom with the first occurring mid-January and the second occurring in mid-March.
Above is just a closer look at the indexes move today.
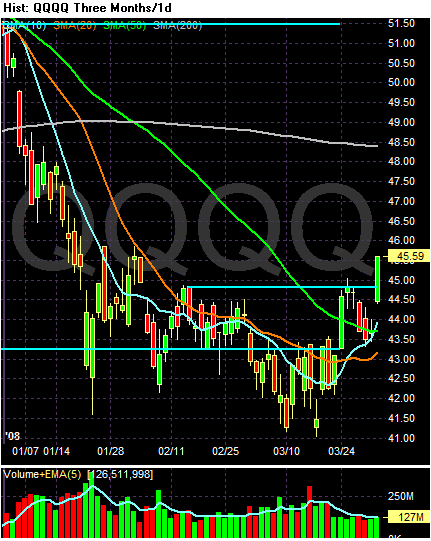
The QQQQs offer the most positive chart. Notice the following:
-- Prices have moved through resistance levels with a great deal of strength.
-- The 10 day SMA crossed the 50 day SMA and is moving higher.
-- The 20 day SMA is about to cross the 50 day SMA and is about to turn positive.
-- Prices bounced off the 10 day SMA and moved higher.
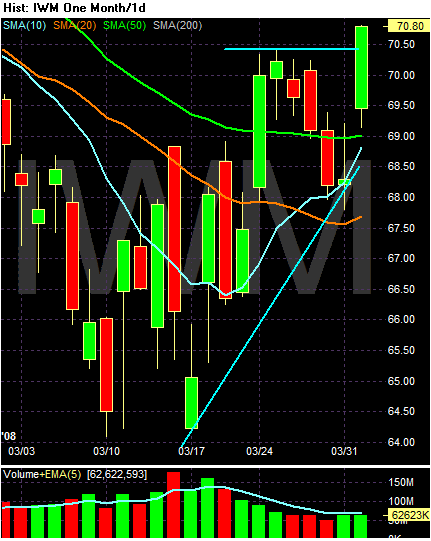
Above is a month-long look at the IWMs. Notice the following:
-- The 50 day SMA has smoothed out.
-- The 10 day SMA is about to move through the 50 day SMA
-- Prices have moved through all the SMAs
-- Prices are in a clear uptrend
The mostly negative news has caused a surge of buying interest, with the thrifts & mortgages (+8.7%), diversified financials (+7.0%), and consumer finance (+6.7%) groups posting steep gains. However, there were similar rallies on negative news as early as October on hopes that the worst of the subprime mess was over--which clearly was not the case. Whether this really ends up being the turning point remains to be seen, but as of now there is a bullish bias prevalent within the market.
There are also some other points to consider. First, this is the beginning of the second quarter, so managers are putting money to work. There is also talk of a Federal bail-out of the mortgage market that might be boosting sentiment. The ISM number came in better than expected (although it was still below 50 indicating we're in a contraction) which may have helped as well.
But I have to wonder about the fundamental backdrop. I think it's possible the Fed has removed downside risk from the market by allowing a broader group of firms to borrow at the discount window. But that doesn't mean things are rosy either. Construction spending was terrible. Lehman had to raise cash, UBS said it has massive writedowns (as does Deutsche Bank) and car sales were terrible. All in all, things just aren't that great which leads me to question the long term viability of this rally. I should add -- I've been wrong before.
I'm going to use the daily charts because they really illustrate the market's overall situation better right now.
On the SPYs, notice the formation of two bear market flags. Also notice that today's price action takes prices above the upper trend line for on of those flag patterns. Finally, notice the SPYs could be forming a double bottom with the first occurring mid-January and the second occurring in mid-March.
Above is just a closer look at the indexes move today.
The QQQQs offer the most positive chart. Notice the following:
-- Prices have moved through resistance levels with a great deal of strength.
-- The 10 day SMA crossed the 50 day SMA and is moving higher.
-- The 20 day SMA is about to cross the 50 day SMA and is about to turn positive.
-- Prices bounced off the 10 day SMA and moved higher.
Above is a month-long look at the IWMs. Notice the following:
-- The 50 day SMA has smoothed out.
-- The 10 day SMA is about to move through the 50 day SMA
-- Prices have moved through all the SMAs
-- Prices are in a clear uptrend
More Signs of Strength at UBS
As I write this the market is rallying hard. Go figure. Up is down, left is right, East is West. Here is another sign of how strong the economy is -- especially the financial sector:
More investment-banking jobs will have to go at UBS in light of another $19 billion in write-downs that the Swiss banking giant will take, the company's chief executive said Tuesday.
Fresh cuts will come on top of the 1,500 job losses that UBS announced in October. They'll likely be focused on the fixed-income side of the company's business, where other firms have also been shedding jobs in recent months.
"The environment is tough, and we will have to review our capacity," said CEO Marcel Rohner on a conference call with analysts.
The Financialization of the US Economy
Over at the Huffington Post, Kevin Phillips has a great piece that shows the length, width and depth of finance in the US economy. Consider the following:
One of the main topics I have written about over the last few years is the incredible amount of debt build-up that has occurred in the US economy. Whether it's the over $9 trillion total of US government debt (roughly 64% of US GDP) or the mammoth increase in household debt (which is almost as much as total US GDP and over 130% of disposable income at the national level) we're literally swimming in red ink in this country.
The main problem I have with this development is a basic fact of debt: you have to pay it back. Here's why that's an issue.
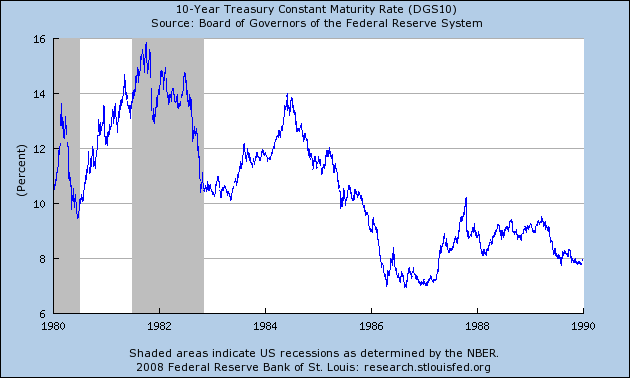
For the 4Q82 to 3Q90 expansion the median quarterly growth rate was 3.85%. Here's a chart of the 10-year Treasuries yield over the same time:
Notice at best the Federal government was paying 7% for 3.85% economic growth. That just makes no sense. But everyone is acting as though the Federal debt is no big deal.
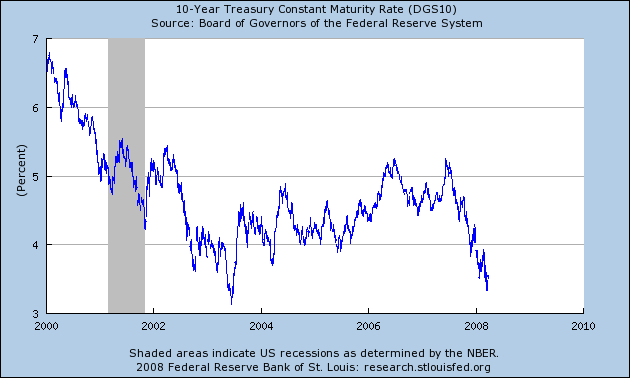
Over the latest expansion (4Q01 to present) we've seen a 2.7% median quarterly growth rate. Over the same time the US has added a little over $3 trillion to the total national debt. And here's a chart of the interest rate on the 10-year Treasury:
Notice we're still paying more interest than our total growth rate.
Here's the point (and I made this above as well). You have to pay back debt at some point. Yes, you can refinance it etc.... but that doesn't eliminate the basic problem -- you still owe the money. And at some point, that's going to bite is hard.
Over the last five years, financial services has reached a swollen 20-21% of U.S. GDP -- the largest sector of the private economy.
Manufacturing led financial services by 2:1 back in the 1970s, but by 2006 beaten goods production had shrunk to just 12% of GDP.
During Greenspan's 1987-2005 tenure, the sum of public and private debt in the United States quadrupled from just over $10 trillion to $43 trillion.
One of the main topics I have written about over the last few years is the incredible amount of debt build-up that has occurred in the US economy. Whether it's the over $9 trillion total of US government debt (roughly 64% of US GDP) or the mammoth increase in household debt (which is almost as much as total US GDP and over 130% of disposable income at the national level) we're literally swimming in red ink in this country.
The main problem I have with this development is a basic fact of debt: you have to pay it back. Here's why that's an issue.
For the 4Q82 to 3Q90 expansion the median quarterly growth rate was 3.85%. Here's a chart of the 10-year Treasuries yield over the same time:
Notice at best the Federal government was paying 7% for 3.85% economic growth. That just makes no sense. But everyone is acting as though the Federal debt is no big deal.
Over the latest expansion (4Q01 to present) we've seen a 2.7% median quarterly growth rate. Over the same time the US has added a little over $3 trillion to the total national debt. And here's a chart of the interest rate on the 10-year Treasury:
Notice we're still paying more interest than our total growth rate.
Here's the point (and I made this above as well). You have to pay back debt at some point. Yes, you can refinance it etc.... but that doesn't eliminate the basic problem -- you still owe the money. And at some point, that's going to bite is hard.
The Problems In the Financial Sector Aren't Over By A Long Shot
Every day when I wake up I always ask myself, "what am I going to write about today?" I have no idea why, but for some reason I think there just won't be something interesting to highlight. Today I clicked on Bloomberg and their opening web page was writing gold.
Sometime over the last few weeks, S&P issued a report that said we're almost at the end of all the bank writedowns. The market rallied on the report's release. My response was shall we say a bit jaded. S&P was one of the firms that got us in this mess by blessing poorly researched mortgage pools with AAA ratings. As if on cue, the news from the financial sector since S&P issued this report has been negative. Case in point are the following headlines from today's front page on Bloomberg:
Let's review. The bank has losses from credit writedowns of $38 billion. They have had to raise an additional $28 billion. Yet now they're getting back on a "solid foundation." That is one of the shakiest "firm foundations" I have ever seen for a large financial institution. I'm not the only one who thinks so either:
But UBS isn't the only firm that is having problems:
This is a "vote in our balance sheet." What I find amazing is the this is oversubscribed. Can you say lemmings over a cliff? I love the statement, "we don't need it, but we're doing it anyway." That makes no sense -- unless there is a really a problem and the CEO is looking to spin the problem away. And things are so healthy at Lehman that:
Because we all know that declining revenue and job cuts are the sign of a healthy business model, don't we?
But wait -- there's even more good news today:
And the CEO is so thrilled by his banks overall position that:
That's a sign of confidence, isn't it'? It's from the Richard Nixon "I am not a crook" school of public relations. Not taking questions should raise a boat load of red flags.
But wait -- there's even more good news from Deutsche Bank:
I love when companies report earnings with the asterisk of "one time event" added to the number. It's their way -- along with the idiot analysts who cover the sector -- of spinning the hell out of poor numbers. Considering we're three quarters into the financial crisis, adding an asterisk to a number and saying "it's a one time event" just doesn't hold water. The bottom line is the entire sector is in the middle of a major problem that isn't showing any signs of slowing.
As if all the above headlines weren't enough:
18% is the cost of their funds. Why didn't they just go to Vinnie? He'll only take out your kneecaps.
This started last summer with Bear Stearns' announcement that they're writing down $6 billion in losses from tow hedge funds. Nothing has changed since then -- except the bottom calling by a bunch of happy pill taking morons -- to indicate we've reached the bottom. And every time someone says "we're done" we get a series of headlines like we got today. The bottom line is we're in a world of hurt and we're' nowhere near the end of it.
Sometime over the last few weeks, S&P issued a report that said we're almost at the end of all the bank writedowns. The market rallied on the report's release. My response was shall we say a bit jaded. S&P was one of the firms that got us in this mess by blessing poorly researched mortgage pools with AAA ratings. As if on cue, the news from the financial sector since S&P issued this report has been negative. Case in point are the following headlines from today's front page on Bloomberg:
UBS AG, battered by the biggest writedowns from the collapse of the U.S. subprime mortgage market, reported a 12 billion-franc ($11.9 billion) quarterly loss and said Chairman Marcel Ospel will step down.
The bank will seek 15 billion francs in a rights offer to replenish capital, on top of 13 billion francs raised from investors in Singapore and the Middle East. UBS will write down $19 billion on debt securities, bringing the total to almost $38 billion since the third quarter of 2007. Zurich-based UBS also said today it will cut jobs at the investment bank.
Ospel, 58, who led the creation of UBS in a merger a decade ago, will be replaced by 58-year-old general counsel Peter Kurer. Deutsche Bank AG said today that market conditions have become ``significantly more challenging'' in recent weeks, after rising U.S. mortgage defaults caused about $230 billion in credit losses and writedowns at financial companies. UBS rose as much as 10 percent in Swiss trading on optimism Switzerland's largest bank will recover from its subprime losses.
``Behind closed doors they have been cleaning up very swiftly and the capital increase will put them back onto a solid foundation,'' said Joerg de Vries-Hippen, who oversees about $26 billion, including UBS shares, as chief investment officer for European stocks at Allianz Global Investors in Frankfurt. Still, ``it will take years to repair the bank's reputation,'' he said.
Let's review. The bank has losses from credit writedowns of $38 billion. They have had to raise an additional $28 billion. Yet now they're getting back on a "solid foundation." That is one of the shakiest "firm foundations" I have ever seen for a large financial institution. I'm not the only one who thinks so either:
UBS, the world's biggest money manager for the wealthy with about 2.3 trillion francs in private-banking assets, said clients in Switzerland withdrew funds in the first quarter. Those redemptions were offset elsewhere and net investments were ``slightly positive,'' Chief Executive Officer Marcel Rohner said on a conference call today.
But UBS isn't the only firm that is having problems:
Lehman Brothers Holdings Inc., the fourth-largest U.S. securities firm, is seeking to raise at least $3 billion from a share sale after speculation it's short of capital drove the stock down 42 percent this year.
Lehman is offering 3 million convertible preferred shares in a sale that will be ``an endorsement of our balance sheet by investors,'' Chief Financial Officer Erin Callan said in an interview yesterday. Demand for the stock was three times greater than the amount on sale as of 6:30 p.m. in New York, according to a person familiar with the offering who declined to be identified before the sale ends today.
Chief Executive Officer Richard Fuld is trying to restore confidence after Lehman shares plunged as much as 48 percent on March 17 on speculation the New York-based firm would face the same cash shortage that broke Bear Stearns Cos. Merrill Lynch & Co., Citigroup Inc. and Morgan Stanley have also raised cash from investors after more than $200 billion of writedowns and losses tied to the collapse of mortgage markets at the world's biggest financial companies.
....
``We still maintain that we don't need capital, but we've realized that perception is the dominant issue in today's markets,'' Callan said.
This is a "vote in our balance sheet." What I find amazing is the this is oversubscribed. Can you say lemmings over a cliff? I love the statement, "we don't need it, but we're doing it anyway." That makes no sense -- unless there is a really a problem and the CEO is looking to spin the problem away. And things are so healthy at Lehman that:
The firm's net income declined 57 percent in the quarter, less than analysts estimated, because of a $1.8 billion writedown on mortgage assets. Merger advisory fees jumped 34 percent, investment-management revenue surged 39 percent and equities rose 6 percent.
Fuld, 61, has announced plans to cut 5,300 jobs, or 19 percent of the workforce, and closed mortgage units during the past seven months. He also has expanded in Europe and Asia to gain market share in stock trading as part of his initiatives designed to help Lehman grow faster than its peers once markets recover.
Because we all know that declining revenue and job cuts are the sign of a healthy business model, don't we?
But wait -- there's even more good news today:
Deutsche Bank AG, Germany's biggest bank, will write down a record 2.5 billion euros ($3.9 billion) in loans and asset-backed securities as contagion from the subprime-market collapse spreads to Europe's largest financial companies.
``Conditions have become significantly more challenging during the last few weeks,'' the Frankfurt-based bank said today. Deutsche Bank will cut the value of leveraged-buyout and commercial real-estate loans and residential mortgage-backed securities.
Deutsche Bank, which increased profit last year as it skirted the worst of the subprime meltdown, said a week ago its 2008 pretax profit target is under threat. Swiss rival UBS AG announced today Chairman Marcel Ospel will step down after reporting an additional $19 billion of writedowns.
And the CEO is so thrilled by his banks overall position that:
Chief Executive Officer Josef Ackermann, attending a banking conference in London today, wouldn't answer questions.
That's a sign of confidence, isn't it'? It's from the Richard Nixon "I am not a crook" school of public relations. Not taking questions should raise a boat load of red flags.
But wait -- there's even more good news from Deutsche Bank:
Deutsche Bank spokesman Christian Streckert cited last week's annual report when asked today about the 2008 pretax profit forecast of 8.4 billion euros, which excludes one-time effects. The bank on March 26 said writedowns and a worsening economy would ``adversely affect our ability to achieve our pretax profitability objective.''
``The market was prepared,'' said Thomas Nagel, a Frankfurt-based trader at Equinet AG. ``Bank stocks could even being nearing a turnaround because the drops have been exaggerated.''
Deutsche Bank said today markdowns on assets backed by residential mortgages ``principally'' involve 7.91 billion euros of so-called ALT-A mortgages, which fall between subprime and prime.
I love when companies report earnings with the asterisk of "one time event" added to the number. It's their way -- along with the idiot analysts who cover the sector -- of spinning the hell out of poor numbers. Considering we're three quarters into the financial crisis, adding an asterisk to a number and saying "it's a one time event" just doesn't hold water. The bottom line is the entire sector is in the middle of a major problem that isn't showing any signs of slowing.
As if all the above headlines weren't enough:
Thornburg Mortgage Inc., a residential-finance company hit hard by the credit crunch, said Monday it had succeeded in raising new capital to stave off bankruptcy.
After a struggle of more than a week, the real-estate investment trust, specializing in making large mortgages to people with good credit, said it raised $1.35 billion through selling bonds, warrants to purchase its common shares and interests in certain mortgage assets. The company plans to use the proceeds from the offering to satisfy a capital-raising requirement set by its lenders, who gave the company an extension through Monday to raise $948 million or risk losing funding.
To sell the bonds, Thornburg is paying a high price. Buyers of the bonds will get 18% interest initially and warrants to buy Thornburg shares for a penny a share. Thornburg said last night it had received $1.15 billion of the proceeds from the offering. The remaining $200 million of the offering proceeds is being held in escrow and will be delivered to the company upon the completion of a tender offer for its preferred stock.
The funding problem for Thornburg, based in Santa Fe, N.M., underscores the challenges facing many financial firms at a time when the credit-market turmoil has severely curtailed access to capital. Unlike subprime lenders -- those catering to people with poor credit -- Thornburg has prided itself on a low default rate and a $35 billion portfolio of adjustable-rate mortgages and mostly highly rated mortgage securities.
18% is the cost of their funds. Why didn't they just go to Vinnie? He'll only take out your kneecaps.
This started last summer with Bear Stearns' announcement that they're writing down $6 billion in losses from tow hedge funds. Nothing has changed since then -- except the bottom calling by a bunch of happy pill taking morons -- to indicate we've reached the bottom. And every time someone says "we're done" we get a series of headlines like we got today. The bottom line is we're in a world of hurt and we're' nowhere near the end of it.
Monday, March 31, 2008
Today's Markets
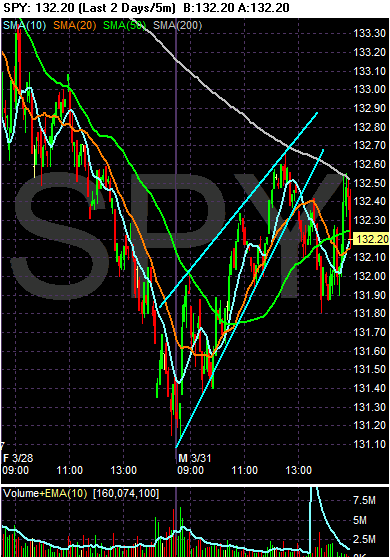
With the SPYs, notice the following:
-- The market was in an upward sloping channel until a bit after lunch.
-- The market broke the upward trend in the early afternoon.
-- The market tried to rally twice through the 200 SMA but was rebuffed.
-- There is upward resistance in the 132.50 - 132.60 range
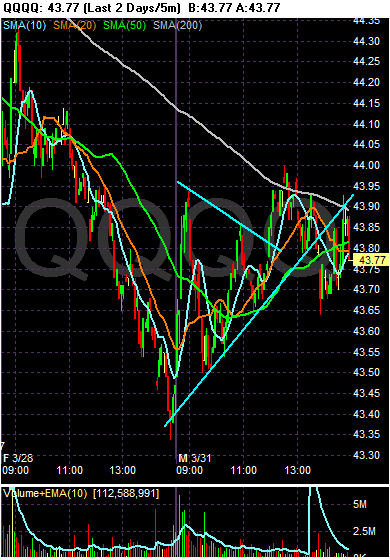
Notice the following:
-- There are interlocking trends/patterns. There is a triangle pattern in the morning. There is also an upward sloping trend channel that the market broke a bit after lunch.
-- The market tried to rally through the 200 SMA three times but was rebuffed.
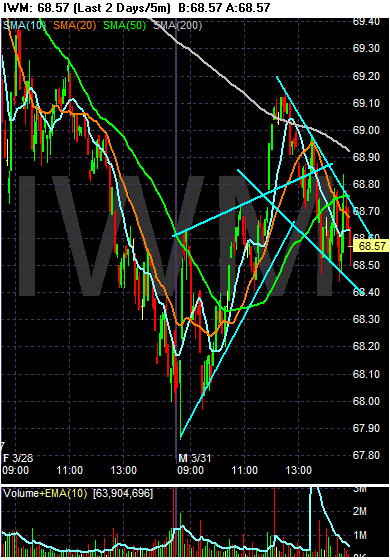
With the IWMS, notice there are two patterns.
-- An upwards sloping channel
-- A downward sloping pennant pattern.
Also note the IWMS only reached the 200 SMA once, crossed over and then retreated.
Are Commodities Heading Lower?
One of the main reasons I have been concerned about inflation is the incredible price spike across a variety of commodities. However, according to this week's Barron's cover story (subscription required) this may be the result of a speculative bubble. Here are some pertinent excerpts:
The short version of all this is that a technical abnormality relating to large investment funds is seriously distorting the true picture of commodities prices. Whether this is true or not I have no idea. I've never bee a big fan of economic models in general and am generally more suspicious of models that say "X% of this price goes to Y variable."
That being said. there is a strong possibility that the loophole in the futures market's rules is allowing a price distortion to occur that is not based on simple supply and demand of particular commodity.
According to the article, there will be a big meeting on April 22 to see how this plays out. Keep your eyes on that meeting.
Here's the problem [with all of the bullish bets on commodities]: The speculators' bullishness may be way overdone, in the process lifting prices far above fair value. If the speculators were to follow the commercial players -- the farmers, the food processors, the energy producers and others who trade daily in the physical commodities -- they'd be heading for the exits. For right now, the commercial players are betting on price declines more heavily than ever before, says independent analyst Steve Briese.
For example, in the 17 commodities that make up the Continuous Commodity Index, net short positions by the commercials have been running more than 30% higher than their previous net-short record, in March 2004.
Briese, author of the recent book The Commitments of Traders Bible and editor of the Website CommitmentsOfTraders.org, was one of the first to recognize that information on the bets made by the commercials could provide rare insights into how the "smart money" views the price outlook. These days, the data suggest, the smart money clearly believes that the market's exuberance has turned irrational.
Indeed, the great commodities bubble started springing its first leaks two weeks ago: Oil, gold and other major commodities posted their steepest weekly drop in half a century. Though prices have since firmed, they could eventually drop 30% as speculators retreat. The only real question is when.
.....
Commodities index funds, which arrived on the scene in the late 1990s, have come into their own in the past several years. The biggest index fund, Pimco Real Return (ticker: PRTNX), has seen its assets swell to $14.3 billion from $8 million since its inception in January 1997.
Index funds offer investors an easy, inexpensive way to gain exposure to a segment of the commodities markets or a broad-based basket of commodities. Result: The funds have drawn many private investors who have never ventured into futures, along with pension funds and other institutional players looking to diversify. But for all the virtues that the funds hold as a way of spreading bets across commodity markets, they take only long, or bullish, positions, avoiding short-selling. In other words, they trade on the naïve and potentially fatal assumption that commodities have the same tendency as stocks to rise over the long run.
The short version of all this is that a technical abnormality relating to large investment funds is seriously distorting the true picture of commodities prices. Whether this is true or not I have no idea. I've never bee a big fan of economic models in general and am generally more suspicious of models that say "X% of this price goes to Y variable."
That being said. there is a strong possibility that the loophole in the futures market's rules is allowing a price distortion to occur that is not based on simple supply and demand of particular commodity.
According to the article, there will be a big meeting on April 22 to see how this plays out. Keep your eyes on that meeting.
What Inflation?
From Bloomberg:
From Marketwatch:
It's important to remember the inflation picture is premised on spiking commodity prices. However, that picture may be changing.
The last rate cut by the Federal Reserve indicated that inflation was "elevated". In addition, the Fed cut 75 basis points rather than a full 100 basis points. This led some traders the the conclusion the Fed was near the end of its rate cuts. Whether this plays out is anyone's guess. But, the above chart indicates traders may be changing their thinking about the commodities market. Notice the following:
-- The index dropped about 7% the week of the Fed's rate cut.
-- Prices moved through the 10 and 20 day SMA
-- Both the 10 and 20 day SMA are now headed lower.
-- However, prices bounced off of the area where the 50 day SMA is currently located.
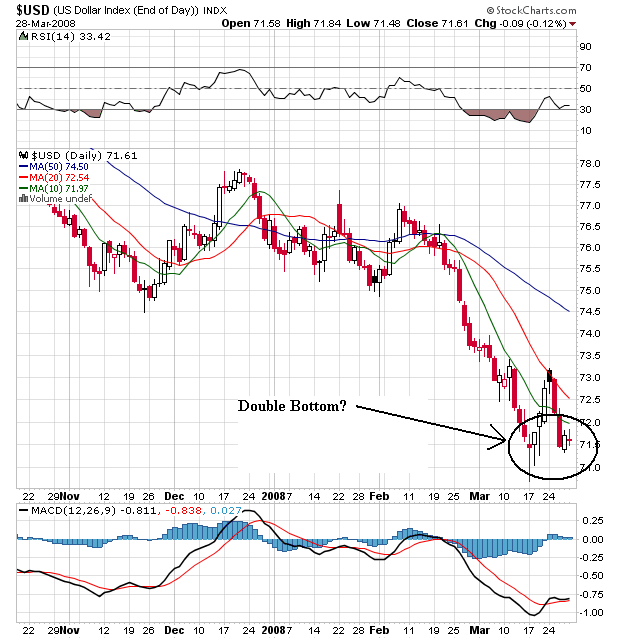
A lot depends on what happens with the dollar.
Notice the following.
-- There is still a bearish orientation to the chart.
-- All the SMAs are still headed lower
-- The shorter SMAs are below the longer SMAs
-- Prices are below the SMAs
-- However, prices may be forming a double bottom.
Short version -- the commodity price picture may be stabilizing for now.
European inflation accelerated to the fastest in almost 16 years in March, heightening the European Central Bank's quandary at a time when the economy is cooling and confidence is falling.
Consumer-price inflation in the euro area accelerated to 3.5 percent this month, the highest rate since June 1992, the European Union's statistics office in Luxembourg said today. That is faster than the 3.3 percent median forecast of 36 economists in a Bloomberg News survey. A separate report showed consumer and business confidence fell more than economists expected.
Rising food and energy prices are stoking inflation in the euro area, eroding consumers' purchasing power and pushing up costs at companies. ECB council member Erkki Liikanen said today that inflation expectations have ``hardened'' and the growth outlook has ``become more subdued,'' summing up the dilemma for the central bank, which is resisting cutting interest rates as inflation accelerates.
From Marketwatch:
Investors in interest rate-sensitive sectors such as automobile, financial services and real-estate firms are unlikely to breathe easy this week as India's inflation threatens to run out of control, dashing earlier hopes that the monetary policy could be eased some time this year to lift slowing economic growth.
In five quick weekly steps, the country's inflation shot up to a 15-month high of 6.68% in the week ended March 15, way above expectations of less than 6%, from 4.35% in the week ended Feb. 9. The more than two-percentage point inflation shock in such a short time has jolted policy makers just as it has economists, increasing chances of both fiscal and monetary action to prevent the situation from getting out of control.
And the government seems to be moving quickly. On Friday, trade minister Kamal Nath reportedly said the government was mulling an exports ban on some types of rice, while other government officials suggested a ban on edible oil exports, along with a reduction in import duties of other commodities.
It's important to remember the inflation picture is premised on spiking commodity prices. However, that picture may be changing.
The last rate cut by the Federal Reserve indicated that inflation was "elevated". In addition, the Fed cut 75 basis points rather than a full 100 basis points. This led some traders the the conclusion the Fed was near the end of its rate cuts. Whether this plays out is anyone's guess. But, the above chart indicates traders may be changing their thinking about the commodities market. Notice the following:
-- The index dropped about 7% the week of the Fed's rate cut.
-- Prices moved through the 10 and 20 day SMA
-- Both the 10 and 20 day SMA are now headed lower.
-- However, prices bounced off of the area where the 50 day SMA is currently located.
A lot depends on what happens with the dollar.
Notice the following.
-- There is still a bearish orientation to the chart.
-- All the SMAs are still headed lower
-- The shorter SMAs are below the longer SMAs
-- Prices are below the SMAs
-- However, prices may be forming a double bottom.
Short version -- the commodity price picture may be stabilizing for now.
Subscribe to:
Posts (Atom)