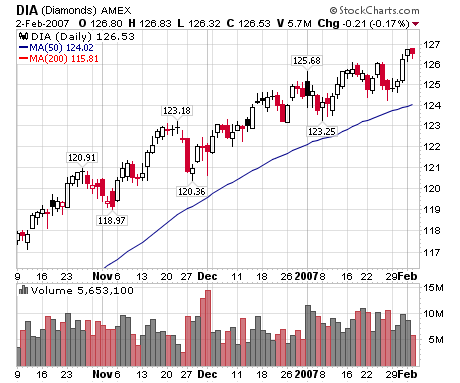
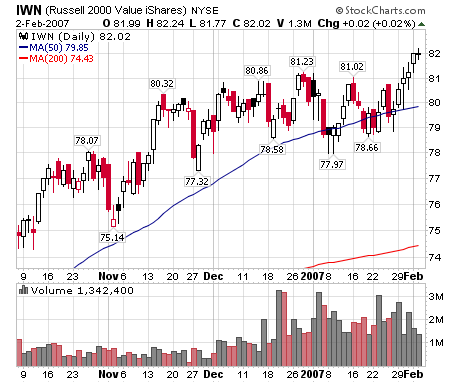
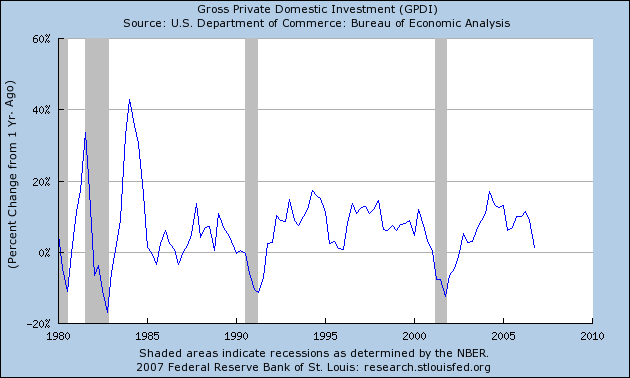
Last week's GDP report was stronger than anyone expected. However, there were a few points in the report that should raise some eyebrows. Chief among them was the level of domestic investment, which fell 11% from the third quarter. Below is a chart from the St. Louis Fed of the year-over-year change of Gross Private Domestic Investment. It does not include this week's GDP numbers, which would have sent the chart lower.
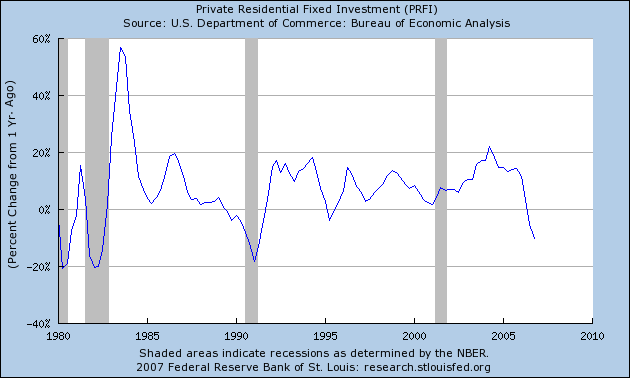
Let's break the gross number down. Once again, residential investment decreased from the preceding month, this time at a 19.2% clip. This is the third quarter in a row of declining residential investment. Below is a chart of the year over year change in residential investment. Again, this chart does not include this week's number which also would have sent the chart lower.
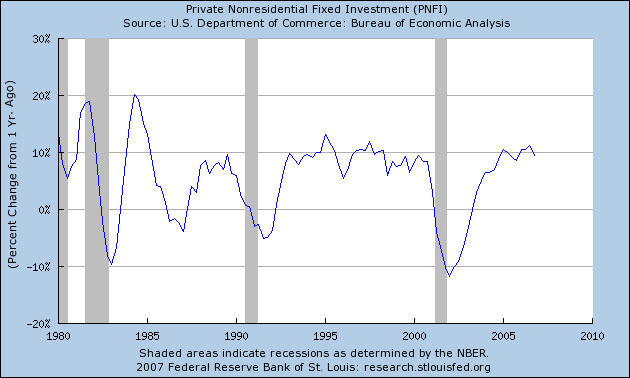
Here is a chart of non residential fixed investment. It shows a a solid year over year change. The year over year change for this figure in last week's GDP report was 7.4%. So, we are still in decent territory here.
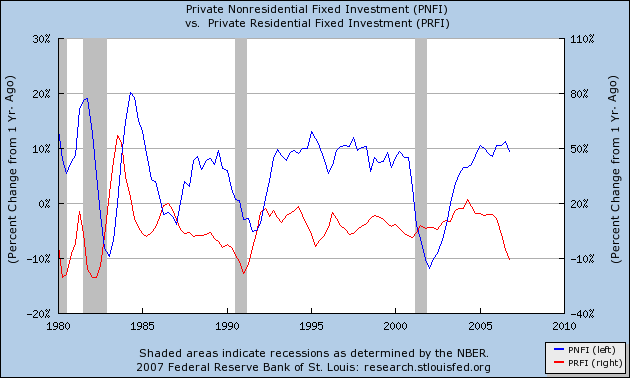
Here's a chart that shows residential versus nonresidential year over year change in investment. Notice that in the early 1980s housing investment led business investment but in the 2001 recession business investment declined without a corresponding residential decline. The 2001 situation was the result of the massive Y2K investment. In other words, it was a unique economic event.
It's important to note January's manufacturing numbers. All of the Federal Reserve districts reported lukewarm results. Chicago's PMI moved into a recessionary level. While 4th quarter industrial production increased .4%, the 4th quarter saw an overall decline. In short, manufacturing numbers were moderate at best.
This means that February's manufacturing surveys are very important, so keep your eye on them.
Saturday, February 3, 2007
Friday, February 2, 2007
The Market's Last Week
Non-Farm Payrolls Increase 111,000; REVISIONS MAKE REPORT USELESS
From Bloomberg:
Here is the report from the BLS:
First -- note that BLS ONCE AGAIN has raised the originally reported numbers. For God's sake, people, can we get some good timely data? PLEASE
I have a big problem with this report (what else is new?). The report says construction jobs increased 22,000. At the same time, the weekly unemployment reports from the last few months have shown several states with over 1,000 lay-offs in construction (Florida, Minnesota and California were on these lists if memory serves). These two numbers simply don't jibe together.
Manufacturing lost 16,000 jobs. Professional services gained 25,000 and education/health increased 31,000. Leisure and hospitality gained 23,000.
OK, so this is a smaller than expected gain in overall employment. BUT ...
This is the second time in the last two years we have seen some really big adjustments to the labor report. One of the reasons I have personally been bearish over the last two years is the as reported weak job gains. However, that job weakness was not at the level reported. In fact, the size of the revisions makes that prediction unwarranted. Will someone at the BLS kindly get their act together so the information we use is actually good information?
In addition, the size of these revisions is making the monthly release practically meaningless. And this is a really important number to be made meaningless, people.
Employers in the U.S. added a smaller- than-forecast 111,000 workers to payrolls in January and the unemployment rate rose, evidence of an economy growing at the moderate pace predicted by the Federal Reserve.
The gain in employment followed a 206,000 rise in December that was larger than previously estimated, the Labor Department reported today in Washington. The jobless rate rose to 4.6 percent, the first increase in three months.
Here is the report from the BLS:
First -- note that BLS ONCE AGAIN has raised the originally reported numbers. For God's sake, people, can we get some good timely data? PLEASE
I have a big problem with this report (what else is new?). The report says construction jobs increased 22,000. At the same time, the weekly unemployment reports from the last few months have shown several states with over 1,000 lay-offs in construction (Florida, Minnesota and California were on these lists if memory serves). These two numbers simply don't jibe together.
Manufacturing lost 16,000 jobs. Professional services gained 25,000 and education/health increased 31,000. Leisure and hospitality gained 23,000.
OK, so this is a smaller than expected gain in overall employment. BUT ...
With today's report, the Labor Department officially revised the payroll numbers after reviewing more complete tax data not available earlier from state unemployment insurance programs and making adjustments to its estimates of seasonal hiring patterns.
The revision added 754,000 jobs to the previously estimate for the year ended March 2006, the biggest revision since Labor started adjusting the numbers in 1991.
This is the second time in the last two years we have seen some really big adjustments to the labor report. One of the reasons I have personally been bearish over the last two years is the as reported weak job gains. However, that job weakness was not at the level reported. In fact, the size of the revisions makes that prediction unwarranted. Will someone at the BLS kindly get their act together so the information we use is actually good information?
In addition, the size of these revisions is making the monthly release practically meaningless. And this is a really important number to be made meaningless, people.
Thursday, February 1, 2007
Questions About Personal Spending in the GDP Report
This is from the Big Picture, which is quoting Tony Crescenzi
This is a very solid observation. Considering consumer spending was responsible for 3.05 of the 3.5% increase, it's a very important observation.
I have been concerned about the US consumer for some time. First, consumer spending has now increased for a ton of quarters without a contraction. That's huge. In addition, there's a ton household debt (mortgage debt plus credit card debt) in the economy. At some point we're going to hit debt saturation. Where that line is I have no idea. But when HH debt is over 90% of overall GDP and 120% of national disposable income and debt payments as a percentage of income are at an all-time high, you have to wonder when people will start to reign in their spending.
As usual, the devil of the numbers is in the details.
"On the surface, the figure looks solid, increasing 4.4%. The problem, however, is that it reflects a gain of just 3.6% in nominal spending because the personal consumption deflator fell 0.8%, its first decrease since 1961 and the largest decline since 1954, according to Market News.
This means that if the inflation rate for the quarter were at a normal level, say, up 2.0%, personal spending would have seen a very small gain of just 1.6% for the quarter. (I get this by subtracting 2.0% from 3.6%.)
The low level of nominal spending, which was the weakest in four years, reflects strain on the consumer. This figure represents the total amount of money that consumers spent during the quarter, a tally that looked good only because they caught a break with the decline in energy costs. Had energy costs increased, it would have produced a much different result. For context, nominal spending in the overall economy has increased at a pace of 5.6%; it increased at a pace of 5.0% in the fourth quarter."
This is a very solid observation. Considering consumer spending was responsible for 3.05 of the 3.5% increase, it's a very important observation.
I have been concerned about the US consumer for some time. First, consumer spending has now increased for a ton of quarters without a contraction. That's huge. In addition, there's a ton household debt (mortgage debt plus credit card debt) in the economy. At some point we're going to hit debt saturation. Where that line is I have no idea. But when HH debt is over 90% of overall GDP and 120% of national disposable income and debt payments as a percentage of income are at an all-time high, you have to wonder when people will start to reign in their spending.
As usual, the devil of the numbers is in the details.
S&P Upgrades India's Credit Status
From the Financial Times:
India is looking more and more like the next big growth play -- the same way China was a few years ago.
India finally regained full investment-grade status on Tuesday after a hiatus of more than 15 years, as Standard & Poor’s followed the lead of Moody’s and Fitch in removing the speculative tag from its sovereign credit rating.
The upgrade is symbolic for reformers in the government. S&P had downgraded India’s sovereign rating to junk status in May 1991, during the balance of payments crisis that triggered the start of the reform era.
India is looking more and more like the next big growth play -- the same way China was a few years ago.
Dow Transports Improve
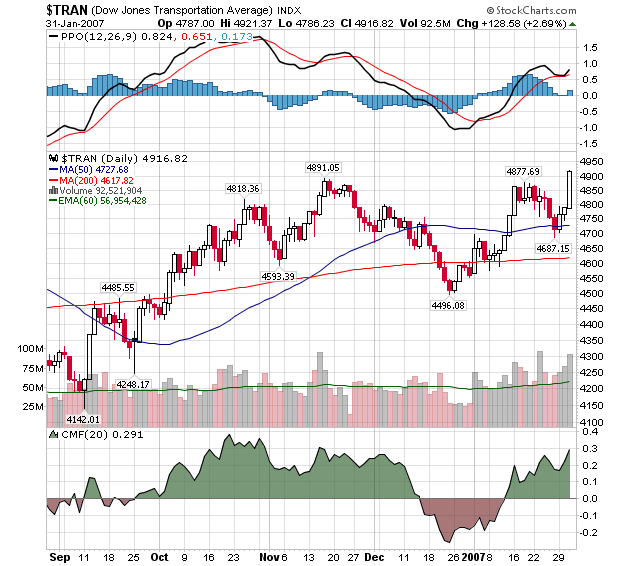
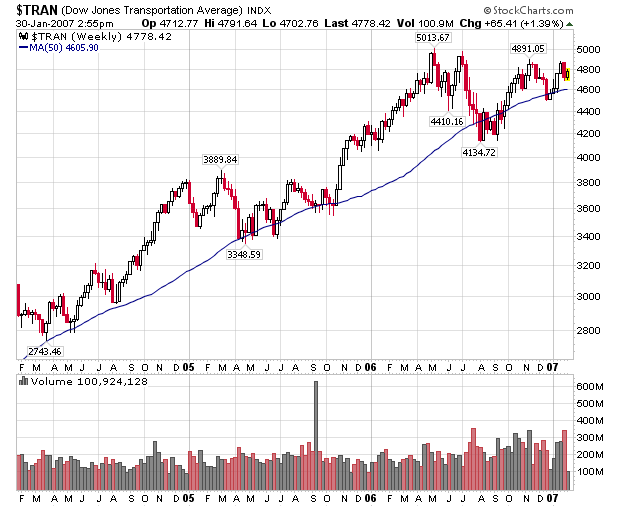
One of the complaints I've had with the current market is the lack of confirmation from the Dow transports -- while other indexes have hit record highs, the transport average has lagged. No longer
Notice the nice bull run over the last few days on increasing volume. While the average is still 1.91% below its high of late May/early June, this seeks action indicates there may be some bullish sentiment.
What we need now is one of two events. Either a continuation of the uptrend, or a slight pullback on lighter volume. Either of those developments would help allay my concerns about this market's overlall health.
Wednesday, January 31, 2007
Chicago PMI Drops
From the Chicago Purchasing Managers Website:
The various indexes within the report showed areas of concern. New orders have been dropping for a few months. Employment is at its lowest level in almost four years. One of the industry representative comments said overall demand was down almost 30% with high sales incentives. The new orders and overall production levels have been trending down for about 2 years, only now falling into contraction levels.
The comments section called the report "worrisome".
The Chicago Purchasing Managers reported the Chicago Business Barometer fell below neutral, ending 43 months ofpositive readings.
- Production advanced while New Orders retreated;
- Prices Paid continued to slump toward neutral;
- Employment fell to the lowest level in four years;
Buying Policy: 3 month average lead-times were longer, but January bucked the trend.
The various indexes within the report showed areas of concern. New orders have been dropping for a few months. Employment is at its lowest level in almost four years. One of the industry representative comments said overall demand was down almost 30% with high sales incentives. The new orders and overall production levels have been trending down for about 2 years, only now falling into contraction levels.
The comments section called the report "worrisome".
FOMC Statement
From the Fed:
I have no idea why the markets were so excited about this statement. The Fed gave themselves ample wiggle room to raise rates if they need to. While the inflation number from the GDP report was encouraging, oil is creeping back up. There's still something to be concerned about for the Fed.
Recent indicators have suggested somewhat firmer economic growth, and some tentative signs of stabilization have appeared in the housing market. Overall, the economy seems likely to expand at a moderate pace over coming quarters.
Readings on core inflation have improved modestly in recent months, and inflation pressures seem likely to moderate over time. However, the high level of resource utilization has the potential to sustain inflation pressures.
The Committee judges that some inflation risks remain. The extent and timing of any additional firming that may be needed to address these risks will depend on the evolution of the outlook for both inflation and economic growth, as implied by incoming information.
I have no idea why the markets were so excited about this statement. The Fed gave themselves ample wiggle room to raise rates if they need to. While the inflation number from the GDP report was encouraging, oil is creeping back up. There's still something to be concerned about for the Fed.
Globalization Barreling Down the Highway Toward America's Middle Class
When Muhammad Yunus accepted the Nobel Peace Prize last month, the Bangladeshi banker who invented the practice of making small, unsecured loans to the poor, said the globalized economy was becoming a dangerous “free-for-all highway.” According to The New York Times:
The United States always has traded with other nations—but until the 1970s, the international share of the U.S. economy was modest, and exports and imports were generally in balance or showed a small surplus. As Economic Policy Institute (EPI) economist Jeff Faux notes:
Faux’s briefing paper, “Globalization That Works for Working Americans,” was released Jan. 11 at the launch of a new network of progressive economists, the Agenda for Shared Prosperity. In it, he continues:
Mishel, who testified Tuesday before the House Committee on Ways and Means, told lawmakers:
Discussing a recent Center for American Progress study, White Collar Perspectives on Workplace Issues, Jim Grossfeld and Celinda Lake wrote on The America Prospect online that “many young, white collar workers are now as bewildered by the ‘new economy’ as manufacturing workers have been for a generation.”
The union movement doesn’t oppose trade and globalization. In fact, it’s precisely because we recognize we live in a global economy that we see a lot of policy changes that should be made at the federal level to enhance the quality and stability of jobs in this nation. And when trade deals are negotiated, they need to do more than line corporate pockets—they need to ensure workers don’t get run off the road.
Faux offers many solutions in his issue paper on globalization, one of many the Agenda for Shared Prosperity will issue in coming months in advance of the 2008 elections on topics such as pension, health care and more. One solution he offers: Eliminate perverse tax incentives.
As AFL-CIO President John Sweeney wrote recently in a USA Today op-ed:
Its lanes will be taken over by the giant trucks from powerful economies… Bangladeshi rickshaws will be thrown off the highway.Further, as The Times paraphrased Yunus as saying:
While international companies motivated by profit may be crucial in addressing global poverty…nations must also cultivate grassroots enterprises and the human impulse to do good.Yunus has accomplished untold good for his nation’s impoverished citizens, even as he and others for years have sounded the alarm about the negative impact of globalization on the world’s most impoverished. But more and more, it’s not only the poor who are being run off the road. America’s middle class increasingly finds itself faced with the effects of globalization—and seemingly no way to stop the collision. And white-collar professionals are among those now in the headlights.
The United States always has traded with other nations—but until the 1970s, the international share of the U.S. economy was modest, and exports and imports were generally in balance or showed a small surplus. As Economic Policy Institute (EPI) economist Jeff Faux notes:
...in the last 25 years, foreign trade has risen 700 percent, more than doubling as a share of gross domestic product to 28 percent. In 2006, the excess of imports over exports will reach some $900 billion—7 percent of GDP [gross domestic product].
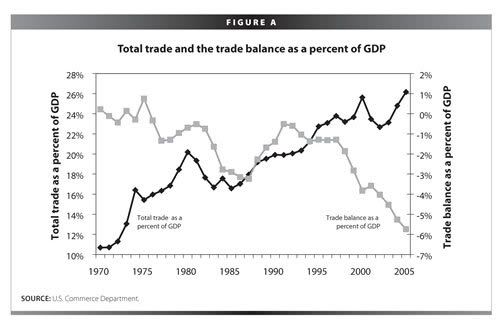
Faux’s briefing paper, “Globalization That Works for Working Americans,” was released Jan. 11 at the launch of a new network of progressive economists, the Agenda for Shared Prosperity. In it, he continues:
This dramatic shift reflects more than simply an increased movement of goods and services between the United States and other nations. It reflects an unprecedented economic integration with the rest of the world that is blurring the very definition of the "American" economy.As EPI economist Larry Mishel puts it, more trade, regardless of its terms, is not better for all of us. For many working Americans, the huge growth in foreign trade has resulted in the loss of family-supporting jobs, downward pressure on wages and increased inequality: From 2000 to 2005 alone, 3 million manufacturing jobs disappeared, at least one-third because of our trade deficit. But the greatest damage has been to wages— Mishel estimates as much as a loss of $2,000–$6,000 annually for the typical household. The doubling of trade as a share of our economy over the past 25 years has been accompanied by a massive trade deficit, directly displacing several million jobs.
American business is steadily moving finance, technology, production, and marketing beyond our borders. Some 50 percent of all U.S.-owned manufacturing production is now located in foreign countries, and 25 percent of the profits of U.S. multinational corporations are generated overseas—and the shares are rapidly growing.
Mishel, who testified Tuesday before the House Committee on Ways and Means, told lawmakers:
That trade will make the distribution of income worse is embedded in fundamental economic logic. When American workers are thrown into competition with production originating from low-wage nations, both those workers employed directly in import-competing sectors and all workers economy-wide who have similar skills and credentials will have their wages squeezed. In fact, at the same time as trade flows with low-wage nations have increased, the distribution of income and wealth in the U.S. has grown more and more unequal.Such a view is not confined to progressive think tanks. David Autor, an economist at the Massachusetts Institute of Technology The New York Times yesterday:
The consensus until recently was that trade was not a major cause of the earnings inequality in this country. That consensus is now being revisited.After years of thinking the nation’s economic gains were passing primarily by manufacturing workers, middle-class professional and technical workers are recognizing the oncoming car wreck is headed in their direction as well.
Discussing a recent Center for American Progress study, White Collar Perspectives on Workplace Issues, Jim Grossfeld and Celinda Lake wrote on The America Prospect online that “many young, white collar workers are now as bewildered by the ‘new economy’ as manufacturing workers have been for a generation.”
As a 20-something techie in the once bustling Silicon Valley told us: "I think a lot of people, you know, 30 years ago, could get a job that was relatively stable, but, here I am, five years out of school, and I've had four jobs. It's not because I'm not good because I've gotten praise from every single job I've been at. It's just that the fact that the companies don't seem stable."In fact, new data compiled by EPI show employment growth in the past five-year post-recessionary period has been subpar due to a weak economy. This conclusion is supported by the fact that employment rates, which some thought were at the demographically set peaks, have risen sharply in response to job growth and falling unemployment in 2006.
But it's not just that these workers' future career prospects look murkier. The quality of their work lives is tanking, too. It is difficult to overstate the importance of this decline. Technical and professional employees share a profound conviction that their work ought to be intellectually satisfying—even an expression of their values. However, when employers press for cost savings and workloads soar, psychic wages take a plunge. Echoing the sentiments of many of the workers we spoke to, when asked to describe her office, one San Jose woman answered: "Busy, overworked, under staffed, not enough people in the group to do all the work we need to do so everyone's doing a lot of work and just running around like a chicken with a head cut off."
The union movement doesn’t oppose trade and globalization. In fact, it’s precisely because we recognize we live in a global economy that we see a lot of policy changes that should be made at the federal level to enhance the quality and stability of jobs in this nation. And when trade deals are negotiated, they need to do more than line corporate pockets—they need to ensure workers don’t get run off the road.
Faux offers many solutions in his issue paper on globalization, one of many the Agenda for Shared Prosperity will issue in coming months in advance of the 2008 elections on topics such as pension, health care and more. One solution he offers: Eliminate perverse tax incentives.
By law, corporations that invest in the United States pay taxes when they are earned. But corporations that invest overseas can delay the payment of taxes until they repatriate their profits—which can take a long time. In 2005, in order to get some short-term relief to the fiscal deficit, the Congress voted to offer corporations that brought their money back that year a 5.25 percent tax rate, a much lower rate than they would pay on profits made in the United States.In contrast to the Hamilton Project, which supports unfettered globalization, Faux offers many other options to making globalization work for working people. It’s all here.
This loophole might have been justified after World War II as a way of helping Europe and others get back on their feet. But it has long outlived its rationale and should be eliminated.
Indeed, U.S. integration into the global economy requires us to rethink our whole approach to taxation. Other nations, for example, use "border-adjustable" value-added taxes (VATs) to favor exports over imports. A progressive VAT is some-thing that ought to be considered as an instrument to level the playing field.
As AFL-CIO President John Sweeney wrote recently in a USA Today op-ed:
Without dramatic changes in trade policy, we will continue to hemorrhage good jobs, while corporations take advantage of workers whose basic human rights are violated daily.
Labels:
AFL-CIO,
Economic Policy Institute,
EPI,
jobs,
middle class,
trade,
unions
4th Quarter GDP Up 3.5%
From the BEA:
First, this number caught me by surprise. I predicted a recession in Q4 '06 or Q1 '07. It doesn't look like that's going to happen anytime soon.
So, let's look at the numbers to see where the US is growing.
Looking at the numbers, we see something a bit odd. In the 3rd quarter, purchases of food subtracted .07 from the overall numbers. In the 4th quarter, food added .69 to the number. In two previous quarters, we saw very slow growth in food purchases, but no negative numbers. It seems odd that purchases of food would somehow subtract from overall growth.
Overall, personal consumption expenditures added 3.05 to the overall number. Furniture and household equipment added .43 to the overall GDP number while residential investment subtracted 1.16 from overall GDP? That seems a bit off, especially when the same expenditure added .1 an .2 to 2Q and 3Q respectively. Some of those purchases might have been end of the year presents to the house -- sprucing up the place etc.. But a doubling in the number?
National defense spending added .53 to the numbers, whereas this spending had subtracted from growth in the previous 4 quarters. Overall federal spending added .31 to the numbers, whereas federal spending had subtracted from growth in the previous 2 quarters.
Exports of services added .4 to the overall number. This is the third highest amount services have added to the GDP number in the last 12 quarters. More importantly, this number is abnormally high. I wonder if there was a mega-deal that is responsible for this.
Disposable personal income increased 1.1% from the 3Q. I will caution -- this is a macro level number disproportionately affected by upper-income levels. However, rich people spend as well so it's important to include them in the calculation. This is probably the biggest reason for the increase in GDP.
Residential investment subtracted 1.16 from the overall number. That's a huge hit; it's also the third quarter where housing has impacted GDP in a big way. What's interesting is how housing's damage is contained in housing (at least so far).
I'm nitpicking with some of the above comments. This is obviously a good number. And again, my prediction of a recession doesn't look to be that good.
Real gross domestic product -- the output of goods and services produced by labor and property located in the United States -- increased at an annual rate of 3.5 percent in the fourth quarter of 2006, according to advance estimates released by the Bureau of Economic Analysis. In the third quarter, real GDP increased 2.0 percent.
The Bureau emphasized that the fourth-quarter "advance" estimates are based on source data that are incomplete or subject to further revision by the source agency (see the box on page 4). The fourth-quarter "preliminary" estimates, based on more comprehensive data, will be released on February 28, 2007.
The increase in real GDP in the fourth quarter primarily reflected positive contributions from personal consumption expenditures (PCE), exports, state and local government spending, and federal government spending that were partly offset by negative contributions from residential fixed investment and private inventory investment. Imports, which are a subtraction in the calculation of GDP, decreased.
The acceleration in real GDP growth in the fourth quarter primarily reflected a downturn in imports and accelerations in PCE for nondurable goods, in exports, in federal government spending, and in state and local government spending that were partly offset by downturns in private inventory investment and in equipment and software and a deceleration in nonresidential structures.
First, this number caught me by surprise. I predicted a recession in Q4 '06 or Q1 '07. It doesn't look like that's going to happen anytime soon.
So, let's look at the numbers to see where the US is growing.
Real personal consumption expenditures increased 4.4 percent in the fourth quarter, compared with an increase of 2.8 percent in the third. Durable goods increased 6.0 percent, compared with an increase of 6.4 percent. Nondurable goods increased 6.9 percent, compared with an increase of 1.5 percent. Services expenditures increased 2.9 percent, compared with an increase of 2.8 percent.
Looking at the numbers, we see something a bit odd. In the 3rd quarter, purchases of food subtracted .07 from the overall numbers. In the 4th quarter, food added .69 to the number. In two previous quarters, we saw very slow growth in food purchases, but no negative numbers. It seems odd that purchases of food would somehow subtract from overall growth.
Overall, personal consumption expenditures added 3.05 to the overall number. Furniture and household equipment added .43 to the overall GDP number while residential investment subtracted 1.16 from overall GDP? That seems a bit off, especially when the same expenditure added .1 an .2 to 2Q and 3Q respectively. Some of those purchases might have been end of the year presents to the house -- sprucing up the place etc.. But a doubling in the number?
National defense spending added .53 to the numbers, whereas this spending had subtracted from growth in the previous 4 quarters. Overall federal spending added .31 to the numbers, whereas federal spending had subtracted from growth in the previous 2 quarters.
Exports of services added .4 to the overall number. This is the third highest amount services have added to the GDP number in the last 12 quarters. More importantly, this number is abnormally high. I wonder if there was a mega-deal that is responsible for this.
Disposable personal income increased 1.1% from the 3Q. I will caution -- this is a macro level number disproportionately affected by upper-income levels. However, rich people spend as well so it's important to include them in the calculation. This is probably the biggest reason for the increase in GDP.
Residential investment subtracted 1.16 from the overall number. That's a huge hit; it's also the third quarter where housing has impacted GDP in a big way. What's interesting is how housing's damage is contained in housing (at least so far).
I'm nitpicking with some of the above comments. This is obviously a good number. And again, my prediction of a recession doesn't look to be that good.
Housing Bottom? Highly Doubtful
From Safehaven:
All of the "soft-landing" economists are overlooking the fact that new and existing home markets retreated the most in over 15 years. That should put a chill down everybody's spine. That's more than a "simple correction"; that's a rout.
In addition, note builder incentives are not included in the purchase price of new homes. While the article uses an average amount for incentives, it is illustrative that builders are essentially bribing buyers to close the deal. Even with all of those incentives, buyers are canceling orders at high levels; all builders have reported large cancellation rates in their latest earnings reports. Also note that cancellations are not included in new home sales, meaning those numbers are overstated.
A simple "correction" is a decline of say 5%. A year-over-year decline 10%+ is an indication of a serious supply/demand problem.
New home sales rose by 4.8% in December, registering a fall of 17.3% on the year with 1.0631 million units sold in 2006, the largest drop in 16 years. Note that to sell these homes, an average of $47K in incentives was included. Also, unit sales are reported at contract signing, so these numbers do not include contracts broken where delivery was not taken by the buyers. Existing home sales fell by the largest amount in 17 years, with 6.48 million units sold for 2006, which is down 8.4% year over year.
All of the "soft-landing" economists are overlooking the fact that new and existing home markets retreated the most in over 15 years. That should put a chill down everybody's spine. That's more than a "simple correction"; that's a rout.
In addition, note builder incentives are not included in the purchase price of new homes. While the article uses an average amount for incentives, it is illustrative that builders are essentially bribing buyers to close the deal. Even with all of those incentives, buyers are canceling orders at high levels; all builders have reported large cancellation rates in their latest earnings reports. Also note that cancellations are not included in new home sales, meaning those numbers are overstated.
A simple "correction" is a decline of say 5%. A year-over-year decline 10%+ is an indication of a serious supply/demand problem.
India Growth Rate Increases
From Bloomberg:
This is really important news. For all the talk of China's growth, the emerging growth story for the next few years is likely to be India.
Food for thought.
India revised the economic growth rate for the year ended March 31, 2006, to 9 percent, the fastest pace on record, the government said.
The pace was faster than the 8.4 percent forecast earlier because of greater expansion in agriculture and manufacturing, the government said in a statement in New Delhi today.
``It augurs well for the gross domestic product for 2006- 2007,'' Finance Minister Palaniappan Chidambaram said in New Delhi today. ``Although, I must caution that since the base has now increased, we will have to wait and see how it reflects statistically on the growth in 2006-2007.'
This is really important news. For all the talk of China's growth, the emerging growth story for the next few years is likely to be India.
Food for thought.
Tuesday, January 30, 2007
Oil Has a Big Day; Another Nail in the Rate Cut Coffin
From Bloomberg:
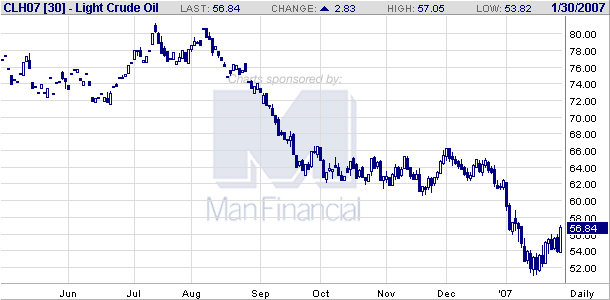
As this daily chart of oil below shows, the market was probably a bit oversold at current levels. That means traders were looking for a reason to buy:
However, cold weather can't last forever to provide a floor for the oil market. But that wasn't the only reason mentioned for today's rally:
OPEC's production cuts are finally having an impact on trader psychology.
But, that's not the only reason either. As mentioned above, all of the good economic news coming from the US us finally sinking in. A faster economy = more oil consumption by the US. In other words, the Goldilocks crowd hasn't counted on increasing oil prices.
To take this one step further, what does this mean for interest rates? All of the recent Fed statements have said inflation is still too high. This does not bode well for future rate cuts. In fact, I would guess that if oil continues rallying for the foreseeable future, rate cut talk will be declared dead on arrival.
Crude oil surged to its biggest gain in 16 months on speculation that colder weather and an improving economy will spur U.S. fuel consumption.
The National Weather Service predicted that below-normal temperatures will persist in the eastern U.S. for the next two weeks, and the price of natural gas, the country's most common home-heating fuel, jumped 11 percent. Consumer confidence in the U.S., where 25 percent of the world's oil is consumed, neared a five-year high, a report today showed.
``It's finally gotten cold, which will boost demand for natural gas and heating oil,'' said Bill O'Grady, director of fundamental futures research at A.G. Edwards & Sons in St. Louis. ``There's been a steady stream of good economic news in the U.S.,'' he said. ``The energy markets can no longer shrug off the economic numbers.''
As this daily chart of oil below shows, the market was probably a bit oversold at current levels. That means traders were looking for a reason to buy:
However, cold weather can't last forever to provide a floor for the oil market. But that wasn't the only reason mentioned for today's rally:
Oil is also getting support from the prospect that the Organization of Petroleum Exporting Countries will follow through on its pledges to cut production. The group, which pumps 40 percent of the world's crude, agreed in December to cut output by 500,000 barrels a day as of Feb. 1. That's on top of a reduction of 1.2 million barrels a day that went into effect in November.
OPEC's production cuts are finally having an impact on trader psychology.
But, that's not the only reason either. As mentioned above, all of the good economic news coming from the US us finally sinking in. A faster economy = more oil consumption by the US. In other words, the Goldilocks crowd hasn't counted on increasing oil prices.
To take this one step further, what does this mean for interest rates? All of the recent Fed statements have said inflation is still too high. This does not bode well for future rate cuts. In fact, I would guess that if oil continues rallying for the foreseeable future, rate cut talk will be declared dead on arrival.
UPS Issues Lower 2007 Earnings
Fromthe Financial Times:
Everybody is always bullish about the outlook 1 or more years from now. This is one reason I usually discount the "future outlook" from the various Federal Reserve district's manufacturing surveys. It's just too easy to say, "things will be great in 2008!"
All that aside, UPS and Fed Ex ship a lot of packages in the US. When they issue earnings warnings it's important to pay attention. Just as importantly, here's a chart of the Dow Transports:
The average had a double top formation in 2006 and may be forming another one as we speak. More importantly, the transports failed to confirm the late 2006 rally. This is a clear violation of Dow theory. After you make goods, you have to ship them somewhere. When people aren't shipping you have to wonder how health the economy is.
UPS, the world's largest package delivery group, has warned it faces a "challenging year" in the US as the slowing domestic economy puts the brakes on parcel shipments.
Shares in the group were down more than 3 per cent on Tuesday afternoon after it issued lower-than-expected earnings guidance for 2007 and said the year got off to a slow start in the US.
But Scott Davis, chief financial officer, remained "bullish" about the long-term outlook, predicting that the US slowdown would prove short-lived.
"We feel that this economy is a bump in the road and expect it to get back to normal towards the end of this year or the start of 2008," he said, in an interview.
Everybody is always bullish about the outlook 1 or more years from now. This is one reason I usually discount the "future outlook" from the various Federal Reserve district's manufacturing surveys. It's just too easy to say, "things will be great in 2008!"
All that aside, UPS and Fed Ex ship a lot of packages in the US. When they issue earnings warnings it's important to pay attention. Just as importantly, here's a chart of the Dow Transports:
The average had a double top formation in 2006 and may be forming another one as we speak. More importantly, the transports failed to confirm the late 2006 rally. This is a clear violation of Dow theory. After you make goods, you have to ship them somewhere. When people aren't shipping you have to wonder how health the economy is.
Housing Bottom? Doubtful
From the Associated Press:
First -- the data record is only 5 years old for the 20-city composite index. In addition, the index was started just before the housing bubble started. So comparisons with the last 5 years are to a period of higher-than-average growth.
However, a slowdown in appreciation indicates sellers are just starting to get the message there is too much supply on the market.
On a related note,
In other words, don't expect a housing price rebound anytime soon.
Prices of single-family homes across the nation rose in November at the slowest rate in more than a decade, a housing index released Tuesday by Standard & Poor's showed, countering other evidence that the housing slowdown may be nearing an end.
The S&P/Case-Shiller composite index showed a 1.3 percent year-over-year increase in the price of a single-family home based on existing homes tracked over time in 10 metropolitan markets.
For its 20-city composite index, prices grew 1.7 percent, the slowest rate ever for that data, according to the S&P index committee chairman, David Blitzer. That data has been collected since 2001.
"The weakness continues to spread," Blitzer said. "I don't see any signs of a bottom. Unfortunately, it's still looking pretty nasty from a housing point of view."
The last time the growth dipped lower than 1.3 percent for the 10-city index was in September 1996, when it measured 1.2 percent.
First -- the data record is only 5 years old for the 20-city composite index. In addition, the index was started just before the housing bubble started. So comparisons with the last 5 years are to a period of higher-than-average growth.
However, a slowdown in appreciation indicates sellers are just starting to get the message there is too much supply on the market.
On a related note,
"We have more than a million housing units of excess supply," said James O'Sullivan, an economist for UBS. "If you are looking for evidence that the worst is over for housing, you're not going to find it in this report. This argues that housing starts need to go down more."
In other words, don't expect a housing price rebound anytime soon.
Monday, January 29, 2007
Earnings Management
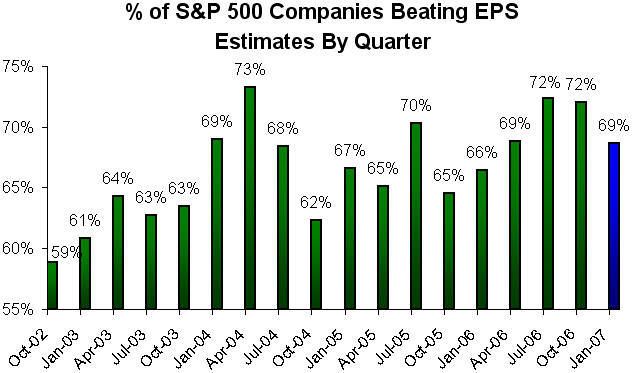
This chart has been making the econ blog rounds over the last few days:
Since October 2002, the lowest percentage of companies to beat earnings expectations is 59%. That's a pretty remarkable number when you think about it. It seems like most companies are going to beat expectations.
But -- let's look at the other side of the coin. Companies are pretty sophisticated about marketing. After all, most of these companies have sales and marketing departments, some have advertising accounts with some of the biggest advertising firms around and most CEOs are pretty marketing savvy. Here's the point: Companies do their best to influence market perception. It would not be surprising at all to learn that company x deliberately downplayed future expectations in order to beat those expectations and therefore hopefully drive the stock price up.
Remember: all of this miraculous "beating of expectations" also involves players who are very savvy about selling.
Food for thought.
Crucial Week For the Dollar
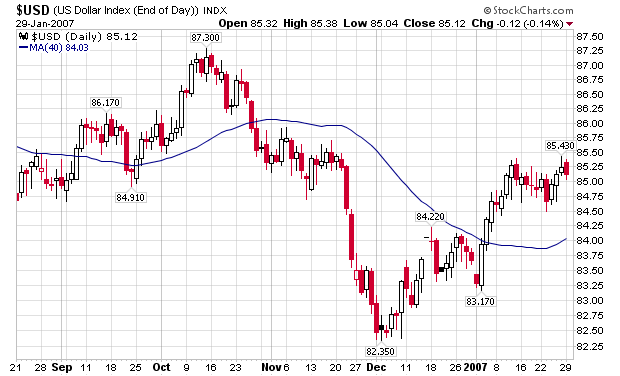
Here's a daily chart of the dollar from Stockcharts:
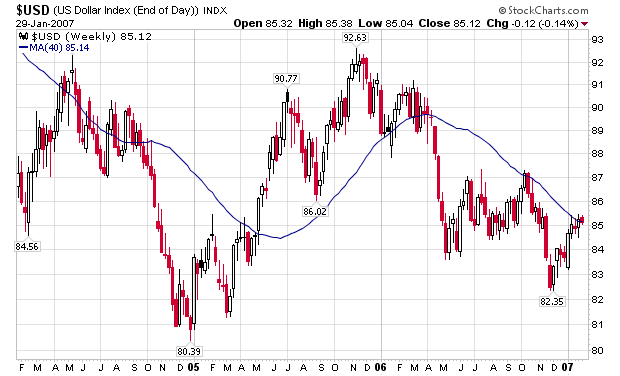
It's up 3.75% since early December. The main reason for the increase is encouraging economic news from the US. Since early December there has been a fair amount of speculation that the housing market has stabilized, job growth has been good, unemployment is low and the "official" retail numbers from the Census Bureau were decent. The Fed's official statements have all said they are still concerned about inflation, implying interest rates aren't coming down soon. All of this has helped the dollar increase in value. But is this a "real" rally, or is it a bear market suckers rally? Here's a weekly chart of the dollar:
The dollar chart has breached resistance at the 84 and 84.5 level. These are both technically strong developments that should encourage traders. While the last 4 bars have been weak, we can interpret those bullishly as the calm below the storm of this week's economic news or bearishly as overall market hesitancy.
Most importantly, the current rally is slightly above the 50% Fibonacci retracement level (84.82) of the October to December sell-off. This should have the bears ready to pull the short trigger on adverse news.
In addition, we have some important economic news this week -- payrolls, an FOMC meeting announcement on Wednesday and preliminary 4th quarter GDP. In order of importance, I would place the FOMC meeting first as interest rate policy is still a very important factor for currency traders. I would follow that with 4th quarter GDP because a perceived US slowdown combined with a perceived European and Japanese rebound were primary drivers of the October to December sell-off. Third I would place payrolls.
Theshort version?
"This week is make-or-break week for the U.S. dollar," said Kathy Lien, chief fundamentals analyst, at Forex Capital Markets in New York.
"The foreign exchange market has turned very dollar-bullish after a series of upside surprises in economic data, causing a sharp plunge in rate cut expectations," she added.
Mortgage Problems hit GMAC
From Seeking Alpha:
Expect to see more news like this over the next year. More and more lenders have gotten into the mortgage game. More and more sub-prime mortgages are moving into foreclosure at a faster pace.
GM's announcement last Thursday that it is delaying its Q4 earnings report illustrates the effect the travails of the U.S. mortgage market have had on GMAC Financial Services, a lending unit GM divested in November. Cerberus Capital Management purchased 51% of GMAC for $14 billion, but there is some question whether the $14.4 billion tangible NBV ascribed to GMAC at the time was appropriate. At particular issue is GMAC's ResCap mortgage unit, which has suffered the same pressures that have hurt lenders throughout the industry. Lehman Brothers auto analyst Brian Johnson estimates that "complications" at ResCap could cost GM $300-400 million in cash charges in H1. A substantial payout to Cerberus could be a great strain on GM as it struggles to maintain liquidity and fund its restructuring. GM is planning to restate results from 2002 through Q3 2006 because of overstatements of deferred-tax liabilities. The company is forecasting a profitable Q4 with record revenue and says it ended 2006 with $26.4 billion in cash.
Expect to see more news like this over the next year. More and more lenders have gotten into the mortgage game. More and more sub-prime mortgages are moving into foreclosure at a faster pace.
Sunday, January 28, 2007
Fed President Lacker Gets the Wage Picture Right
From a 19 January speech:
Let me add a footnote here regarding wage rates and the inflation outlook. Some observers have viewed robust wage growth as a cause of inflationary pressures; I do not share that view. We can have healthy wage growth without inflation as long as we see commensurate growth in labor productivity. In fact, over time, real (inflation-adjusted) compensation tracks productivity growth fairly well, though they do not move in lockstep from quarter to quarter. I would note that the rate of growth of productivity shifted higher beginning in the middle of the 1990s, and while productivity is hard to forecast, I believe that reasonably strong productivity gains will continue and will warrant reasonably strong real wage gains. What would concern me – and we have not seen this as yet – would be a persistent increase in wage growth that was not matched by a commensurate increase in productivity growth. Ultimately this would result in higher inflation.
10-Year Treasury at 5-month Highs
From Bloomberg
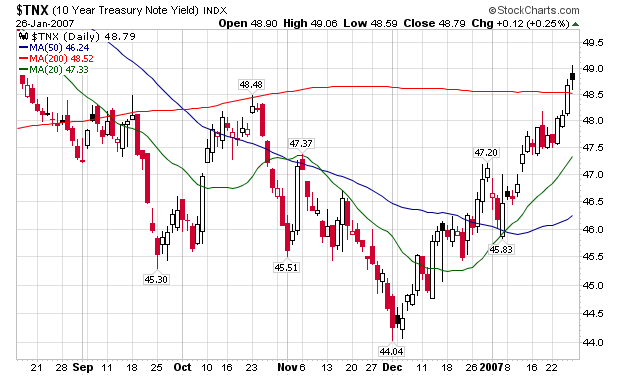
For the last few months, talk of an interest rate cut has dominated trader's talk. I have speculated that an interest rate cut was off the table for now, largely based on numerous Federal Reserve speeches that said inflation was still too high. The Treasury market appears to share that view as the chart of the 10-year Treasury indicates:
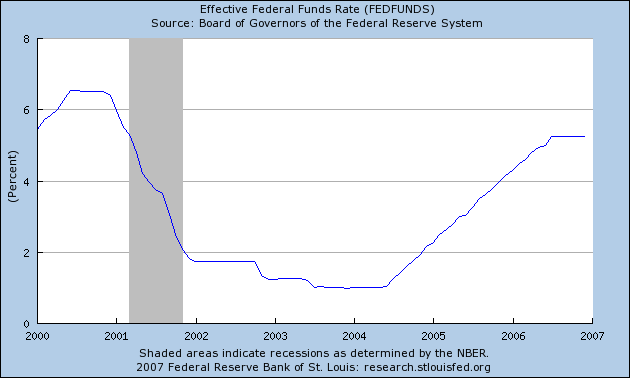
Interest rate policy is the prime driver of the current expansion. Here is a chart from the St. Louis Fed of the effective Federal Funds rate:
The Fed lowered interest rates to 0% (after adjusting for inflation) by early 2002. Conventional economic thinking says it takes 12-18 months for interest rate changes to work their way through the economy. That would mean the last of massive cuts in 2001 fully hit the economy in early 2003 which is when overall GDP kicked into higher gear.
Now we have a Fed that is very concerned about inflation, as they have said so in a unified voice in their public speeches. Several non-official inflation measures (from the Cleveland and Dallas Fed) confirm inflation is still higher than the Federal Reserve would like. Therefore, a rate cut is still off the table, barring new economic numbers that work against that thesis.
So -- what does this mean going forward?
1.) Housing: We started to see better housing numbers in the last part of 2006. This is also when we saw interest rates drop. Therefore, don't be surprised if housing numbers fail to impress in the next few months.
2.) Borrowing costs are still historically low: 5% for capital is still cheap by historical standards. Therefore, don't expect a big dent in all of the M&A activity we have been seeing over the last half of 2006.
3.) The overall effect on consumer spending is a wild card. Pay is increasing, but consumers may want to allocate those increases to the record high debt payment level they currently have rather than spending on consumer goods. Also, the Christmas season was fair but not great, indicating consumer spending may already be slowing down.
Treasury 10-year note yields rose to the highest level since August this week after government bond sales drew weaker-than-expected demand and industry reports suggested the worst of the housing slump may be over.
Investors demanded higher returns on the $41 billion of securities sold as compensation for concern a strengthened economy will raise the threat of inflation. New- home sales rose more than expected and existing-home sales stabilized, the U.S. Commerce Department reported.
The government bond market has ``just been beaten down very hard,'' said Scott Gewirtz, head of Treasury trading at Lehman Brothers Inc. in New York, one of the 22 primary U.S. government securities dealers that trade with the central bank.
The yield on the benchmark 10-year note rose 10 basis points, or 0.10 percentage point, to 4.88 percent, according to bond broker Cantor Fitzgerald LP. It touched 4.90 percent yesterday, the highest since Aug. 16. The price of the 4 5/8 percent security maturing in November 2016 fell 24/32, or $7.50 per $1,000 face value, to 98 1/32.
For the last few months, talk of an interest rate cut has dominated trader's talk. I have speculated that an interest rate cut was off the table for now, largely based on numerous Federal Reserve speeches that said inflation was still too high. The Treasury market appears to share that view as the chart of the 10-year Treasury indicates:
Interest rate policy is the prime driver of the current expansion. Here is a chart from the St. Louis Fed of the effective Federal Funds rate:
The Fed lowered interest rates to 0% (after adjusting for inflation) by early 2002. Conventional economic thinking says it takes 12-18 months for interest rate changes to work their way through the economy. That would mean the last of massive cuts in 2001 fully hit the economy in early 2003 which is when overall GDP kicked into higher gear.
Now we have a Fed that is very concerned about inflation, as they have said so in a unified voice in their public speeches. Several non-official inflation measures (from the Cleveland and Dallas Fed) confirm inflation is still higher than the Federal Reserve would like. Therefore, a rate cut is still off the table, barring new economic numbers that work against that thesis.
So -- what does this mean going forward?
1.) Housing: We started to see better housing numbers in the last part of 2006. This is also when we saw interest rates drop. Therefore, don't be surprised if housing numbers fail to impress in the next few months.
2.) Borrowing costs are still historically low: 5% for capital is still cheap by historical standards. Therefore, don't expect a big dent in all of the M&A activity we have been seeing over the last half of 2006.
3.) The overall effect on consumer spending is a wild card. Pay is increasing, but consumers may want to allocate those increases to the record high debt payment level they currently have rather than spending on consumer goods. Also, the Christmas season was fair but not great, indicating consumer spending may already be slowing down.
Subscribe to:
Posts (Atom)