Saturday, March 15, 2008

What Inflation?

From the AP

If you think the cost of gassing up your car is outrageous, wait until you need to restock your pantry.

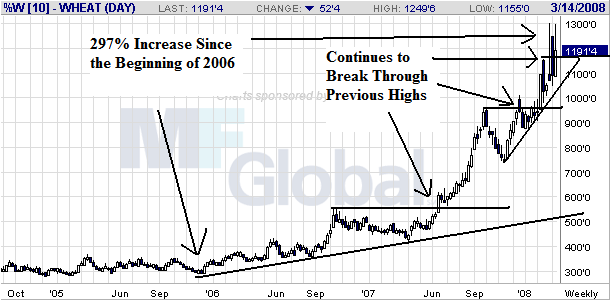
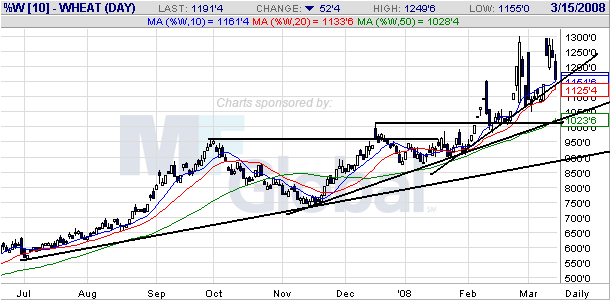
The price of wheat has more than tripled during the past 10 months, making Americans' daily bread -- and bagels and pizza and pasta -- feel a little like luxury items. And baked goods aren't the only ones getting more expensive: Experts expect some 80 percent of grocery prices will spike, too, and could remain steep for years because wheat and other grains are used to feed cattle, poultry and dairy cows.

"It's going to affect everything ... impact on every section of the grocery store," said Michael Bittel, senior vice president of King Arthur Flour Co. in Norwich, Vt.

.....

The wheat market has been pushed higher by a combination of agricultural, financial and energy issues.

Poor wheat harvests in Australia and parts of Europe and the U.S. have caused China and other Asian countries to buy up more American crops, which are especially attractive because of the weak U.S. dollar.

At the same time, the American crop is shrinking because of federal incentives to grow corn for ethanol.
And skyrocketing gas prices make it costlier to get any wheat to market. Those same pressures have also made it more expensive to supply feed grains for livestock.

.....

Wheat historically trades at $3 to $7 a bushel.

But this week, futures of spring wheat -- which produces the flour used in hearth breads, rolls, croissants, bagels and pizza crust -- were close to $18 a bushel on the Minneapolis Grain Exchange. They climbed as high as $24 in late February.


From the AP:

The rally in energy prices gained momentum Friday, with retail gas prices rising further into record territory and diesel and heating oil futures setting records of their own amid concerns about strong global demand and tight supplies.

Crude oil prices fell modestly as a sharp downturn in the stock market and worries about the economy prompted some profit-taking. But with the Federal Reserve expected to cut interest rates again next week, analysts expect the dollar to weaken further, propelling crude to new records.

At the pump, gas prices set records for the fourth straight day, rising 1.3 cents Friday to a national average price of $3.28 a gallon, according to AAA and the Oil Price Information Service. Average prices are nearing $4 in some parts of Hawaii.

Diesel, meanwhile, rose 2.9 cents to a new record national average of $3.938 a gallon. Heating oil, a fellow distillate and close cousin of diesel, jumped to new records on the New York Mercantile Exchange.

Diesel, used by trucks, trains and ships, is used to move the vast majority of the world's goods. While the U.S. economy appears to be slowing, the global economy continues to grow.

"Demand for diesel worldwide has been incredible," said Phil Flynn, an analyst at Alaron Trading Corp., in Chicago.

April heating oil futures rose 2.17 cents to settle at a record $3.1465 a gallon after earlier setting a new trading record of $3.222 a gallon.


From This Week in Petroleum:

Gasoline prices rose in all regions of the country, with the U.S. average retail price reaching its highest point in history, 322.5 cents per gallon. That was an increase of 6.3 cents from the previous week and 66.6 cents more than the price a year ago. Prices on the East Coast increased by 2.6 cents to 319.4 cents per gallon, 66.1 cents per gallon more than the price last year. Once again, the average price in the Lower Atlantic was at an all-time high increasing by 3.1 cents, to 320.8 cents per gallon. Unlike last week when the Midwest was the only region of the country where the average price was unchanged, this week the price there surged by 11.1 cents to 319.1 cents per gallon, up by 70.4 cents per gallon from a year ago. The Gulf Coast average gasoline price shot up by 4.3 cents to 313.1 cents per gallon, the highest price in history for the region and 3.9 cents per gallon above the previous record reached May 21, 2007. Although the price in the Rocky Mountains increased by 2.1 cents, to 310.9 cents per gallon, the average price there was the lowest of any region. The average price on the West Coast remained the highest of any region in the country, jumping 7.1 cents to a reach a new all-time high for the second week in a row. The average price of 345.7 cents per gallon was 53.7 cents higher than a year ago. In California, the average price for regular grade jumped by 7.8 cents to 353.7 cents per gallon. While this was just 46.9 cents above the price a year ago, it surpassed the previous all-time high price set May 7, 2007 by 7.6 cents.

For the fourth week in a row, the U.S. average retail diesel price continued its rapid rise surging up by 16.1 cents to 381.9 cents per gallon, and reaching an all-time high for the third consecutive week. The price was 113.4 cents above the price a year ago. On a regional basis, prices remained at all-time high levels in all regions of the country. On the East Coast, the average price shot up 17.0 cents to 387.0 cents per gallon, 120.1 cents per gallon above last year. In the Midwest, the price jumped by 14.5 cents to 378.4 cents per gallon, up by 111.1 cents from a year ago. The price in the Gulf Coast surged, shooting up by 18.9, to reach 379.8 cents per gallon, the largest increase of any region. Once again, the average price in the Rocky Mountains remained the lowest of any region. Nonetheless, the price there jumped up to 373.2 cents per gallon, an increase of 15.9 cents, 99.6 cents per gallon above last year. On the West Coast, the average price shot up by 14.9 cents to 388.5 cents per gallon, 107.4 cents above the price a year ago. The average price in California grew by 15.2 cents to 395.5 cents per gallon, 105.6 cents higher than last year.
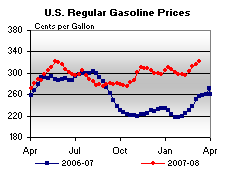
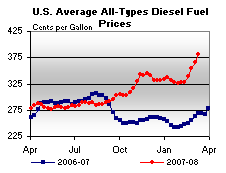

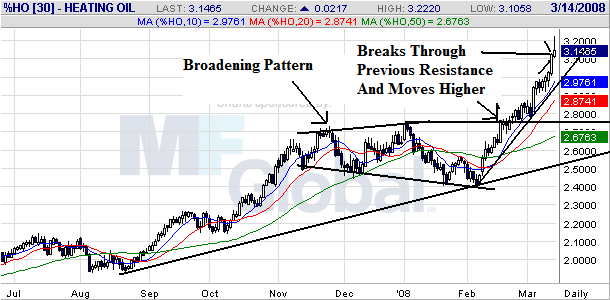
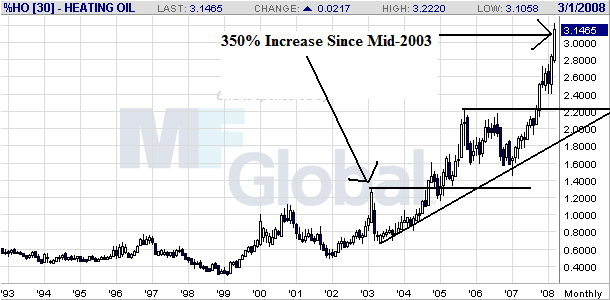


This week the Federal Reserve is widely expected to lower interest rates again. This will have a negative impact on the dollar's level which is already depressed. Expect more price spikes in any commodity priced in dollars.

Friday, March 14, 2008

Weekend Weimar and Beagle

I'm posting this a bit early, but I'm off to get my engagement picture taken with the future Mr$. Bonddad. I also have an announcement to make. Because of my upcoming wedding and the fact that I'm in graduate school, I'm going to take the weekends off through at least mid-May. I'm just getting crunched on time over the weekend and every little bit helps.

I'll be back on Monday. Until then

This is me pinned by a Beagle


This is Kate in the "Weimar spot" on the counch


This is Sarge sleeping

Bernanke Shows Socialist Tendencies

From Bloomberg:

Bear Stearns Cos. shares plummeted a record 53 percent after the New York Federal Reserve and JPMorgan Chase & Co. stepped in to rescue the fifth-largest U.S. securities firm with emergency funding.

After denying earlier this week that access to capital was at risk, Bear Stearns said today that its cash position had ``significantly deteriorated'' in the past 24 hours. The New York Fed agreed to provide financing through JPMorgan for up to 28 days, the bank said in a statement today.

The regulator stepped in to prevent the collapse of the second-biggest underwriter of U.S. mortgage bonds and forestall a potential market panic as losses by banks and brokers reached $195 billion and stocks plunged for a third day this week. JPMorgan, which has suffered fewer losses than rivals during the credit crisis, may end up owning all or part of Bear Stearns, analysts speculated.

``I don't think they can afford to let Bear go,'' said Charles Geisst, the author of ``100 Years on Wall Street,'' referring to the New York Fed bailout. ``At this particular moment in time, it would be a devastating blow to the markets.''

Bear Stearns acted in response to ``market rumors'' of a liquidity crisis, Chief Executive Officer Alan Schwartz said in a separate statement. He said earlier this week that the company's ``liquidity cushion'' was sufficient to weather the credit-market contraction. Traders have been reluctant to engage in long-term transactions with Bear Stearns as the counterparty, the Wall Street Journal reported yesterday.


1.) Earlier this week, Bear Stearns denied there were any problems. We know how reliable those statements were. Can we now please assume that any representative of a financial company who says things are fine is lying? It really would make life a great deal easier.

2.) Yesterday, S&P announced that the big banks were near the end of their writedowns. They also said the US can win a land war in Asia.

3.) Bear did this to themselves. They got involved in the mortgage backed market of their own free will. They obviously made some incredibly stupid choices and decisions. They should be allowed to fail, plain and simple.

The only way to prevent this mess from happening again is to let some of the big banks fail. Then in the future when someone says, "let's stop performing due diligence on borrowers" someone can respond with, "Bear Stearns tried that and they went belly up." Now in 10 years, someone will say, "Let's stop performing due diligence" someone will respond with "that's a great idea. After the borrowers default, the Federal Reserve will bail us out."

A Quick Note on Today's Markets

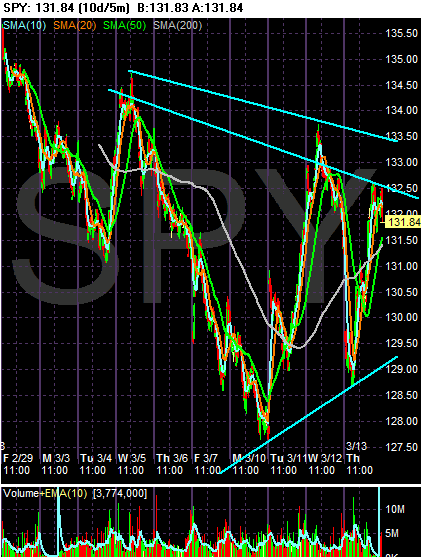
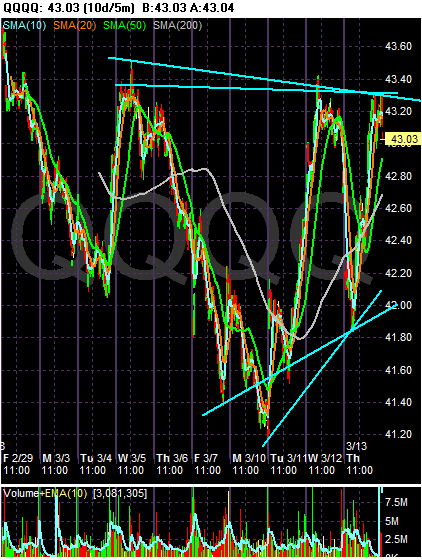
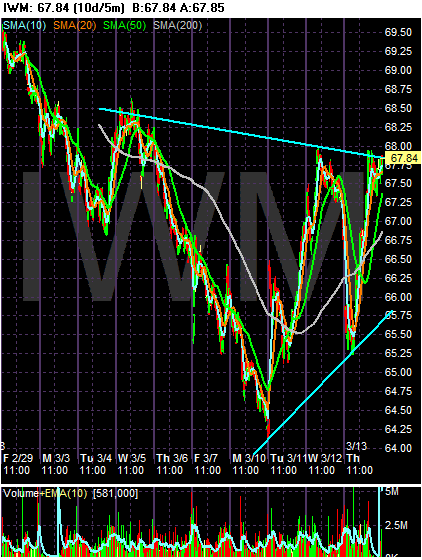
Below are three 10-day charts of the averages in 5-minute increments. Notice that all three appear to be consolidating.

In addition, consider this passage from today's IBD:

Since marking a new low in below-average volume Monday, the Nasdaq has avoided sinking beneath that 2168 level. A 4% pop Tuesday kicked off a new attempted rally, fueled by the Fed's $200 billion plan to trade high-quality Treasuries for subprime debt.

Thursday was Day 3 of the rally attempt. Should the indexes surge to big gains in increased volume Friday and beyond, that would mark a follow-through day, which confirms that a rally is under way.

The past two follow-through days, however, have gone nowhere.

One secondary factor that has changed, though, is the Accumulation/Distribution Ratings for the indexes. The past two failed follow-throughs did not have a major index with a rating of B- or better.

The Aug. 29 follow-through, which worked, had a B+ in Accumulation for the Nasdaq. The composite now has a B- rating.

Another factor that has changed is the surge in bearish newsletters. For the first time since October 2002, the ultimate bottom of the bear market, bears outnumbered bulls in the weekly Investors Intelligence survey. That crossover often occurs near a bottom, though it's not a precise timing tool.


Consumer Spending Drops

From the WSJ:

Retail sales decreased by 0.6%, the Commerce Department said Thursday. Sales went up a revised 0.4% in January. Sales that month were originally seen rising 0.3%. Sales in December dropped 0.7%.

Economists surveyed by Dow Jones Newswires estimated a 0.1% increase in February retail sales.

The sales report is a key indicator of U.S. consumer spending. Consumer spending makes up about 70% of gross domestic product, the broad measure of economic activity in the U.S.

High prices for gasoline, the credit crunch, falling home values and drops in other asset prices are seen as factors depressing spending. Another worrisome sign for spending -- and the economy -- is a soft job market. Non-farm payrolls declined by 63,000 jobs in February, the government reported last Friday, an omen that raised chatter about recession.


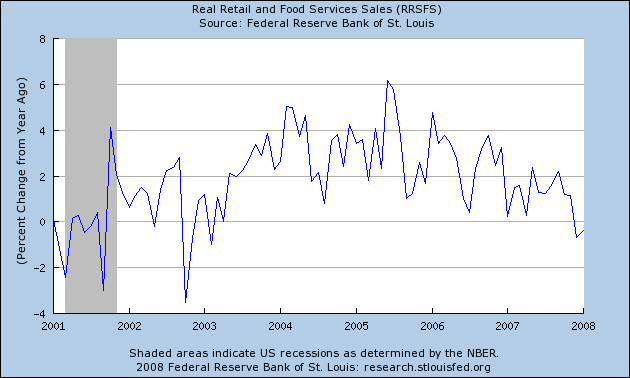
Above is a chart of real (inflation-adjusted) retail sales from the census bureau. Notice the clear downward sloping trend, indicating consumers have been backing away from the market for some time. Also note the year over year change moved into negative territory with yesterday's release.


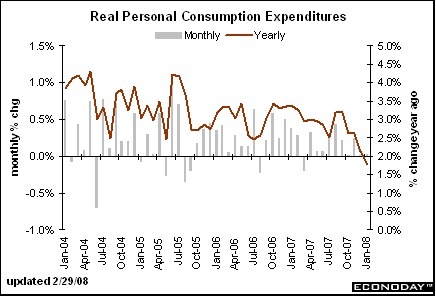
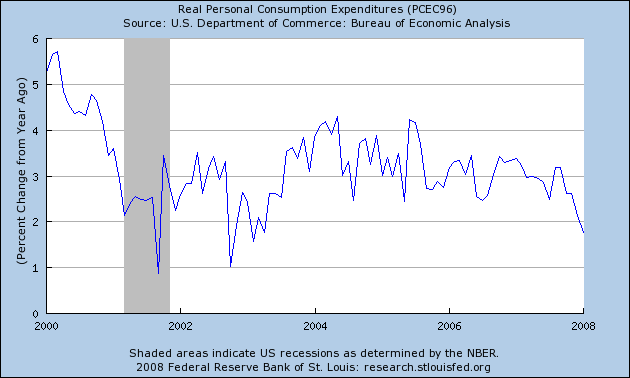
Above is a chart of real personal consumption expenditures from the Bureau of Economic Analysis. This is a broader measure of spending -- it includes things like medical care, housing expenses etc.... This number was in a fairly constant range until roughly the end of last summer. Then it started dropping and has been dropping ever since.

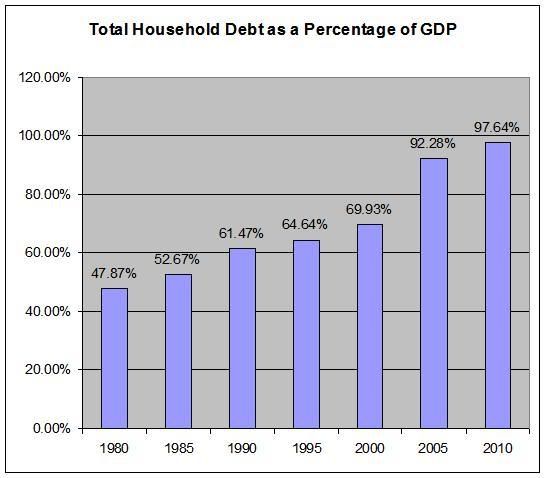
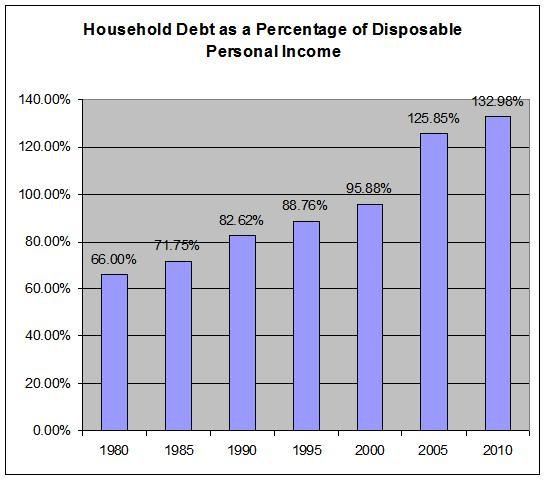
There are two charts that I use a great deal: consumer debt as a percentage of GDP and consumer debt as a percentage of disposable income. And here they are again:


Simply put, there is a ton of debt out there. And it appears it may be getting in the way.

I'm going to add two more charts to the mix. The first is from the blog Calculated Risk.


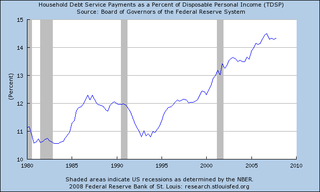
This is a calculation of the mortgage equity withdrawal using the Kennedy Greenspan method. It shows a clear drop in the amount of home equity consumers are pulling out of their homes. One reason may be the increasing percentage of debt payments as a percentage of disposable income:


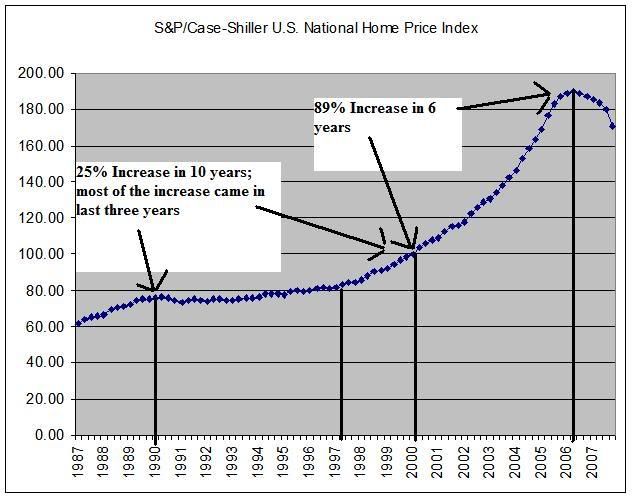
Another reason may be that home prices are dropping:


Regardless of the reason, the bottom line is people are clearly cutting back on thier debt acquisition. And considering incomes have been stagnant for quite some time:


People may simply be saying "I can't afford this" anymore.

What Inflation?

From yesterday's import prices news release:

Import prices ticked up 0.2 percent in February following a 1.6 percent increase in January. The index advanced 13.6 percent over the past year. Petroleum prices fell for the second time in three months in February, declining 1.5 percent after rising 4.8 percent in January. Prices increased 60.9 percent for the year ended in February. Nonpetroleum prices advanced 0.6 percent in February after a 0.7 percent increase the previous month. The price index for nonpetroleum prices was up 4.5 percent over the past 12 months.


Nothing to see here at all.

Gold Crosses $1000/Ounce

From Marketwatch:

Gold futures broke above the psychologically key level of $1,000 an ounce Thursday, propelled by ongoing dollar weakness and bleak news from the financial sector.

Early Thursday, gold for April delivery soared to a record high of $1,001.50 an ounce on the New York Mercantile Exchange. This was the first time that gold surpassed $1,000 an ounce. Graphic: Timeline of gold's march to $1000.

Later in the session, the gold contract gave up some of its gains and ended up $13.30 at $993.80 an ounce.

"Today's spike will likely become known as the Carlyle/Drake rally," said Jon Nadler, senior analyst at Kitco Bullion Dealers, in a research note.


This is the clearest sign that investor's inflation expectations are very high right now -- and getting higher.

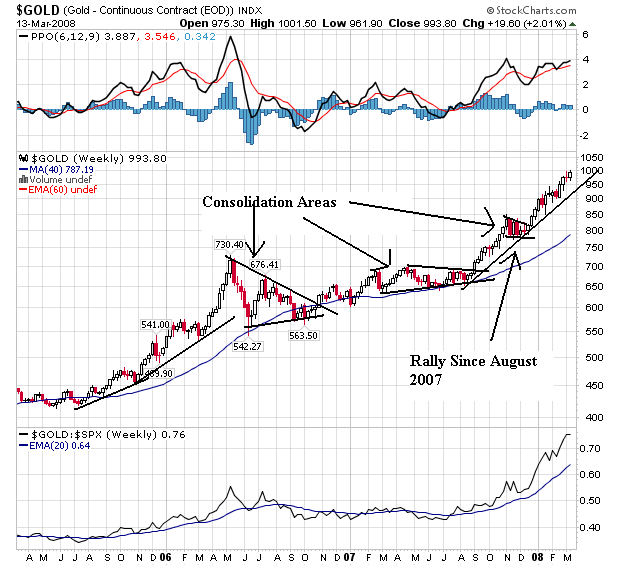
Let's take a look at the charts.


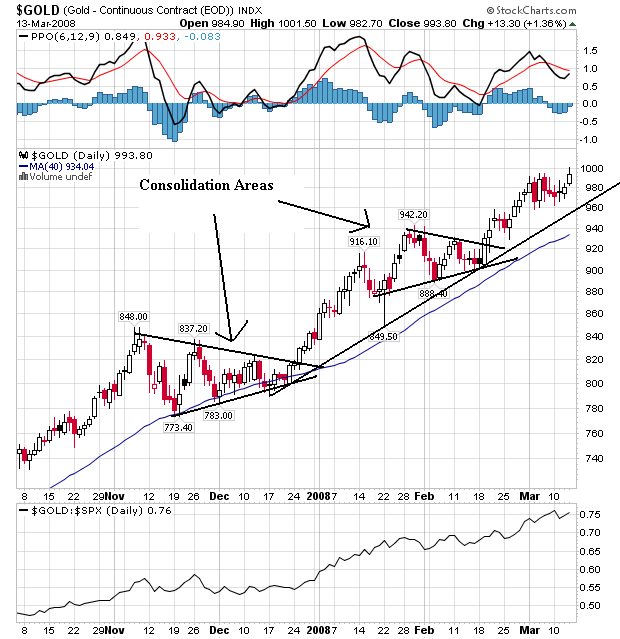
This is a very bullish chart. Notice there aren't any severe price spikes. Instead we have two areas of rising prices -- roughly mid-2005 to mid-2006 and mid-2007 onward -- with a period of price consolidation between them. Also note that prices are consolidated several times. This is a very orderly rise.


On the daily chart notice again the very disciplined price rise occurring. Prices move, consolidate for at least a month, and then continue to move higher. It's going to take a lot to break this cycle.


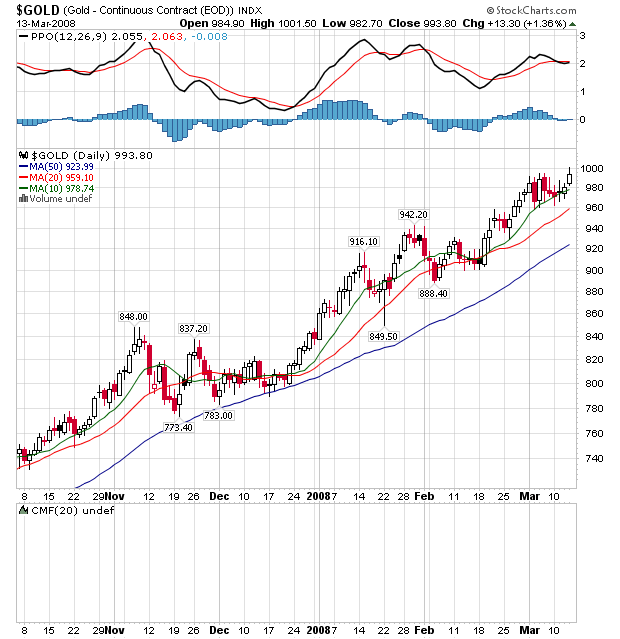
On the daily SMA chart, notice the following

-- Prices have been using the SMAs as support for the last few months

-- The shorter SMAs are above the longer SMAs

-- Prices right now are above the SMAs

-- All the SMAs are moving higher.

Thursday, March 13, 2008

Today's Markets

One heck of a turnaround in the market today.


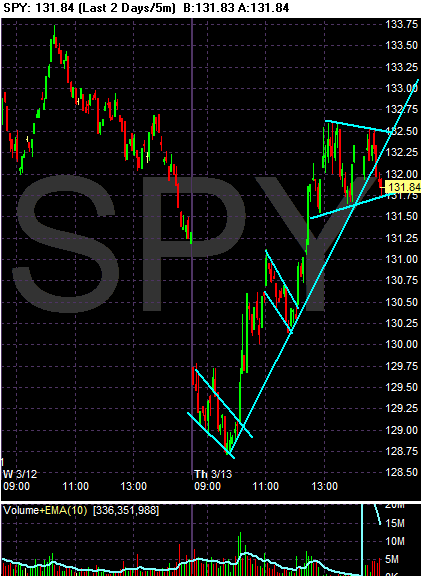
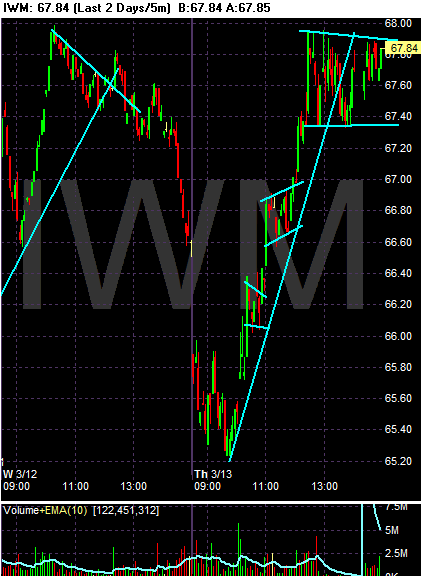
The SPYs gapped lower at the open, but spent most of the day rallying back. In all, the market moved about three points from open to close. Note there are several bull market pennant consolidation patterns. Also note the market ended in either a pennant pattern or a double top.


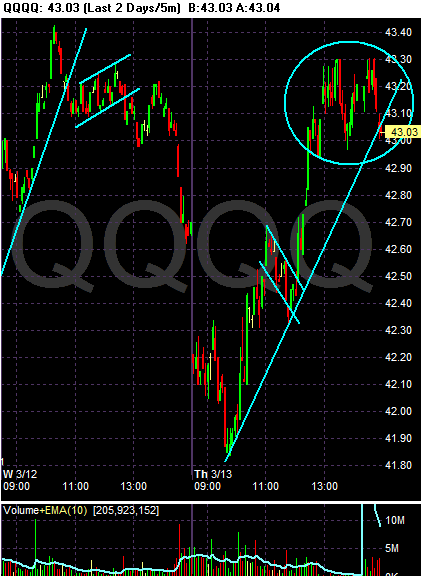
Like the SPYs, the QQQQs had an amazing turnaround today, especially considering where they opened. Again, notice the strong rally, and a few pennant patterns. Also note a possible double top at the end of the trading day.


On the IWMs, there really isn't much different to note, except to note the market moved a total of 2.64 points.

S&P Provides Comic Relief

From CNBC:

Standard & Poor's helped stocks rebound by saying that an end to subprime mortgage writedowns is in sight for large financial institutions.

The market also was cheered by new legislation unveiled in the House that would facilitate the buying up of distressed mortgages with the help of the Federal Housing Administration.

S&P said subprime writedowns could reach $285 billion, though it added that some writedowns are larger than any reasonable estimate of actual losses. A company typically takes a writedown when it expects to post a loss from a particular line of business, though the amount is often just an estimate.

"We believe that the largest players, such as Merrill Lynch & Co Inc and Citigroup have rigorously and conservatively valued their exposures to subprime asset-backed securities such that most of the damage should be behind them,'' S&P said in a statement.


This is the same Standard and Poor's that give AAA ratings to a bunch a crap.

The Weakening Dollar and Commodity Prices

From IBD:

Analysts name the weak dollar as one of the reasons for the hot money that has flooded commodities this year. Since raw materials are basically traded in the U.S. currency, any weakening of the currency is usually followed by an upward adjustment in prices.

Economists have said that if the dollar were to strengthen, and the ailing U.S. stock market to rebound as well, some of the money in commodities could return to currency and equity markets. So far there's been little evidence of that happening, even with Tuesday's Federal Reserve plan to provide $200 billion to cash-starved credit markets.


One of the drawbacks of having the dollar be the currency in which most commodities are priced is the dollar's value has a strong correlation to the price of commodities. When the dollar drops in value, commodities become less valuable; they need to increase in price to simply tread water value wise.

This is one of the reasons why the Fed's rate cuts are so incredibly dangerous. As the Fed cuts rates, the dollar become less attractive. One of the reasons people invest in a country is the rate of return they can get on the assets they park in bank accounts. So right now traders are looking to the rate cuts and saying, "rates are higher somewhere else." Add to that the overall condition of the US economy, and you have a place people don't want to invest right now. Therefore, dollar demand drops as does the dollar's price.

Bernanke has obviously decided he can live with a higher inflation rate. But the big problem is how far out of control can you let inflation go before you have to play catch-up?

Where The Market Stands

From the WSJ:

For a second straight day, the Fed's plan to allow banks and bond dealers to swap mortgage-backed securities that they can't currently sell for highly liquid Treasurys affected financial markets. After the move was announced Tuesday, the Dow posted a gain of nearly 417 points, its biggest single-day jump in more than five years.
After such a large move, stocks typically enjoy a mix of follow-through buying, turnaround selling by investors looking to book a quick profit and, in general, a round of reflection among participants trying to figure out how the long-term underpinnings of the market have shifted.


The last paragraph is an excellent summation of where the market is right now. The Fed changed the underlying rules of the game; they said they would once again add a ton of liquidity to the financial system in an attempt to unlock the credit markets. Before that announcement all of the averages were headed lower. Now traders are wondering, "will this latest move really do anything meaningful to change the underlying situation or not?"

Remember the Fed has been acting aggressively for some time. This is not the first liquidity injection. In addition, they have been cutting rates. But the economic news has continued to worsen. While it takes up to 18 months for interest rates cuts to work their way through the economy (meaning the total impact of the first cuts won't be completely felt until the fourth quarter) traders are an impatient lot; they want their good news now.

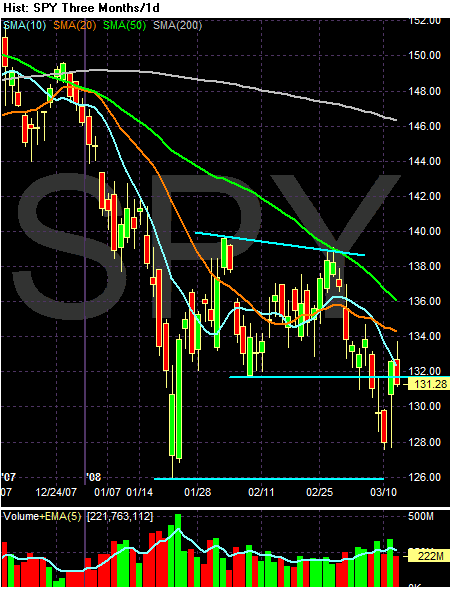
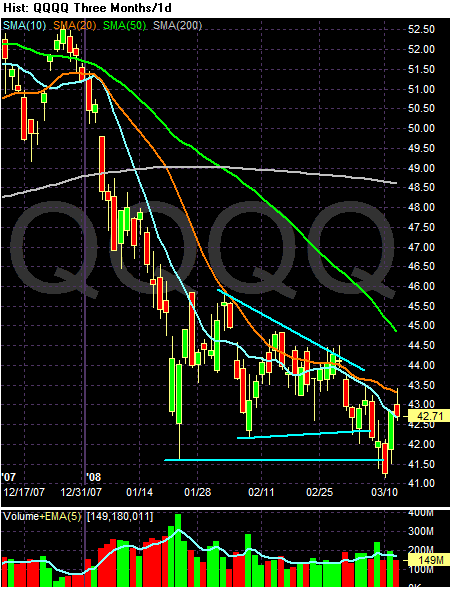
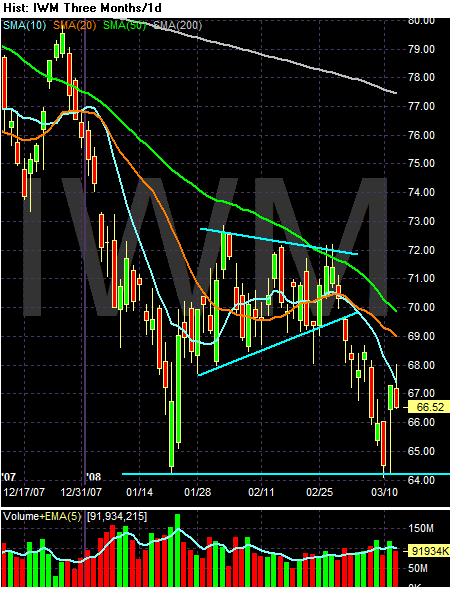
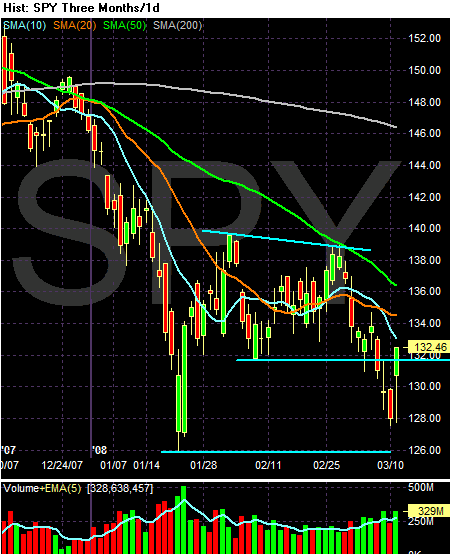
Let's see where the daily charts stand after the Feds announcement


Yesterday, the SPYs bounced off the 10 day moving average and also fell below the price level established in early February. But the volume wasn't extremely heavy, indicating this was not a panic sell-off.


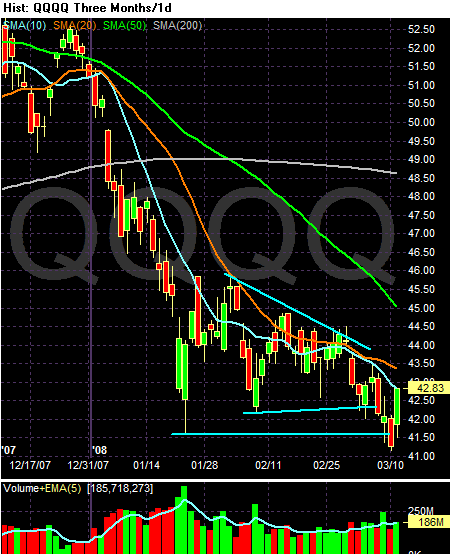
On the QQQQs, notice that:

-- Prices are between the 10 and 20 day SMAs, having had a nice one day bounce. But

-- All the SMAs are moving lower

-- The shorter SMAs are below the longer SMAs


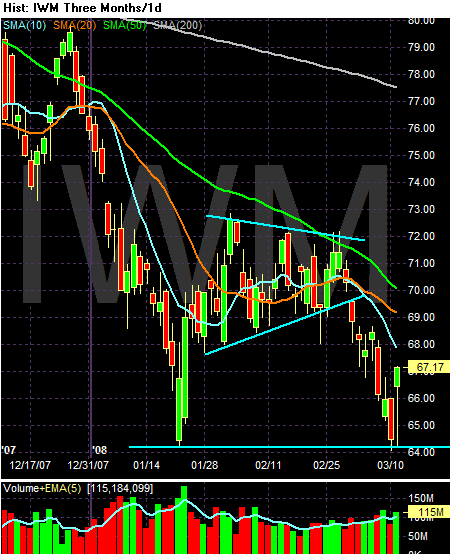
On the IWMs, notice that:

-- Prices are below the 10 day SMA, bouncing off this level yeaterday

-- All the SMAs are moving lower

-- The shorter SMAs are below the longer SMAs

Yen Rising

From the WSJ:

The dollar plummeted to below ¥100 for the first time since 1995 and hit record lows versus the euro and the Swiss franc in Asia Thursday, as suspicions grew that the latest attempt by central banks to save the sliding U.S. economy won't work.

Market participants ranging from hedge funds to bankers to Japanese exporters sold the dollar for yen, sending it as low as ¥99.77 on the EBS trading platform, before bouncing back to ¥100.18. That was the lowest level since ¥99.94 on Nov. 10, 1995.

The dollar also sank to all-time lows of $1.5587 per euro and 1.0090 versus the Swiss Franc. Against the British pound, the U.S. currency fell to $2.0321 -- the lowest since Dec. 14, 2007.

The dollar fell so quickly that Japan's finance minister and his top subordinate warned the markets against causing "excessive" moves in the dollar-yen rate -- a language that indicates they are increasingly concerned about the rising yen damaging Japan's slowing economy.


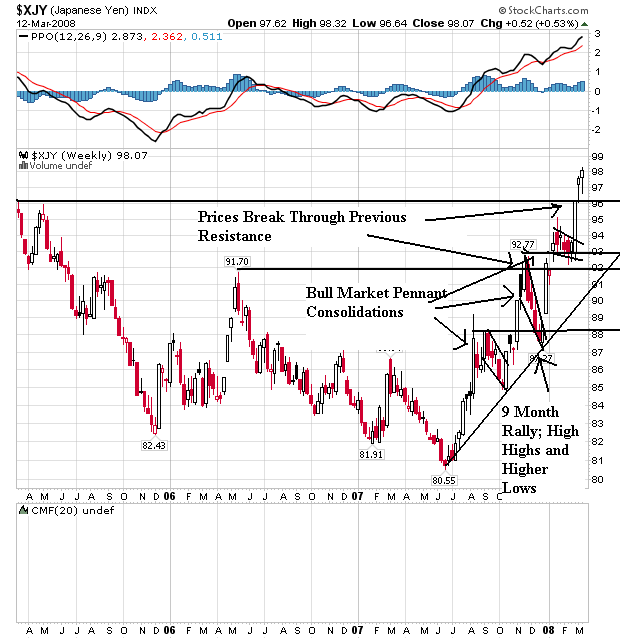
On the weekly yen chart, notice the following:

-- Prices made a preliminary bottom in late 2006 and then made a stronger bottom in mid-2007.

-- Since the bottom in 2007 the yen has risen about 20%.

-- The upward move of the last 9 months is at a sharp angle

-- Prices continually broke through previous resistance levels.


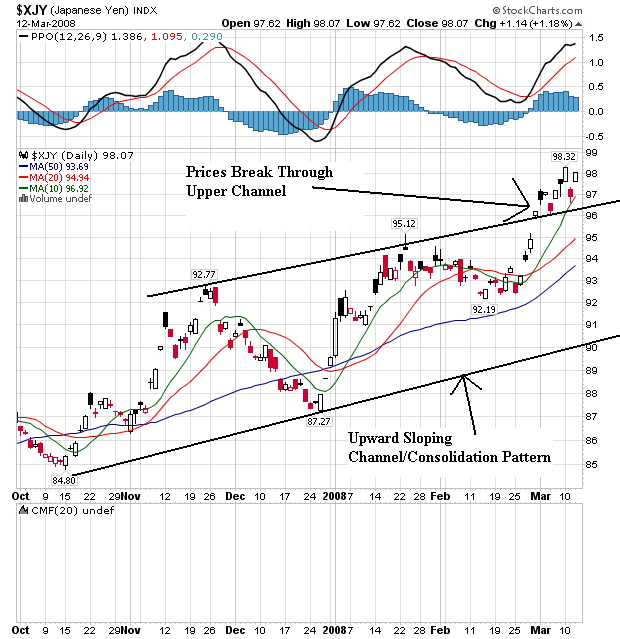
On the daily chart, notice the following:

-- Prices just spent about 4 1/2 months in an upward sloping consolidation pattern.

-- Prices are using the 10, 20 or 50 day SMA as support

-- Notice the orderly rise and fall of prices; there aren't any sudden moves in either direction. This is a market that so far knows where it wants to go.

-- Prices are in a higher higher, higher low pattern right now.

Wednesday, March 12, 2008

A Closer Look at the Transports

I haven't talked about Dow Theory in awhile. Dow theory is one of those really, common sense theories. It goes like this. If the economy is doing well, companies will have to ship more and more stuff from point A to point B. This will benefit the transport sector. The converse is also true. If the economy isn't doing well, companies will ship less and less stuff from point A to point B. This will hurt the transport sector, leading to lower earnings.


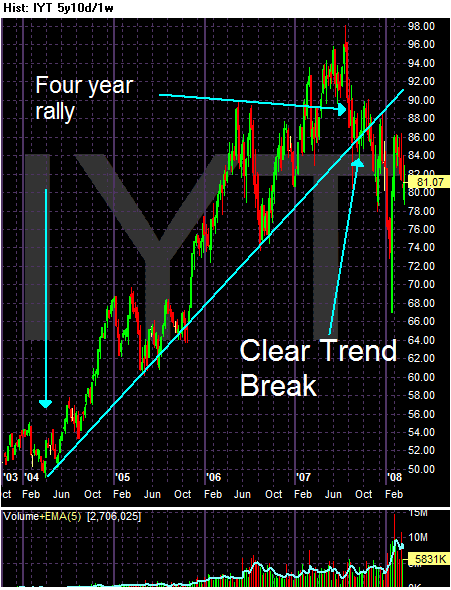
On the five year chart, notice the following:

-- The transports were in a clear 4 year uptrend until about 2/3 of the way through 2007.

-- There is a clear trend break last fall.


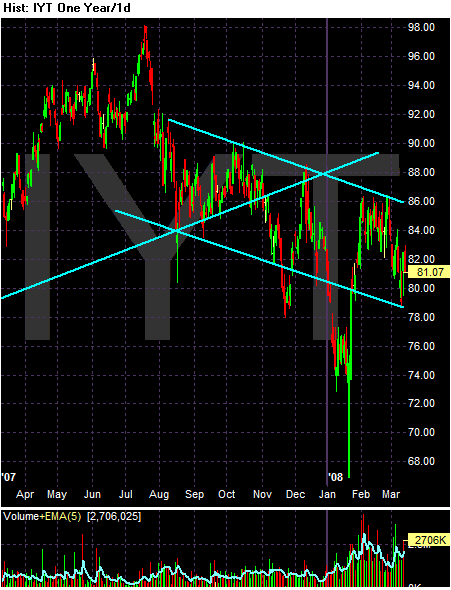
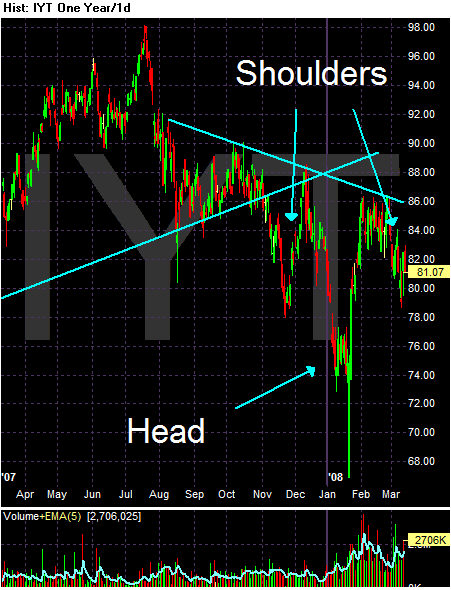
Above is a closer look at the trend break. This is one of the ways to look at the chart -- a downward sloping channel with some extreme price swings.


Another way to look at it is as a head and shoulders formation. However, a head and shoulders formation is considered a reversal formation. I don't thing the fundamental backdrop warrants thoughts of a price rebound right now.


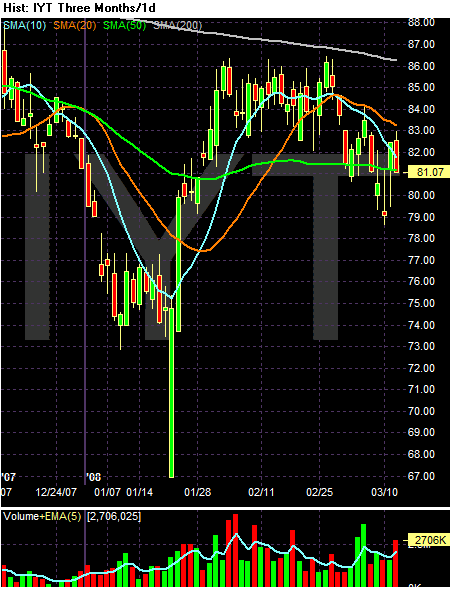
On the 3-month, SMA chart, notice the following:

-- Prices are below the 200 day SMA which is bear market territory

-- The 200 day SMA is heading lower

-- Prices and the 10, 20 and 50 day SMA are bunched up, indicating no clear direction.

-- Prices have been in about a 7-8 point trading range (79 - 86) for the last month or so. That's a very tight range.

Today's Markets

How quickly the market forgets....


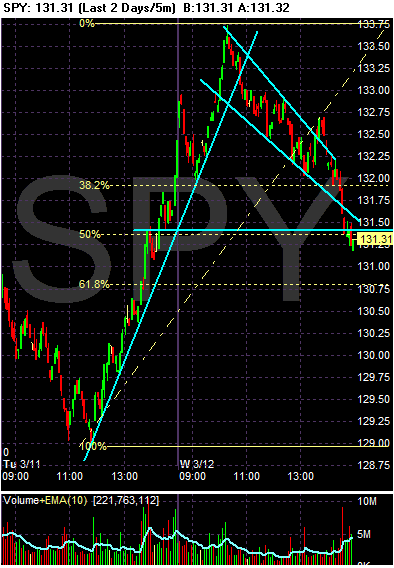
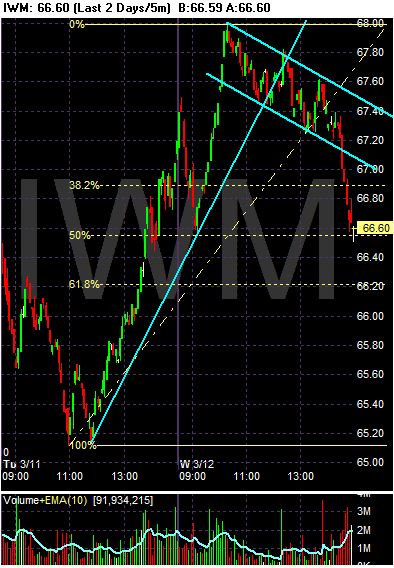
The SPYs rose through the early morning, but retreated before lunch and continued correcting until the close. The the clear down channel for the second part of trading today, along with the fact the average closed near its daily lows on high volume. Finally, the SPYs closed right around the 50% Fibonacci retracement level from the Fed induced rally.


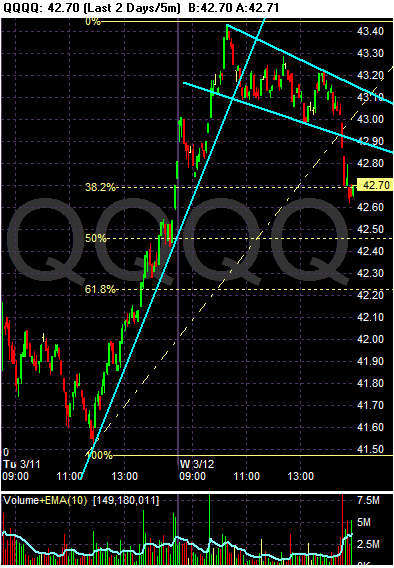
Much of the same analysis applies to the QQQQs, with the prime exception being the QQQQs sold-off to their 38% retracement level rather than the 50% level.


Again, much of the same. Note the extremely heavy volume at the end. Once the IWM broke through the lower trend line around 2:30 they sold off on very heavy volume.

Overall, the sell-off shouldn't sell anybody. However, the extreme drop in the last half hour of trading goes beyond a standard sell-off.

An Overview of the Basic Problem We Face

From Marketwatch:

There is a marked difference between economic growth and debt-induced demand. Instead of letting the market take its medicine and enter recession in 2001, the powers that be injected fiscal and monetary drugs to dull the pain and induce stock gains.

The Federal Reserve understands the market is the world's largest thermometer and the driver of a finance-based economy. On the back of the tech bubble, in the aftermath of 9/11, following the invasion of Iraq and into the election, they administered stimulants with hopes that a legitimate expansion would take root.

Is this a conspiracy theory from tin-foil types sitting on a grassy knoll? The only difference between intervention and manipulation is communication, as we're apt to say, a fine line that's been all but erased in recent years. Hank Paulson recently highlighted The Working Group as a policy tool, an admission that effectively exposed the wizard behind the curtain. See article
While government policy set the stage for the underlying imbalances, our immediate-gratification mindset exacerbated them.

Consumers bought goods with no money down and financed those obligations at zero percent.

Many used homes as collateral and flipped into adjustable-rate mortgages at the urging of Alan Greenspan.

Total debt in this country rose to more than 400% of GDP as societal spending habits lost all semblance of consequence.

As Americans raced to keep up with the Dow Joneses, seeds of discontent percolated under the seemingly calm financial surface. All the while, the cumulative imbalances grew as society chased the bigger, better thing.


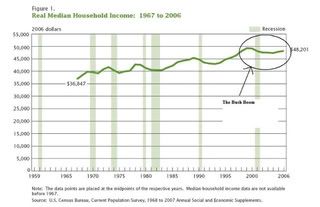
Let's start with this chart from the Census Bureau:


Notice the real (inflation-adjusted) median income is lower now than at the beginning of the expansion. That means overall income gains have been stagnant for this expansion.

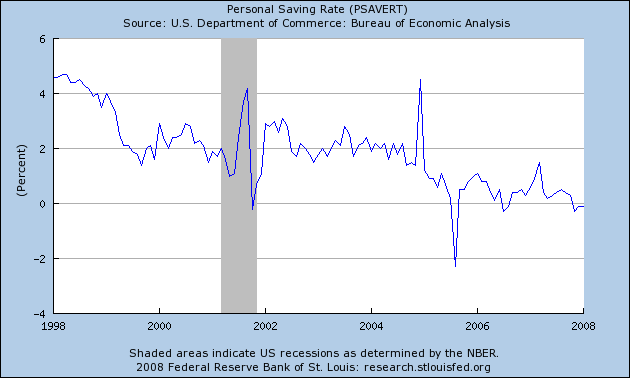
Let's add a graph of the savings rate into the mix:


Notice the savings rate is hovering near zero and has been for some time. It's important to remember how he get this number. The savings rate is gross income less all expenses and expenditures; essentially it's the money that's left over after we pay for and buy all of our stuff.

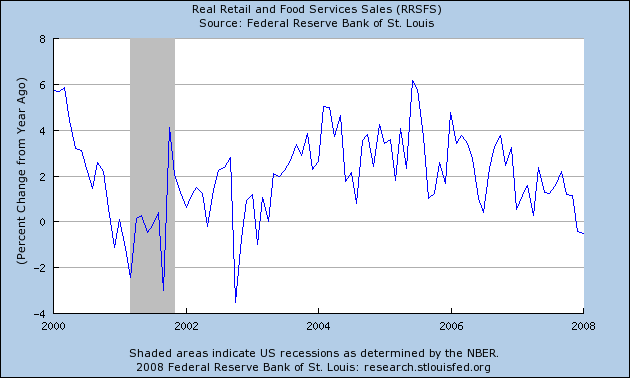
So, pay has been stagnant and we've been buying more and more stuff so that essentially, we're spending literally everything we make. But notice that despite the fact that pay has been stagnant and we're spending everything we make, retail sales still increased this expansion:


Also note that real (inflation-adjusted) personal consumption expenditures also increased.


So, let's sum up.

1.) When this expansion started, US consumers were already spending just about everything they made.

2.) Median income has been stagnant for this expansion.

3.) Yet, personal consumption expenditures and retail sales increased at strong rates.
Where did the money come from?


This whole expansion has been financed by debt acquisition. Americans have clearly gone deeper and deeper into debt to keep on spending.
Now we are paying the price. All of that debt has to go somewhere. Over the last 7 years, the financial industry has been very busy buying up all of the debt, carving it into various bonds and selling it to the highest bidder. They have used a process called securitization which has been around for about 25 years and in general has been used very successfully.

Problems start to occur when people start to fudge the numbers.

Federal investigators probing the business practices of Countrywide Financial Corp. are trying to figure out what Countrywide knew -- or in some cases didn't know -- about the incomes and assets of thousands of its borrowers.

The investigators are finding that Countrywide's loan documents often were marked by dubious or erroneous information about its mortgage clients, according to people involved in the matter. The company packaged many of those mortgages into securities and sold them to investors, raising the additional question of whether Countrywide understated the risks such investments carried.

Countrywide, long the No. 1 mortgage company in the U.S. in terms of dollar value of loan originations, also was considered among the most aggressive in finding ways to make home loans to consumers whose qualifications couldn't be proved or seemed questionable, mortgage industry executives and analysts said. The Federal Bureau of Investigation has begun looking into its practices in pursuing such business, according to people close to the matter.


Now we're paying the price for these policies. And it's going to take awhile to work the problems out.

The Problem With the Fed's Injection

From the WSJ:

The Fed said it would lend Wall Street as much as $200 billion from the central bank's own trove of sought-after Treasury bonds and bills for 28 days in exchange for a roughly equivalent amount of mortgage-backed securities, including some that can't ordinarily be used in transactions with the Fed. Uncertainties about the value of the underlying mortgages, plus forced selling by some investors to repay broker loans, have led many investors to spurn these securities, making them especially difficult to trade.

By taking some of these securities on its own books, the Fed is seeking to make its primary dealers -- the network of 20 Wall Street firms with which it typically does securities business -- more comfortable buying them from their own clients. It hopes this could lead to higher prices and thus lower yields on the mortgage-linked debt. A decline in those yields could help banks offer lower interest rates to prospective homebuyers.


The Fed is engaging in a massive repurchase agreement program:

An agreement with a commitment by the seller (dealer) to buy a security back from the purchaser (customer) at a specified price at a designated future date. Also called a repo, it represents a collateralized short-term loan for which, where the collateral may be a Treasury security, money market instrument, federal agency security, or mortgage-backed security. From the purchaser's (customer's) perspective, the deal is reported as a reverse repo.


There is one central problem with the Fed's plan. In 28 days, all of the questionable securities go back on the books of the borrowers. The central problem right now isn't the cost of money -- interest rates are still incredibly low by historical standards. The problem is counter party risk, also known as default risk:

The risk that companies or individuals will be unable to pay the contractual interest or principal on their debt obligations.

Notes:
In other words, this is the risk that you will not get paid.


Consider the following facts:

236 mortgage lenders have "imploded".

32 hedge funds have imploded

The latest FDIC Quarterly Banking Profile shows deteriorating credit conditions.

Banks have written down between $150 billion and $200 billion (the numbers differ depending on the news source).

UBS recently estimated that total losses from this mess would be $600 billion. Until that estimate was released, the total was estimated to between $300 - $500 billion. Assuming any of these estimates are correct that means we have at minimum at least abother $100 - $150 billion in writedowns to go.

Simply put, lenders are scared the borrower is going to default on a loan -- even a short-term loan. That means banks are making fewer and fewer loans. Given the facts, this caution about lending is entirely warranted.

The problems with the Fed's plan aren't the Fed's fault -- they are trying to do what they can to stimulate the financial sector. But nothing that they can do will rid the market of the central problem -- deteriorating balance sheets.

A Closer Look At the Averages

Going into yesterday's session, the markets were in terrible technical shape. Yesterday's announcement by the Fed that they would inject up to $200 billion in to the financial system helped to turn around the technical picture. Let's look at the daily 5-minute charts.


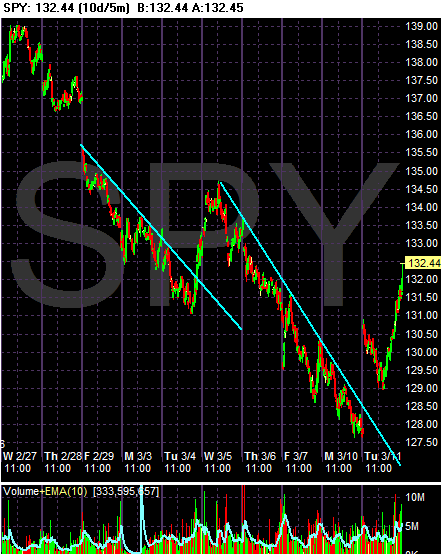
Starting on February 27, the SPYs continued to move lower for four straight days. There was a huge gap down on Feb. 29. The rally on 3/4 was caused by a rumor that Ambac had a rescue plan. However, after the end of that rally, the markets continued to move lower for another 4 straight days. Then we had yesterday's rally caused by the Fed.

Yesterday's rally was impressive. The market opened higher, sold-off, and then moved higher until the close. The market closed near high points for the day on high volume.


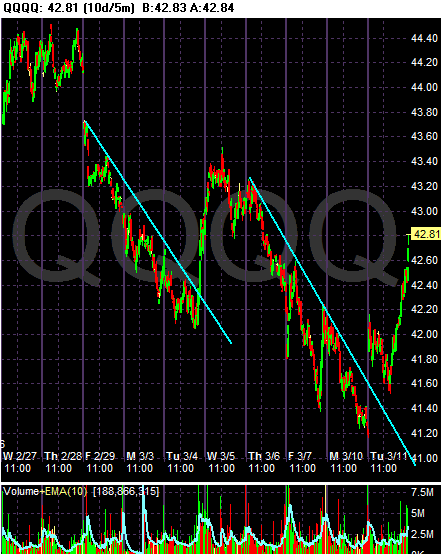
Much of the SPY analysis applies to the QQQQs. The main difference is a triangle consolidation pattern on 2/27 and 2/28.


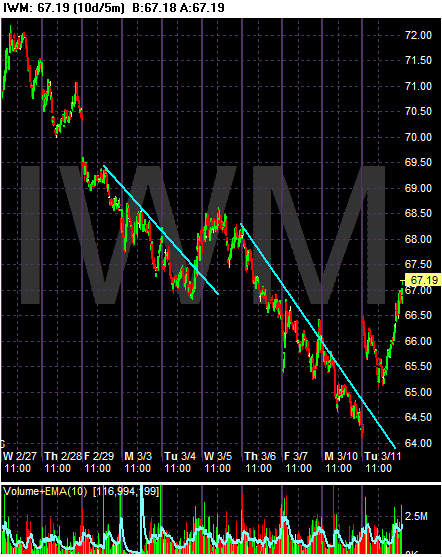
The SPYs analysis applies to the IWMs.

To reiterate -- all of these charts are still primarily bearish. Notice the clear down trends occurring. Basically, we have a downward moving market with bullish counter-trends. However, if recent market action is any indication, we can expect the market to return to a downward sloping trend fairly soon.

Tuesday, March 11, 2008

Today's Markets

In yesterday's market wrap, I noted the technical picture was not good. With the exception of the Ambac rally last week, the markets were in clear sell mode. The daily charts were deteriorating as well. First the Russell 2000 broke through the lower part of a consolidation triangle. This was followed by the QQQQs a few days later. Finally, the SPYs broke through technical support of their month long trading range. Simply put, the markets were deteriorating from most speculative to least speculative market sectors.

Then the Fed announces a $200 billion dollar cash injection. I seriously doubt that last night all the central banks made phone calls to each other to set this up. But I have to wonder if there was a plan to put this into effect at a technically important point. It is without a doubt incredibly fortuitous timing on the Fed's part. Basically, the Fed just saved the market's bacon with today's move.

Anyway, here are the daily charts. Notice the Fed has saved the day for the markets.


The SPYs rose over their previous technical support on high volume. The high volume is a good sign as it shows increased interest in the market.


The QQQQs clawed their way over technical resistance established from their consolidation triangle.


Instead of crashing though support, the IWMs rallied back today.