Saturday, June 16, 2007

Excerpts From Barron's Interviews, Pt 1

This weekend, Barron's has a round table of seven investment managers, their opinions and their picks for the coming six months.(subscription required) Mario Gabelli gave the following birds-eye view of the US economy for the second half of the year:

We thought the economy would be sluggish in the first half because of inventory corrections in housing and the automotive market. Things have unfolded more or less along those lines, with the rest of the world looking stronger than the U.S. By the second half of the year the inventory correction in automotive will be out of the way. The housing market will remain sluggish, but the inventory correction in that market will be gone in 2008. In the meantime, exports, nonresidential construction, capital expenditures, wages and the wealth effect provide ballast. At the other end of the economy, consumers will suffer from higher gasoline prices and declining home values. Bottom line, the economy muddles through and starts looking brighter in '08. Short-term interest rates will stay at 5%; long-term rates will go up to 5.5%. The dollar will be weaker, particularly relative to the Japanese yen. Put all that in the mix, add a stock-market correction of 10% to 15% at some point, and the market will be up at most 5% for the year. I'm not negative. I just think '08 will be a lot better.


I really like his use of the word "ballast" to describe the positive areas of economy. If you think of the overall economy as floating in the water and as being made-up of many subparts, those little subparts that are floating provide a counter-weight to those parts of the economy that are sinking.

Fred Hickey points out the bearish argument:

We have real, serious problems. The dollar is deteriorating against almost all currencies. Bond yields are backing up big-time, causing all sorts of ripple effects. Potential leveraged buyouts might not get done. Huge pyramids of leverage could start to implode. The back-up in rates comes at a time when the U.S. consumer has finally had it. Month after month retail sales disappoint. In April, 75% of retailers missed their same-store-sales targets. The consumer, facing hundreds of billions of dollars of mortgage-rate resets, now gets hit with rising rates. Wrong timing. Housing prices are falling nationwide. Mortgage-equity withdrawals have collapsed. In May, foreclosures were up 90% year over year. Gasoline prices are up 30% from the first quarter. We are looking at potentially the greatest food-price inflation in 30 years. Higher health-insurance costs. Lower benefits. You can't have a worse scenario for the consumer.


These area all solid arguments; I believe I have made most of them over the past several months. However, I have learned that counting out the US consumer is not a good idea. They continue to get money from somewhere.

Art Samburg notes the strong cash fundamentals for the markets -- cash as in private equity and corporate profits. He also highlights the overall PE ratio, which isn't cheap, but also not expensive:

The market's multiple has shrunk two years in a row. You might not like everything you see out there, but people are employed and things move forward. Corporate profits are growing at a 10% annual rate and the market is not up 10% yet. The other driver for stocks is the wad of money in private-equity hands. It is absurd, but I have learned one thing in life: It is very important to recognize absurdity, but also very stupid to get in the way of it. I don't see the private-equity boom abating. If corporate profitability in the U.S. is OK, the rest of the world is continuing to grow and private-equity deals are driving stock action in the U.S., the market could be up about 10%. this year.


FELIX ZULAUF makes a very interesting observation about why the bond market is selling off:

Suddenly, it seems, everyone agrees the secular downtrend in yields is over, and cyclically and probably secularly yields are on the way up. So far the back-up in yields has not been driven by rising rates of inflation, because inflation in industrial and emerging economies is behaving well. In the later stages of the cycle, inflation will turn up, but it's the supply/demand situation that is driving bonds now. There is less demand. The corporate sector is seeing deteriorating free cash flow because of more capital expenditures. Private-equity companies are buying equities and selling bonds. Also, nations that are running large surpluses, like China and Russia, have announced they plan to buy more equities and other assets, not just government bonds. It's a step-by-step process.


Basically, inflation concerns aren't the issue. Instead, bonds are getting hit because of a global reallocation of assets from debt to equity.

Scott Black notes the lack of fear in the markets:

Another problem is the casino mentality of many market players. Between the hedge funds trading in and out and the private-equity people chasing stocks at very inflated multiples of price to enterprise value, it reminds me a bit of the Michael Milken era -- the leveraged-buyout binge of the late 1980s. And there seems to be no fear. Look at the bond market. Investment-grade debt yields only 83 basis points over Treasuries, the lowest spread in nine years. [A basis point is one one-hundredth of a percentage point.] High-yield debt is 232 points over Treasuries -- a record low. There is no risk premium built into equities, and there is certainly none built into bonds. This belies the real economy, which slowed in the first quarter to about 0.6% growth.

How do you explain the divergence?

The world is awash in liquidity. Last year there were $3.7 trillion worth of deals done, followed by another trillion in the first quarter of this year. All those stocks were retired, and the money has to get recycled. As supply shrinks, demand seems to increase, and it clears the market at higher prices. The run-up in prices is more of a technical event than one based on the fundamental earnings power of companies.


The low spreads on junk bonds is reminiscent of the emerging market situation in the last 1990s. Emerging market debt was trading at very low levels relative to industrial debt. Traders had no fear. After the Asian crisis hit, emerging market debt sold off and a lot of traders got hurt.

That's the end of part 1. I read these observations and interviews slowly because they are very dense.
Friday, June 15, 2007

CPI Up .7%; Core Up .1%

From the BLS:

On a seasonally adjusted basis, the CPI-U advanced 0.7 percent in May, following a 0.4 percent increase in April. The index for energy increased sharply for the third consecutive month--up 5.4 percent in May. The index for petroleum-based energy rose 9.8 percent while the index for energy services declined 0.2 percent. The food index rose 0.3 percent in May, slightly less than in April. The index for all items less food and energy advanced 0.1 percent in May, following a 0.2 percent rise in April. Smaller increases in the indexes for shelter and medical care were responsible for the moderation.


From Bloomberg:

A measure of consumer prices in the U.S. rose less than forecast in May, bearing out the Federal Reserve's view that broader inflation pressures would moderate as the economy cooled.

So-called core prices, which exclude food and fuel, rose 0.1 percent last month after a 0.2 percent gain in April, the Labor Department said today in Washington. The median estimate of economists surveyed forecast a 0.2 percent gain. All prices rose 0.7 percent, the biggest increase since September 2005, led by a jump in gasoline costs.

The report may alleviate Fed concerns that rising energy and food costs would translate into broader price gains. Smaller gains in core prices may eventually give Fed Chairman Ben S. Bernanke the option to lower interest rates should the economy falter.

``We've seen a gradual diminution in core inflation,'' William Cheney, chief economist at John Hancock Financial Services in Boston, said before the report. ``If everything plays out right according to the Fed playbook, they'll be on hold well into next year and then they'll start to ease a little.''


From CBS Marketwatch:

Higher energy prices drove the consumer price index up by 0.7% in May, its largest increase since Hurricane Katrina and the second largest in 16 years, the Labor Department reported Friday.

But while consumer inflation was scorching hot, the core rate of inflation - which excludes food and energy costs - rose just 0.1%.

Core inflation has thus risen at 2.2% in the past 12 months, the smallest gain in more than a year and close to the Federal Reserve's target range. Core inflation has risen at just 1.6% annualized in the past three months.

The 0.7% gain on the headline CPI was just as expected by economists. But the 0.1% increase was less than the 0.2% anticipated by economists surveyed by MarketWatch.


So consumers saw the second-biggest increase in prices in 16 years, or since Hurricane Katrina. But that really doesn't matter too much from a policy perspective because the core rate was OK. Not that anybody consumers food or energy or anything related to that....

Seriously, the markets should like this report a great deal. There has been a lot of concern about inflation this week which was caused by the sell-off in the Treasury market. Now it appears that core inflation is still slowing as the Federal Reserve predicted. This implies the Fed is still on hold regarding interest rate policy, which makes everyone happy.

SubPrime Delinquencies Increase

From IBD:

Late payments and foreclosures on adjustable-rate mortgages made to people with spotty credit spiked to all-time highs in Q1. The proportion of subprime ARMs that were 30 days or more overdue hit 15.75%, up from 14.4% in Q4, the Mortgage Bankers Association said. The average 30-year-fixed mortgage rate rose to 6.74% last week.

Foreclosures Increasing

From the WSJ:

Seasonally adjusted, 0.58% of loans entered the foreclosure process last quarter, compared with 0.54% in the fourth quarter of 2006 and 0.41% in last year's first quarter. The rates for the past two quarters are the highest in the survey's 37-year history. The MBA reported that the spike in foreclosures was much steeper in California, Florida, Arizona and Nevada than in other areas. Mr. Duncan said some speculators are walking away from properties in the face of falling prices and higher borrowing costs.

The percentage of loans now in the foreclosure process rose to 1.28%, up from 0.98% a year earlier. That's still well below the 1.51% recorded in the first quarter of 2002, in the wake of a brief recession.


And it looks like we may have a new econ-hack emerging at the NAR:

The trade group's chief economist, Doug Duncan, predicted that delinquencies would likely rise, peaking later in the year. He also said rising foreclosures probably wouldn't peak until next year. "Our view is that we will probably see modest increases in delinquencies and foreclosures for the next couple of quarters," Mr. Duncan said.


Nothing to see here, move along...

The housing market is going to be a mess for a long time. Builders don't see the possibility of a recovery until 2011. We still have at least 2 years of mortgage resets to go through. Something tells me the delinquency rates will be increasing for quite some time.

PPI Rises

Raise your hand if you don't use food or energy. Now that we have that silliness out of the way......

From the WSJ:

Wholesale prices in the U.S. rose sharply for a fourth straight month in May on higher energy prices. But outside the volatile food and energy sectors, prices remained largely contained, suggesting that while inflation remains a risk, it doesn't appear to be taking hold.

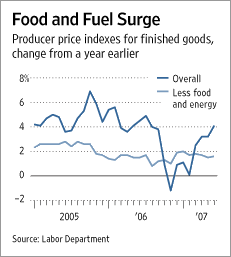
The Labor Department said the producer-price index for finished goods rose 0.9% in May, up from a 0.7% gain in April and well above economists' expectations. The core PPI, which excludes food and energy, was up a more moderate 0.2% after holding steady the previous two months. In the 12 months through May, wholesale prices rose 4.1%, the largest increase since June 2006. In contrast, the core PPI was up just 1.6% from a year ago.

The PPI report comes on the heels of a sharper-than-expected rise in May import prices. The key question is whether higher import and wholesale prices will seep into consumer prices -- a trend that could prompt the Federal Reserve to hit the economic brakes by raising interest rates.


Here's a chart of the core/total PPI numbers from the same article:

Photo Sharing and Video Hosting at Photobucket

The Fed has a core inflation rate target of 1%-2%. At this point, I am wondering if that level is even possible. We have a global economy that is increasing in size. That means there is a lot of competition for all sorts of resources. All of the competition will drive costs up. It's that simple.

Mortgage Defaults, Hedge Funds and Market Liquidity

From the WSJ:

Mr. Cioffi, 51 years old, has been at Bear for 22 years and is a mortgage-market veteran. But his riskier fund lost nearly one-fourth of its value in the first four months of this year. In recent days, lenders led by Goldman Sachs Group Inc. and Bank of America Corp. began making margin calls on the fund, requesting additional cash or collateral.

Yesterday, seeking to raise the cash, Mr. Cioffi's funds auctioned off nearly $4 billion in some of their highest-quality mortgage bonds. The auction went smoothly, but now Mr. Cioffi's funds are left holding riskier investments that could be harder to sell. Wall Street was watching the sale closely yesterday, fearing the market could soon be flooded with low-quality mortgage securities in the weeks to come.

Mr. Cioffi didn't return a call for comment.

Whether the Bear sale raised enough money to meet redemption requests and margin calls -- requests from lenders for additional cash or collateral -- remains to be seen. Late yesterday, a number of creditors for the two funds met with its managers, but the outcome of the meeting wasn't known.


This leads to a lot of very important points.

1.) Mortgage market 101: Mortgage lenders makes loans to individuals. After the lender closes the loan, they usually sell to loan to an investment bank. The investment bank than pools loans with similar characteristics into mortgage-backed securities, which are then sold to various investment institutions. Everything is fine so long as all the players in this chain of events are able to move product at a profit. Once that profit disappears, the players disappear and mortgage liquidity dries up. Then it becomes harder to make loans, which further lowers housing demand.

2.) One of the main concerns with hedge funds is they don't have any reporting requirements: no one simply knows what assets they hold, or what the value of those assets are. Because there are a lot of hedge funds out there right now, there could be a ton of portfolios that have large mortgage losses that no one knows about.

3.) This situation reminds me of the S&L problem in the 1980s. At first there were no problems. Then a few problems started to come into light. Then the damn broke.

4.) So far, the mortgage market has been very resilient. It has taken a ton of really bad hits and survived really well. However, every system has limits to how much stress it can tolerate. Is the mortgage market approaching that limit? There's no way to tell.

Thursday, June 14, 2007

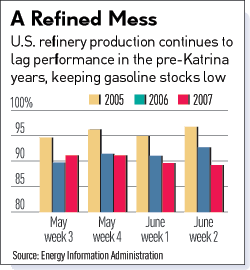
Refineries Stil Operating Below Capacity

From IBD:

Output for the week ended June 11 came in level with the prior week and well below estimates. That means supplies remain far short of normal seasonal ranges.

On the other hand, demand from the summer driving season and an economy performing above expectations is headed toward its annual peak


Here is the chart from the article:

Photo Sharing and Video Hosting at Photobucket

Despite this issued with production, gas prices continue to fall:

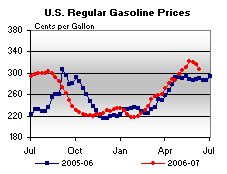
For the third consecutive week, the U.S. average retail price for regular gasoline decreased, falling 8.1 cents to 307.6 cents per gallon as of June 11, 2007. Prices are still 17.0 cents per gallon higher than this time last year. All regions reported price decreases. East Coast prices dropped 4.6 cents to 302.2 cents per gallon. The largest regional decrease was in the Midwest, where prices fell 15.2 cents to 307.3 cents per gallon. Prices for the Gulf Coast decreased 5.8 cents to 296.2 cents per gallon, while Rocky Mountain prices fell 3.5 cents to 322.5 cents per gallon. West Coast prices were down 5.3 cents to 326.5 cents per gallon. The average price for regular grade in California was down 5.4 cents to 332.0 cents per gallon, but remains 9.5 cents per gallon above last year's price.


However, as this chart from the same report shows, gas prices are still above year ago levels.

Photo Sharing and Video Hosting at Photobucket

Yesterday's retail sales indicated gas prices aren't having a negative impact on consumer spending, categories outside of gas sales showed increases.

Oil Market Update

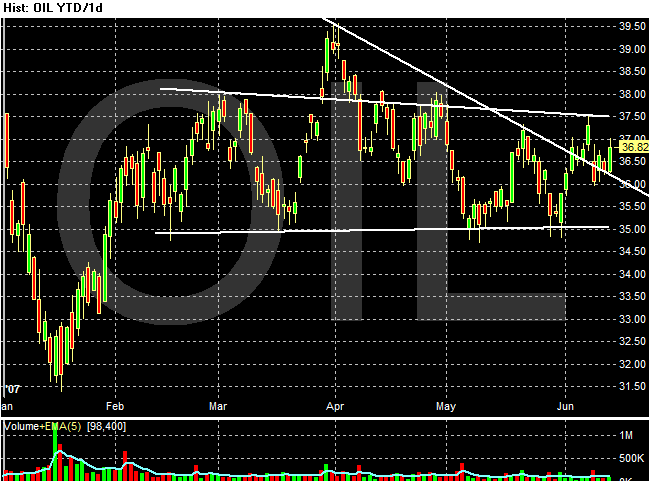
Here is a chart of OIL, the ETF that tracks the oil market. Pay particular attention to the trading range established at the beginning of February. Save for a temporary move above this range in late March/early April, the range has held. So -- is oil forming a base for a move in either direction?

Photo Sharing and Video Hosting at Photobucket

Wednesday, June 13, 2007

Fed Releases Beige Book

Here is a link to the release:

Here are the big points.

Reports from the twelve Federal Reserve Banks indicated that economic activity continued to expand from mid-April through May. Seven banks described growth in their Districts as modest or moderate: Cleveland, Atlanta, Chicago, St. Louis, Kansas City, New York, and San Francisco. Dallas reported growth as moderately strong, and Minneapolis said the District's economy edged up. Philadelphia reported that growth was somewhat faster than in recent months, and Richmond said growth picked up a bit. Boston characterized reports from its contacts as generally positive.

Consumer spending and retail sales were generally up in late April and May, with a number of Districts reporting that luxury items were selling better than lower-end merchandise. On net, there was little change in auto sales across the Districts, and dealers are about evenly split on whether there will be any pickup in sales over the summer. Travel and tourism remained healthy despite the recent rise in gas prices, although the rise in prices remains a concern for the summer. Except for trucking, reports from the service industries were generally positive. Declines were widely reported in the trucking industry, however. Manufacturing activity was up in a majority of Districts. There was weakness among manufacturers producing for the residential construction industry but strength among machinery and equipment manufacturers in several Districts.

There was continuing weakness in residential real estate and construction but increasing strength in the commercial real estate sector, including both office and industrial space. Half the District banks reported little or no change in overall loan demand, with strength in commercial lending and weakness in residential mortgages and consumer lending. In the agricultural sector, crop conditions improved and were generally described as good. An early spring frost harmed some winter wheat, and drought conditions caused problems in the Southeast and the far West. Oil and gas exploration increased in recent months, but coal production was down.

Hiring activity picked up in late April through May, especially for workers with specialized skills. But most Districts reported that overall wage pressures do not seem to have increased. There have been significant price increases for energy-related products and selected raw materials, but the prices of some raw materials have remained stable.

Retail Sales Increase 1.4%

From the Census Bureau

The U.S. Census Bureau announced today that advance estimates of U.S. retail and food services sales for May, adjusted for seasonal variation and holiday and trading-day differences, but not for price changes, were $377.9 billion, an increase of 1.4 percent (±0.7%) from the previous month and 5.0 percent (±0.7%) above May 2006. Total sales for the March through May 2007 period were up 4.2 percent (±0.5%) from the same period a year ago. The March to April 2007 percent change was revised from -0.2 percent (± 0.7%)* to -0.1 percent (± 0.2%)*.

Retail trade sales were up 1.5 percent (±0.7%) from April 2007 and were 4.9 percent (±0.8%) above last year. Clothing and clothing accessories stores were up 7.8 percent (±1.5%) from May 2006 and sales of nonstore retailers were up 7.7 percent (±4.5%) from last year.


On of my big concerns going forward is the consumer. Consumer spending is responsible for 70% of US growth, so a health pace is vital to an economic expansion. In addition, because of the housing situation it's important to see if the slowing housing market is starting to bleed over into consumer spending.

Today's number indicates the US consumer is alive and well. There were strong gains across the board.

Auto sales at dealerships increased 1.86%.

Electronics and appliance store sales increased 1.26%.

Building Materials increased 2.06%.

Clothing and apparel sales increased 2.68%.

In short, it looks like the US consumer is alive and well right now.

It's a Small World After All

For the rest of the day you will be cursing Bonddad for putting that damn song in your head.

From the WSJ:

The jump in yields has been driven by strong economic growth and rising inflation outside the U.S., which has prompted central bankers in Europe, Japan and elsewhere to raise, or consider raising, rates. Last week, the European Central Bank increased its target interest rate to 4% from 3.75% and signaled that there are more rate increases to come. The Bank of England and the Bank of Canada are expected to raise rates next month, and the Bank of Japan looks poised to raise rates later this year.

That U.S. bond yields have jumped despite weak U.S. economic growth is further evidence of how interconnected the world's markets have become. Increasingly, the U.S. market is being influenced by global investors. That's in part because the U.S. imports far more than it exports to countries like China and makes up the difference by borrowing from foreigners, who have been flocking to U.S. bonds. To continue attracting those investors, U.S. bond yields need to compete with rising yields abroad.


And from Bloomberg:

European government bonds slid by the most in more than a year on concern quickening global expansion will prompt central banks to increase interest rates.

The slump sent 10-year bund yields to the highest since August 2002 as traders raised bets the European Central Bank will lift rates twice more in 2007 and as ECB official Erkki Liikanen said the outlook for growth in the region will stay positive. Bunds followed Treasuries lower after former Federal Reserve Chairman Alan Greenspan forecast rising yields and greater premiums on emerging-market debt.

``There's been a reassessment of global interest-rate expectations, which is hurting bonds,'' said Stuart Thomson, who manages 23 billion pounds ($45.5 billion) in bonds at Resolution Investment Management Ltd. in Glasgow, Scotland. ``The market is being driven down by a capitulation of long positions.'' A long position is a bet an asset price will rise.


The International Monetary Fund's World Economic Outlook highlighted the possibility of higher global growth outside of the US this year. This is where the rate pressure is coming from. Higher growth = higher demand = possible higher inflation.

Bond Yields Hit 5-Year High

From the WSJ:

U.S. bond yields hit a five-year high, with the yield on the benchmark 10-year Treasury note rising to nearly 5.25%, driving up the cost of everything from $150,000 home mortgages to $20 billion leveraged buyouts and threatening to slow the nation's economic growth.

Investors continued to dump Treasurys yesterday -- as they have for more than a week -- amid worries about rising inflation abroad and concerns that foreigners might curb their purchases of U.S. bonds, which have been an important source of support for the market.

......

Rising interest rates raise the monthly payments of homeowners with adjustable-rate mortgages and make it more costly for them to refinance to a fixed rate. They could also put the brakes on the corporate buyout boom, which has been financed by cheap debt and has helped to drive the stock market higher in recent years.

Yesterday, the 10-year note closed at 5.249%, just above last year's peak rate and slightly below the recent high set in May 2002 of 5.259%. The note's price, which moves in the opposite direction of the yield, was 94 8/32, down 27/32, or $8.4375 for each $1,000 invested. The price of the 30-year bond was 91 1/32, down 1 20/32, pushing its yield up to 5.356%, the highest since June 2004.

In less than four weeks, the yield on the 10-year note has climbed from just 4.7%, a huge jump for bond yields. In the past, such sharp moves have led to big losses for hedge funds and other investors who rely heavily on borrowed funds.


There's a lot here to take in.

1.) I don't see this as a huge problem for the buy-out boom. I wouldn't worry about that until yields hit 5.75% or so.

2.) However, the mortgage implications are huge. Credit standards have already tightened. At a time when inventories are at absolute all-time time highs we now have the market naturally slowing demand. I'm sure the mortgage banking industry is cursing this development.

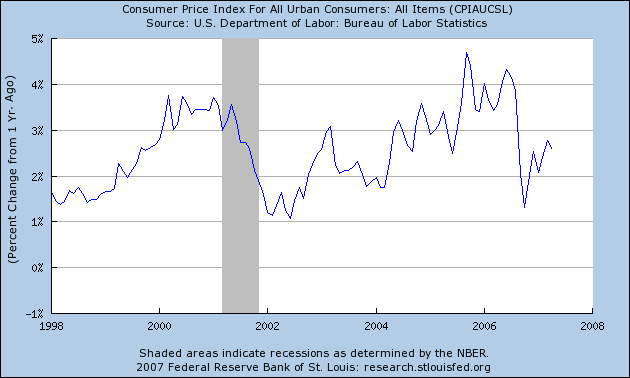
3.) There's been a lot of talk about inflation lately. So, let's take a look at the official BLS inflation numbers. Here's a chart of the Y/Y percent change in the overall inflation level including food and energy.

Photo Sharing and Video Hosting at Photobucket

There was a big run-up from 2004 to early/mid 2006, but then there was a drop thanks to a drop in oil prices. However, it looks like the Y/Y change is once again moving up which should give us reasons for concern.

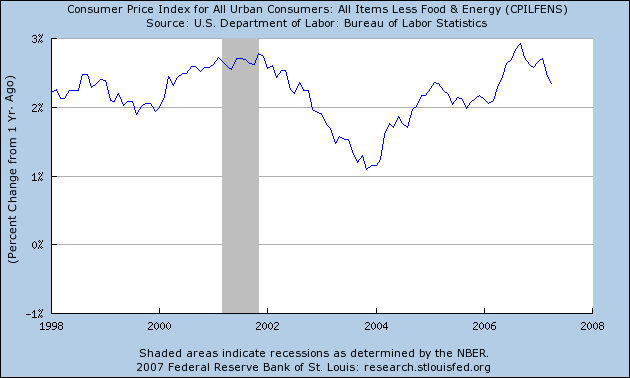
Here's a chart of the Y/Y percent change in core inflation:

Photo Sharing and Video Hosting at Photobucket

Remember that with this chart the Fed is trying to see if higher food and energy prices are bleeding over into other areas of the economy.

The Fed has an unofficial target of 1%-2%, so we're above the Fed's comfort zone here. Also note this number has been coming down since about mid-2006. The Fed has been stating that inflation should moderate as the economy slows and it appears this has in fact been happening. While the core rate is above what the Fed wants, it's still manageable.

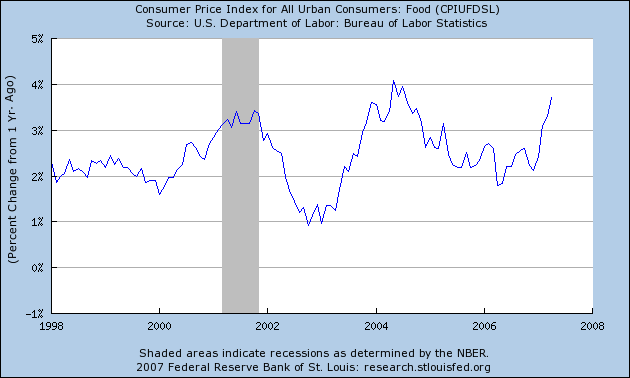
Here's the Y/Y percent change chart of food prices:

Photo Sharing and Video Hosting at Photobucket

Corn is an important base element in the US food industry. It's used as a raw material (DUH!) but also as a feed stock for livestock. Let's call this the "ethanol chart", because what we're seeing here is the effects of the national ethanol policy. As the number of uses of corn has increased we have not seen a proportionate increase in the supply of corn. When demand increases faster than supply, prices increase. This is what we're seeing now.

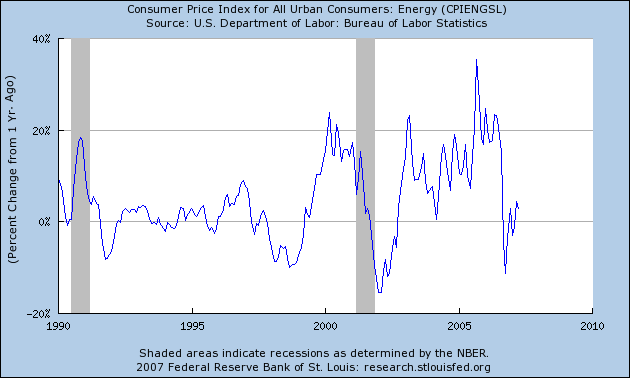
Here's the Y/Y percent change in energy prices.

Photo Sharing and Video Hosting at Photobucket

Notice the big dip last year when Goldman Sachs lowered the percentage of gasoline in their energy index. However, we're once again seeing this number increase.

The financial press has done a disservice to the investing public by focusing a bit too much on the core number and not enough on the overall number. While that number is OK, it could be better. And that is what investors are concerned about right now from the inflation front.

Tuesday, June 12, 2007

Back Tomorrow

Bonddad's got a 24 bug and will be back tomorrow.

Monday, June 11, 2007

Treasuries Drop Again

From Bloomberg:

U.S. Treasuries fell, extending five weeks of losses, as Federal Reserve Bank of Cleveland President Sandra Pianalto said inflation is ``uncomfortably high.''

Fifteen of the 21 primary dealers that underwrite the government's debt boosted their year-end estimate for the central bank's target rate or the 10-year note's yield. This week the government will release reports on consumer and wholesale prices. Yields on 10-year notes exceed two-year securities by 15 basis points, the most since May 2006.

``A lot of people are throwing in the towel and the curve needs to steepen,'' said Richard Schlanger, who manages about $4 billion of fixed-income assets, including Treasuries, at Pioneer Asset Management in Boston.

The yield on the benchmark 10-year note rose 5 basis points, or 0.05 percentage point, to 5.15 percent at 4:32 p.m. in New York, according to bond broker Cantor Fitzgerald LP. The price of the 4 1/2 percent note due May 2017 fell 11/32, or $3.44 per $1,000 face amount, to 95. Yields move inversely to prices.


The following is from BCA Research, which posts a daily quick hit idea.

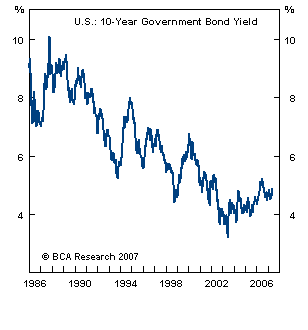
We have previously pointed out that portfolio managers in aggregate were bullish bonds, while underlying support for the bond market was eroding. We concluded that a capitulation phase would likely be needed before the sell off was over. Clearly, Thursday's breakout in the 10-year Treasury yield (which pierced a 20-year downward resistance line) forced a capitulation. Yet the fallout in the equity markets has been contained so far. Without the canary for the economy complaining, yields surged again overnight, briefly testing 5.25% Friday morning. Our instincts suggest that we are now in a classic blowoff phase and a buying opportunity may soon emerge. Still, until there is more evidence of pain from risky assets (equities and commodities), long bond positions face near-term risk.


Here is the accompanying chart:

Photo Sharing and Video Hosting at Photobucket

For almost 10 years, yields have been decreasing. Now they may be increasing because of inflationary concerns and pressures.

This is why keeping an eye on bond yields right now is crucial.

My New System

I've been trying to find a good list of ETFs and stocks to follow on a daily basis as a way of keeping abreast of the markets with minimal fuss. I want to keep track o what is happening without getting flooded with too much information.

I use Quotetracker with my Merrill Lynch Direct Account. I like Quotetracker, but it may not be for you. It reminds me of the screens I used when I was a bond broker, which is probably half of the reason I like it.

I finally settled on two different groups, each on a seperate page. The first is the major market tracking ETFs -- DIAs, SPYs, QQQQs, IWNS etc.... -- and the XL ___ group of industry tracking stocks. There are 18 different stocks to follow here, which is enough to get an overview.

I have a second page with the 10 largest stocks in the QQQQs, DIA, SPY, IYT and IWN index. There is some overlap with these (thank god). For example, MSFT is in two of the averages. Because most of these averages are market weighted, keeping track of the largest holdings gives me an idea of what is happening and what isn't.

I also have my watch list of attractive longs and shorts on two separate pages.

I am hoping this system gives me a good general overview of the market without giving me too much to deal with. It's a hard balance to find.

Managers Lower Treasury Exposure

From Bloomberg:

The biggest rout in the Treasury bond market in three years is making Wall Street's bond bulls more bearish.

Investors are ``throwing in the towel,'' said Robert Auwaerter, who oversees about $350 billion as head of fixed- income investments at Vanguard Group in Malvern, Pennsylvania.

Fourteen of the 21 banks and securities firms that underwrite the government's debt changed their outlooks for lower interest rates or increased forecasts for bond yields last week. Fund managers who oversee $1.34 trillion said Treasury and agency securities fell to 26 percent of their holdings from 36 percent as of May 18, according to a survey by Ried Thunberg & Co., a Jersey City, New Jersey-based research firm.

The combination of U.S. government reports showing rising labor costs and lower worker productivity with a surprise increase in New Zealand rates triggered the biggest one-day rise in 10-year Treasury yields since May 7, 2004. Even Goldman Sachs Group Inc. and Merrill Lynch & Co., which predicted the Federal Reserve would reduce its target rate for overnight loans between banks this year, abandoned their forecasts.

``Momentum could be toward even higher yields in the next couple weeks,'' said Gary Pollack, who helps oversee $12 billion as head of fixed-income trading at Deutsche Bank AG's Private Wealth Management unit in New York. ``If rates rise overseas, they will become competitive for the U.S. and therefore rates here have to rise.''


A majority of the big trading firms are now a bit more bearish on bonds. They have decreased their holdings pretty substantially within the last month. That means there is less upward pressure on bond prices. It also partially explains the recent increase in yield -- fund manager liquidation.

If these managers continue to liquidate, expect yields to increase.

Dollar Update

From the WSJ:

The dollar's renewed upswing looks likely to persist this week as investors seem to have discarded the possibility of a cut in U.S. interest rates in the near future.

The central issue for currency traders this week is whether the market has overshot, and whether data this week -- including reports on retail sales and consumer prices -- will undermine or confirm the more upbeat view of the economy.

Look for confirmation, many analysts say.

"We haven't seen the bottom in the bond market," said Matthew Strauss, senior currency analyst at RBC Capital Markets. "The trend -- a gradual upward trend in yields -- has been established."

This week's data and a smattering of Federal Reserve speakers will be evaluated against this backdrop, with investors likely to take better-than-expected data as confirmation of market sentiment and to be less willing to reverse course on disappointing figures, he said.


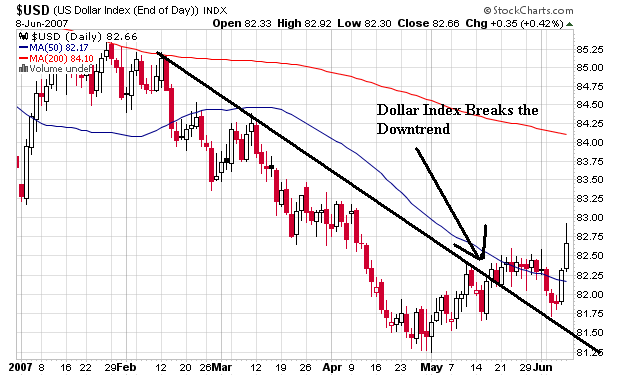
Let's take a look at the daily and weekly dollar charts to see what's going on.

On the daily chart, the dollar has broken to the upside of the short-term resistance. In addition, the dollar index is trading above the 50-day SMA and had two solid days of gains at the end of last week. The short-term trend is bullish.

Photo Sharing and Video Hosting at Photobucket

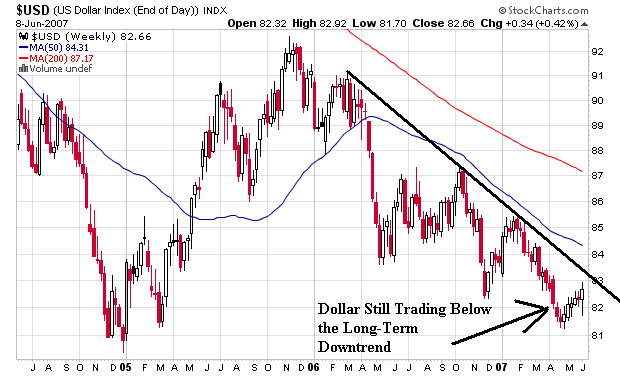
The long-term trend is still trading below the 50 and 200 day SMAs and the long-term trend line. The long-term trend is bearish until the dollar index breaks through one of these trends.

Photo Sharing and Video Hosting at Photobucket

Remember that last quarter international sales helped to boost earnings. One of the reasons for this increase was a weaker dollar. I don't know where the line is on the dollar index where it starts to meaningfully impact international sales. However, it still bears close watching.

Nice Summation On Interest Rates

From the WSJ:

Rising rates make it harder for buyout firms to finance takeovers with borrowed money, and buyouts were one of the main supports for stock prices. Higher rates make bonds more attractive alternatives for big institutions such as pension funds. They make it more expensive for businesses and consumers to invest and to buy things, which hurts corporate profits. And higher rates make dividend-paying stocks less attractive compared with bonds.


Beautifully written.

Sunday, June 10, 2007

A New Week -- Let's See Where the Markets Are

OK -- last week all of the averages lost ground. Let's see where we stand.

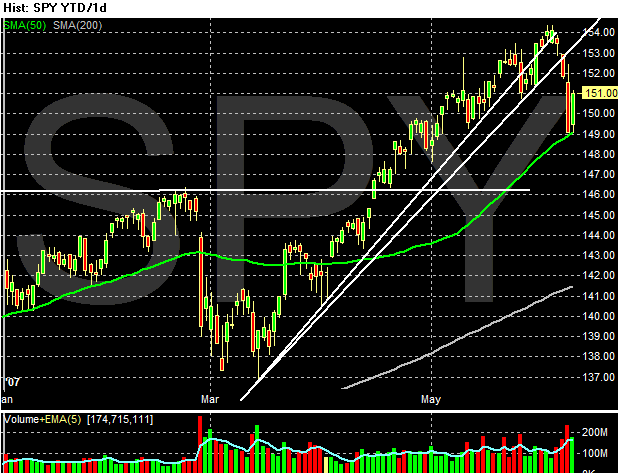
Here's a chart of the SPYs. They bounced off the 50-day moving average, which is pretty good from a technical perspective. My guess is buy-programs went into effect on Friday.

Photo Sharing and Video Hosting at Photobucket

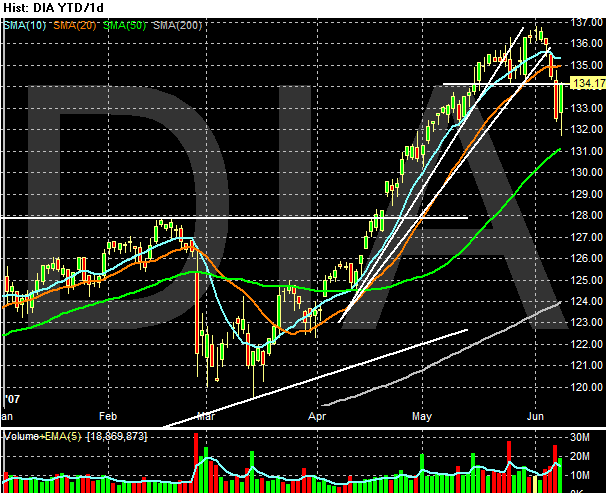
The Dow (DIA) is between the 20 and 50 day SMA. It did close right above resistance established near the end of May. This is a precipitous place for the Dow to be -- there is little room for error.

Photo Sharing and Video Hosting at Photobucket

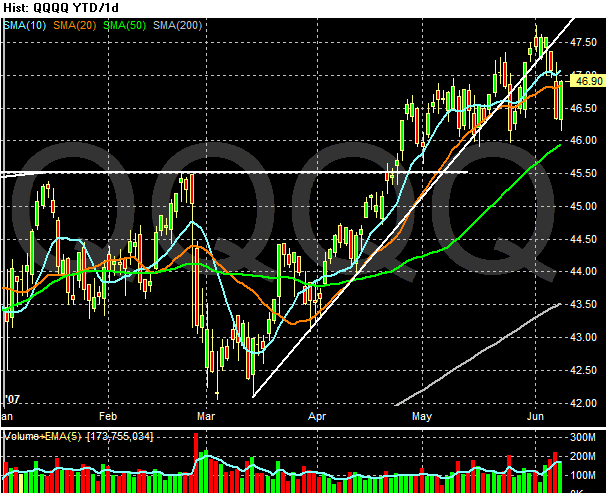
The NASDAQ moved back into a consolidation area and is trading near the top of that area at $47. It's in a stronger technical position than the DOW but in a weaker position than the SPYs.

Photo Sharing and Video Hosting at Photobucket
This week there are two things to watch out for. The first is interest rates. Keep a close eye on the 10-year Treasury's yield. In addition, we have three inflation reports this week -- import prices, PPI and CPI. Considering the markets actually listened to the Fed's inflation warnings last week, these numbers are now really important.

More On Interest Rates

This is from a Barron's interview with Shawn Kravetz, Founder and president, Esplanade Capital (subscription required).

Meaning we expect a slowdown, as opposed to a collapse. A lot of my concern boils down more broadly to rates. If interest rates remain in this ballpark, lots and lots of things will squeak by. But if we see a rate spike, the real-estate market will face even more risk, and that will have a substantial impact on consumption. People's discretionary income will fall dramatically as the cost of keeping a roof over their head rises. Lastly -- and this is very important -- the discount rate that we as investors use, and particularly what private-equity firms use to calculate their beloved terminal value -- the present value of future cash flows -- will go up, and the terminal value will fall. The private-equity put that has been so valuable of late across industries will start to wither. And the leverage that private-equity firms and hedge funds use to support some of these valuations will also go away. A lot hinges on what happens with rates, and we don't see any immediate spike in rates. But that's the one thing that most concerns us.


This is a very important point. Private equity is very important to the stock market right now. When a private equity firm is looking at an acquisition, they perform an analysis that calculates what all of the expected future cash flows are worth in today's dollars. One of the variables in this calculation is interest rates.

I don't know what the break-even point of rates is, and it probably varies from deal to deal. However, as rates increase expect the number of deals to drop.