Thursday, June 12, 2008
Back On Monday -- Moving Weekend
Over the next four days Bonddad and Mr$. Bonddad are going to move into their new house. I would love to tell you I can blog and move at the same time. I can't. So I'm going to spend the next 4 days moving all my stuff from the oil house to the new house. I'll be back on Monday.
Wednesday, June 11, 2008
Today's Markets
Oil spiked again, closing at $136.38. There's been a ton of volatility in the oil market lately. Corn also spiked as the floods in the Midwest delayed planting. The Fed's Beige Book painted a fairy dour picture of the economy. Finally, the US Treasury reported a record deficit, largely thanks to the stimulus checks that went out.
Let's take a look at the charts.
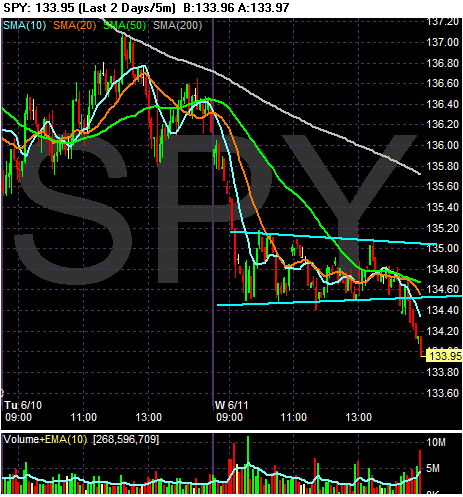
The SPYs gapped down at the open, then traded sideways for most of the rest of the day. They found resistance at various points, first at the 20 minute SMA then at a previous high. The index tried to make a move through the 50 SMA but couldn't make it. Notice the SPYs broke through support about a half hour before before the close and continued to move lower on increasing volume.
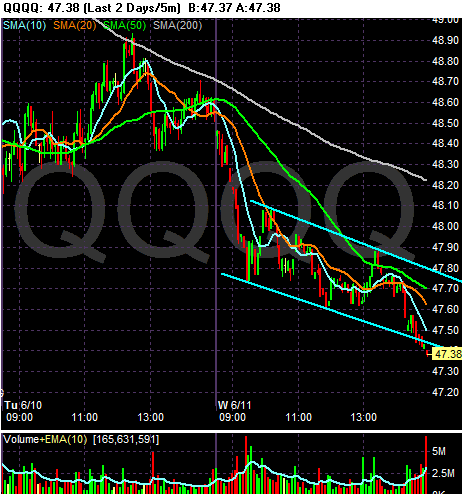
The QQQQs also gapped down at the open. They rallied into the 10 and 20 minute SMA until about 1PM CST when they tried to move above the 50 SMA. They couldn't maintain the strength and fell into the close. Notice the accelerating volume at the end of trading.
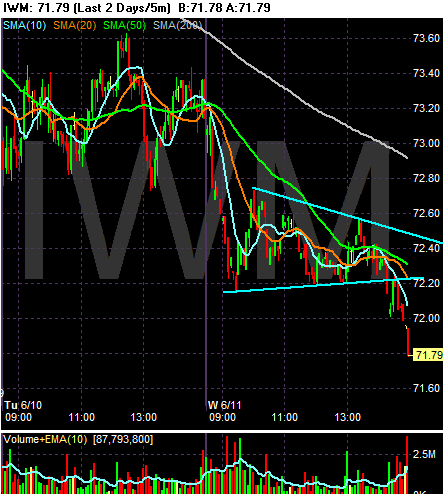
The IWMs also sold off in the morning. Throughout the day they tried to rally three times but couldn't get any momentum. They fell with ab out half and hour to go in trading and then moved lower on increasing volume.
Let's take a look at the charts.

The SPYs gapped down at the open, then traded sideways for most of the rest of the day. They found resistance at various points, first at the 20 minute SMA then at a previous high. The index tried to make a move through the 50 SMA but couldn't make it. Notice the SPYs broke through support about a half hour before before the close and continued to move lower on increasing volume.

The QQQQs also gapped down at the open. They rallied into the 10 and 20 minute SMA until about 1PM CST when they tried to move above the 50 SMA. They couldn't maintain the strength and fell into the close. Notice the accelerating volume at the end of trading.

The IWMs also sold off in the morning. Throughout the day they tried to rally three times but couldn't get any momentum. They fell with ab out half and hour to go in trading and then moved lower on increasing volume.
Inflation On the Brain
There is a ton of news today about inflation. Consider the following:
From the WSJ:
From Bloomberg:
Tie this information to the CRB chart below, especially the following points.
1.) The weekly chart is still in a major rally.
2.) The daily chart is still bullishly aligned
3.) The P&F chart shows a series of multiple new highs.
These developments explain the following statement from Bernanke's most recent speech:
NY Fed President Geithner echoed Bernanke's sentiment:
And Treasury Secretary Paulson has supposed dollar intervention which is a de facto way to cure inflation caused by the dropping dollar:
Now -- US officials have talked a good game for awhile, but haven't done anything. Let's see if they are will to act.
From the WSJ:
Inflation worries are heating up around the world and jolting financial markets in the process.
On Tuesday, China's stock market was the latest to feel the blow, with the benchmark Shanghai Composite Index tumbling by 7.7%, to its lowest close this year. The drop came after the government announced steps to remove cash from the financial system in an attempt to tamp down inflation.
.....Also Tuesday, officials in Vietnam effectively devalued their currency in a step aimed at easing market pressures related to soaring inflation rates. (See related article.)
And in the U.S., investors sold off U.S. Treasury securities, one day after Federal Reserve Chairman Ben Bernanke warned that the run-up in oil prices is adding to upside risks for inflation. The price of the two year Treasury note, most sensitive to the Fed's moves, has fallen sharply (and its yield has risen) as investors grow convinced that the central bank may have to raise rates this autumn to contain inflation. On Tuesday, the two-year note's yield was 2.9%, up from 2.4% on Friday, marking a major jump in that rate.
Meanwhile, the Bank of Canada surprised markets Tuesday by holding off on an expected interest-rate cut; the central bank said the risk of inflation, driven by high energy prices, had grown too great to allow for further rate cuts. The European Central Bank is also considering interest rate increases to fend off inflation.
From Bloomberg:
European Central Bank board member Juergen Stark damped speculation of a series of interest-rate increases, saying policy makers have signaled only that they may raise borrowing costs in July.
``The markets have understood the Governing Council's signal,'' Stark, 60, said in an interview in Chatham, Massachusetts, late yesterday. ``However, we are not talking about a series of rate increases.''
ECB President Jean-Claude Trichet said last week the bank may raise its benchmark rate by a quarter-point to 4.25 percent in July to curb inflation, which is running at the fastest pace in 16 years. Investors responded by increasing bets on higher borrowing costs. They expect the ECB to lift the key rate twice this year, taking it to 4.5 percent, according to Eonia forward contracts.
.....
Oil prices above $130 a barrel and rising food prices pushed inflation in the 15-nation euro region to 3.6 percent in May, well above the ECB's 2 percent limit. Central banks around the world are changing rate policy in response to surging inflation.
Global Policy Shift
Vietnam, Brazil, Chile, the Philippines and Indonesia all lifted borrowing costs this month. The Bank of Canada yesterday unexpectedly kept its benchmark rate unchanged after four straight reductions. U.S. Federal Reserve Chairman Ben S. Bernanke has also signaled the Fed is done cutting rates, saying this week he'll ``strongly resist'' any surge in inflation expectations.
Tie this information to the CRB chart below, especially the following points.
1.) The weekly chart is still in a major rally.
2.) The daily chart is still bullishly aligned
3.) The P&F chart shows a series of multiple new highs.
These developments explain the following statement from Bernanke's most recent speech:
Inflation has remained high, largely reflecting sharp increases in the prices of globally traded commodities. Thus far, the pass-through of high raw materials costs to the prices of most other products and to domestic labor costs has been limited, in part because of softening domestic demand. However, the continuation of this pattern is not guaranteed and future developments in this regard will bear close attention. Moreover, the latest round of increases in energy prices has added to the upside risks to inflation and inflation expectations. The Federal Open Market Committee will strongly resist an erosion of longer-term inflation expectations, as an unanchoring of those expectations would be destabilizing for growth as well as for inflation.
NY Fed President Geithner echoed Bernanke's sentiment:
Geithner also said containing global inflation risks will probably require tighter monetary policy. The Fed has cut U.S. interest rates sharply to 2 percent since September, though markets expect it to raise them later this year.
And Treasury Secretary Paulson has supposed dollar intervention which is a de facto way to cure inflation caused by the dropping dollar:
U.S. Treasury Secretary Henry Paulson on Tuesday said he stood by comments made a day earlier in which he said he would never rule out currency intervention as a potential policy tool.
"I'll let my comments stand," Paulson said in an interview with Bloomberg Television. "I never like to say never, but my focus is on long-term fundamentals."
Now -- US officials have talked a good game for awhile, but haven't done anything. Let's see if they are will to act.
Wednesday's Commodities Roundup
I'm going to break this into two different sections. First we'll take the CRB and Gold
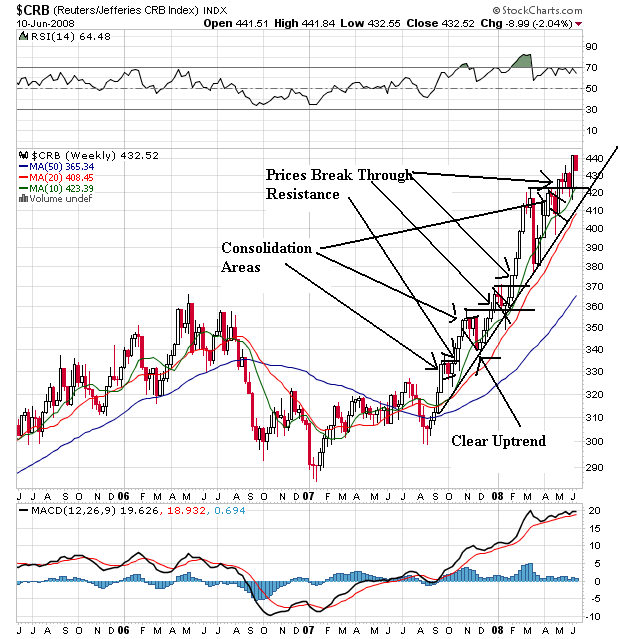
Remember that overall the CRB has been rallying since the beginning of 2007. It has continually moved through upside resistance and made new highs. Also note the SMAs are in the most bullish alignment possible. The shorter SMAs are above the longer SMAs and all the SMAs are moving higher.
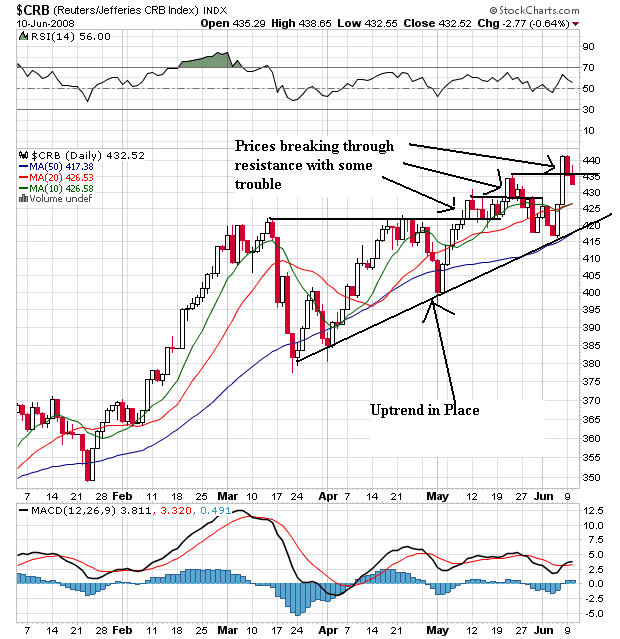
On the daily chart, notice that prices have been technically moving higher since late March. However, also notice that whenever prices have made new highs they have immediately fallen back to previous levels indicating traders are less than thrilled with the new highs.
An the SMA front, notice the following:
-- The 20 and 50 SMA are both moving higher
-- The 20 is greater than the 50, but the 10 is trading right at the 20.
-- All the SMAs are moving higher
-- Prices are above the SMAs
This is still a good alignment, but it could be better.
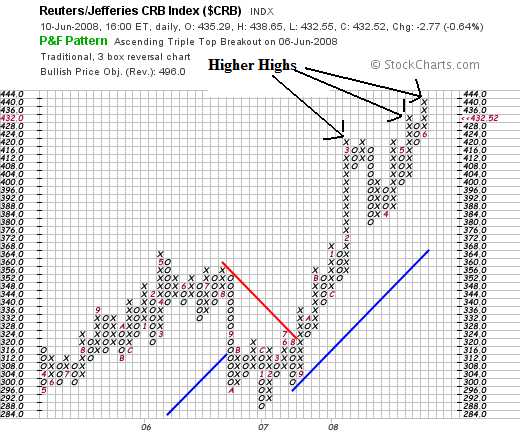
On the P&F chart, notice that prices have made continually made new highs.
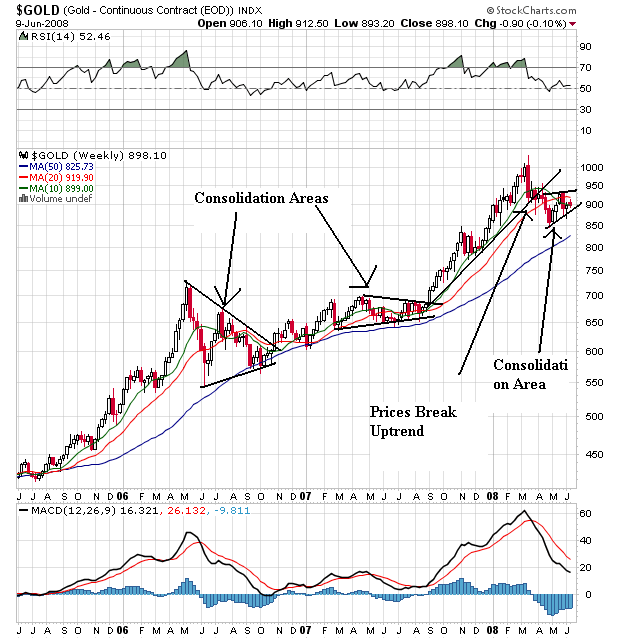
On gold's weekly chart, notice that it has broken through support and is currently consolidating in a triangle pattern.
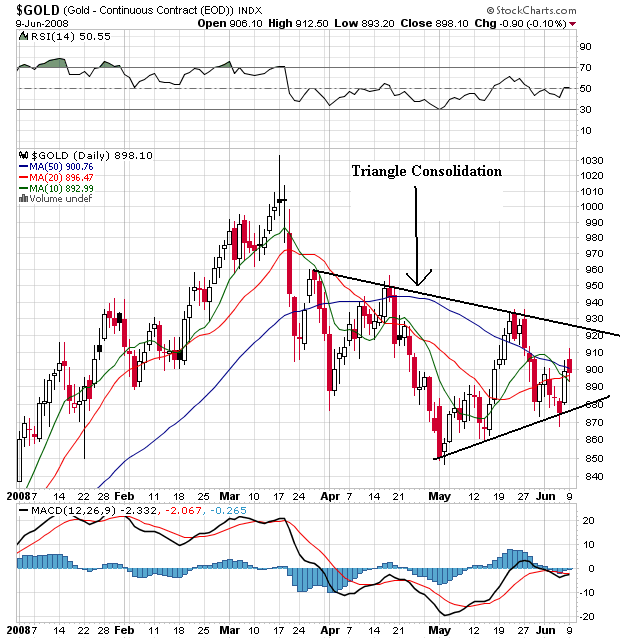
On the daily chart, notice that after hitting a new high in March the market has been selling off and is currently in a triangle consolidation pattern. Also note that prices and the SMAs are bunched up with little direction. This indicates a we really don't know what the next move will be.
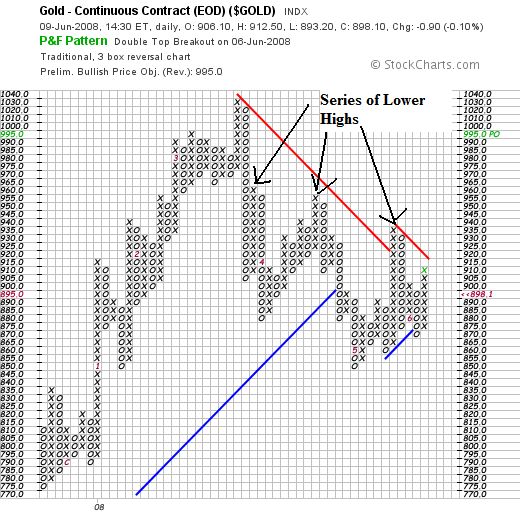
On the P&F chart, notice the series of lower highs, indicating a general sell-off.
Gold's chart tells us that inflation expectations have dropped a bit. That's good news.

Remember that overall the CRB has been rallying since the beginning of 2007. It has continually moved through upside resistance and made new highs. Also note the SMAs are in the most bullish alignment possible. The shorter SMAs are above the longer SMAs and all the SMAs are moving higher.

On the daily chart, notice that prices have been technically moving higher since late March. However, also notice that whenever prices have made new highs they have immediately fallen back to previous levels indicating traders are less than thrilled with the new highs.
An the SMA front, notice the following:
-- The 20 and 50 SMA are both moving higher
-- The 20 is greater than the 50, but the 10 is trading right at the 20.
-- All the SMAs are moving higher
-- Prices are above the SMAs
This is still a good alignment, but it could be better.

On the P&F chart, notice that prices have made continually made new highs.

On gold's weekly chart, notice that it has broken through support and is currently consolidating in a triangle pattern.

On the daily chart, notice that after hitting a new high in March the market has been selling off and is currently in a triangle consolidation pattern. Also note that prices and the SMAs are bunched up with little direction. This indicates a we really don't know what the next move will be.

On the P&F chart, notice the series of lower highs, indicating a general sell-off.
Gold's chart tells us that inflation expectations have dropped a bit. That's good news.
Tuesday, June 10, 2008
Today's Markets
Oil fell $3 on reports of a drop in demand and s stronger dollar. The dollar rose the most in two years. A survey of economists now thinks the US will have a protracted slowdown rather than a recession. The trade gap widened to $60.9 billion, largely thanks to oil. And the Shanghai market dropped over 7%.
Considering all of the action as of late, let's step back and look at the numbers from afar -- that is from the 5-day perspective to see where we stand.
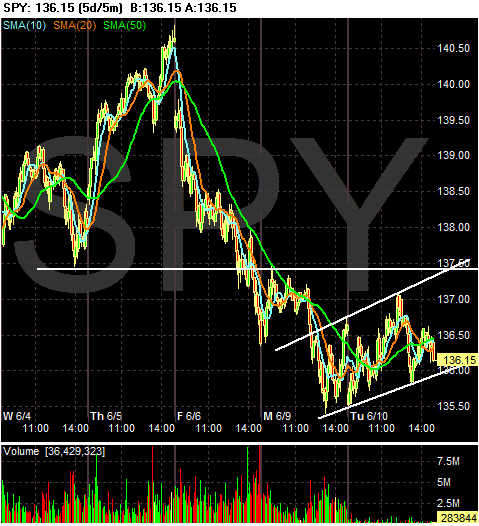
The big news here is the huge drop on Friday and Monday. Notice that prices dropped really heavily on those two days. But also notice that prices leveled out today, making today a consolidation day. In other words, today the market took a deep breath to figure out where it wants to move next.
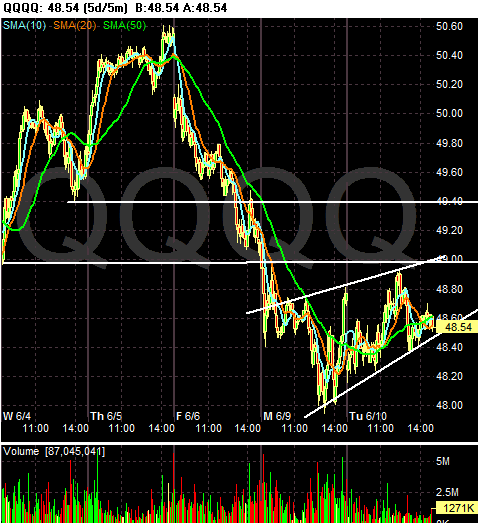
Note the same action with the QQQQs -- they had a really big drop but then rose a touch today in a consolidating move.
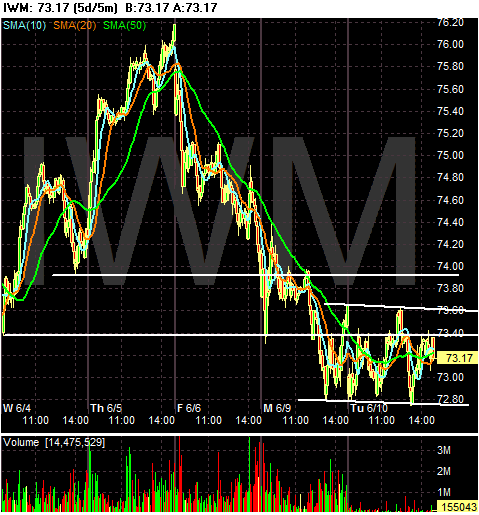
Note the IWMs are very similar to the SPYs.
After the hard and heavy action of the last few days, a drop in the intensity helps to calm everybody's nerves.
Considering all of the action as of late, let's step back and look at the numbers from afar -- that is from the 5-day perspective to see where we stand.

The big news here is the huge drop on Friday and Monday. Notice that prices dropped really heavily on those two days. But also notice that prices leveled out today, making today a consolidation day. In other words, today the market took a deep breath to figure out where it wants to move next.

Note the same action with the QQQQs -- they had a really big drop but then rose a touch today in a consolidating move.

Note the IWMs are very similar to the SPYs.
After the hard and heavy action of the last few days, a drop in the intensity helps to calm everybody's nerves.
Quick Oil Market News
From CNBC:
However:
It still looks net long to me.
Saudi Arabia's oil output increased by almost 500,000 barrels a day this quarter, to 9.54 million barrels, sources in the Saudi Oil Ministry told CNBC.
However:
World oil demand will rise at its slowest pace in six years during 2008 as a raft of fuel subsidy cuts in Asia erodes consumption, the International Energy Agency said on Tuesday.
But the adviser to 27 industrialized economies also sharply lowered its projection for supply outside the Organization of the Petroleum Exporting Countries, increasing consumers' reliance on the exporter group.
In its monthly Oil Market Report, the IEA said global oil demand will rise by 800,000 barrels per day (bpd) this year, 230,000 bpd less than its previous forecast.
It still looks net long to me.
Bernake on the Economy
From his speech last night
What Bernanke is arguing -- correctly I think -- is there are two sets of forces at work.
On one hand we have a bottoming in housing, credit market repair and exports helping to ameliorate the effect of high energy prices and the housing slowdown. Some of this hangs on when housing will bottom out, and as I have repeatedly asserted, I don't see that happening anytime soon. Simply put, supply is still massive, demand is still weak and lenders are facing tremendous headwinds from a tightening of their balance sheets. These are not conditions conducive to healing.
Oil's chart has been rising since early 2007. That's a strong rally to kill. In addition, the summer months are typically a period of higher prices, so we're arguing against a strong historical trend. In addition, we've got 2 billion people (India and China) with higher standards of living. So I don't see that dropping anytime soon.
The only good news here is in exports, which should do well so long as the dollar remains cheap. And given the sorry state of the Federal government's finances, I don't see that changing anytime soon.
Before turning to those issues, however, I would like to provide a brief update on the outlook for the economy and policy, beginning with the prospects for growth. Despite the unwelcome rise in the unemployment rate that was reported last week, the recent incoming data, taken as a whole, have affected the outlook for economic activity and employment only modestly. Indeed, although activity during the current quarter is likely to be weak, the risk that the economy has entered a substantial downturn appears to have diminished over the past month or so. Over the remainder of 2008, the effects of monetary and fiscal stimulus, a gradual ebbing of the drag from residential construction, further progress in the repair of financial and credit markets, and still-solid demand from abroad should provide some offset to the headwinds that still face the economy. However, the ongoing contraction in the housing market and continuing increases in energy prices suggest that growth risks remain to the downside.
What Bernanke is arguing -- correctly I think -- is there are two sets of forces at work.
On one hand we have a bottoming in housing, credit market repair and exports helping to ameliorate the effect of high energy prices and the housing slowdown. Some of this hangs on when housing will bottom out, and as I have repeatedly asserted, I don't see that happening anytime soon. Simply put, supply is still massive, demand is still weak and lenders are facing tremendous headwinds from a tightening of their balance sheets. These are not conditions conducive to healing.
Oil's chart has been rising since early 2007. That's a strong rally to kill. In addition, the summer months are typically a period of higher prices, so we're arguing against a strong historical trend. In addition, we've got 2 billion people (India and China) with higher standards of living. So I don't see that dropping anytime soon.
The only good news here is in exports, which should do well so long as the dollar remains cheap. And given the sorry state of the Federal government's finances, I don't see that changing anytime soon.
Monday, June 9, 2008
Treasury Tuesdays
Treasuries area still caught between their safe haven status:
and inflationary pressures.
However, looking at the charts you could argue that inflation fears are starting to win, with the flight to safety trade happening as events warrant.
Also remember that last week we saw Bernanke and Paulson jawboning the dollar. This implies that interest rates might be rising. And then there was this from Bernanke yesterday:
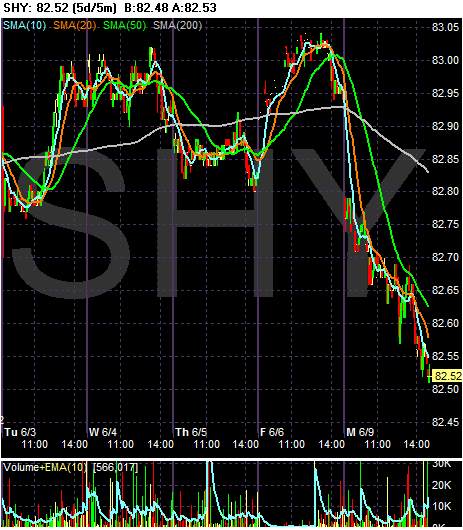
The short end of the Treasury market bounced between a narrow set of points from Tuesday of last week to Friday. However, the short end sold off yesterday.
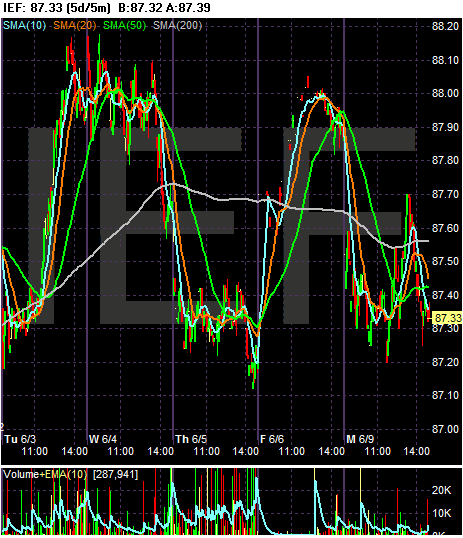
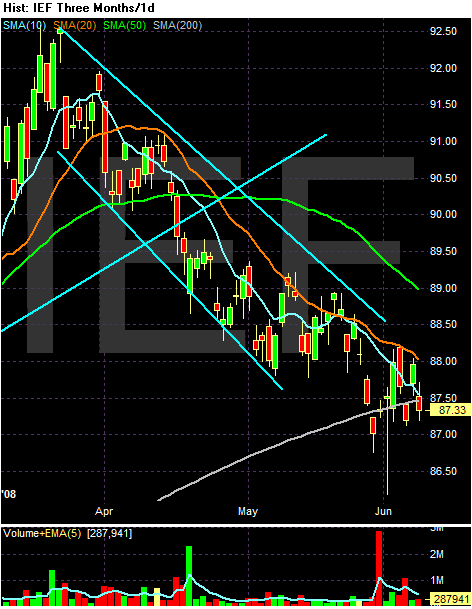
The 7-10 year part of the curve is caught between two points. This a trading range which indicates traders are still caught between several conflicting interpretations of the markets.
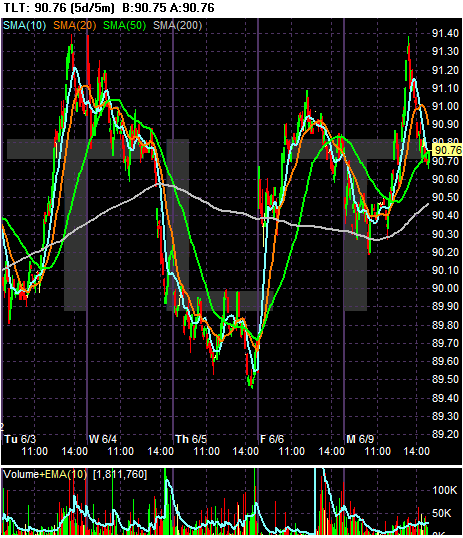
And the 20+ year area of the market is still moving between interpretations as well.
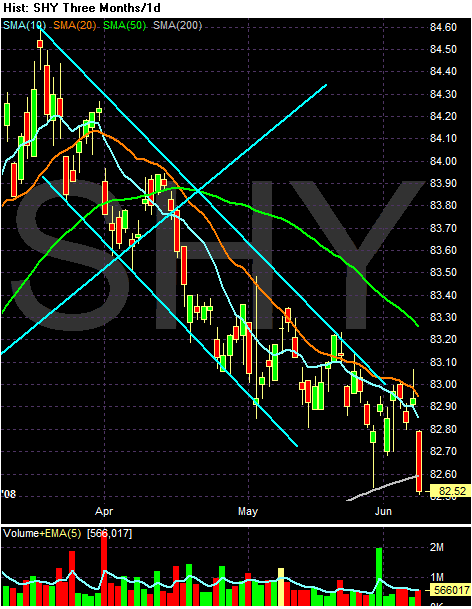
Looking at the short end's daily chart, we see the following:
-- Prices have been in a downtrend since a little after the beginning of the year. This is a sell-off that came at the end of the fight to safety from last year.
-- Prices have just moved below the 200 day SMA
-- Prices are below all the shorter SMAs
-- All the shorter SMAs are moving lower
-- The shorter SMAs are below the longer SMAs
On the 7-10 year chart, notice the following:
-- Prices are bouncing around the 200 day SMA, but haven't made a firm move either above or below.
-- Prices are below all the shorter SMAs
-- All the shorter SMAs are moving lower
-- The shorter SMAs are below the longer SMAs
-- Prices have been in a confirmed downtrend since the beginning of the year
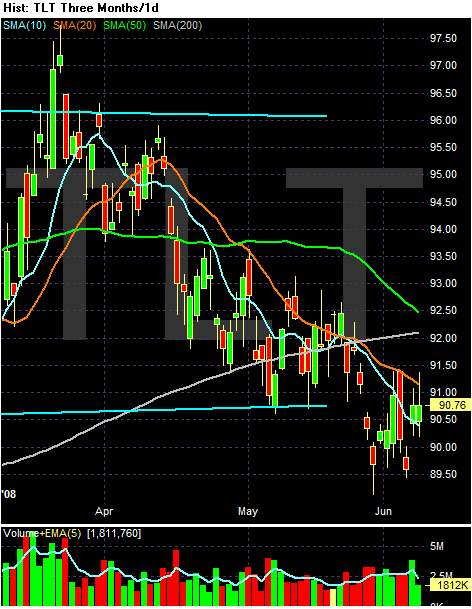
In the 20+ year market, notice the following:
-- Prices have moved below the 200 day SMA
-- Prices are below all the shorter SMAs
-- All the shorter SMAs are moving lower
-- The shorter SMAs are below the longer SMAs
-- Prices have been in a confirmed downtrend since the beginning of the year
The yearly charts show we are at/near a crossroads.
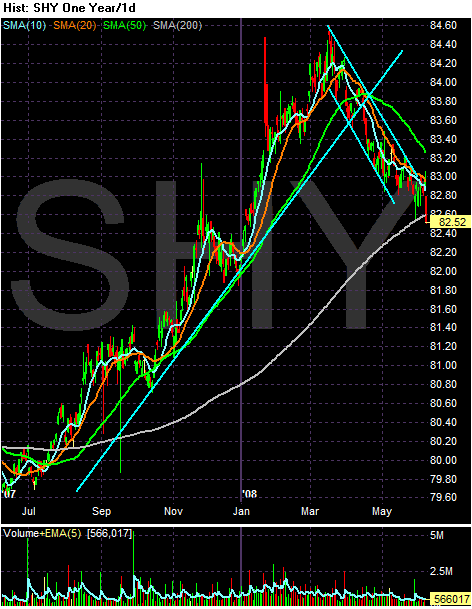
The short end of the curve has been declining for awhile and prices are right at the 200 day SMAs.
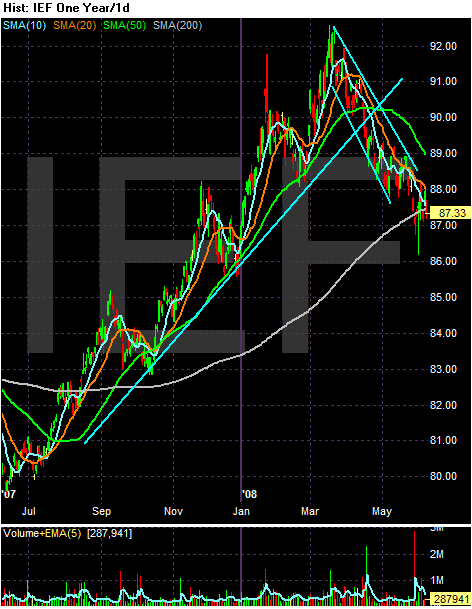
The IEFs (7-10 year) have also been declining since the beginning of the year and have been bouncing around the 200 day SMA
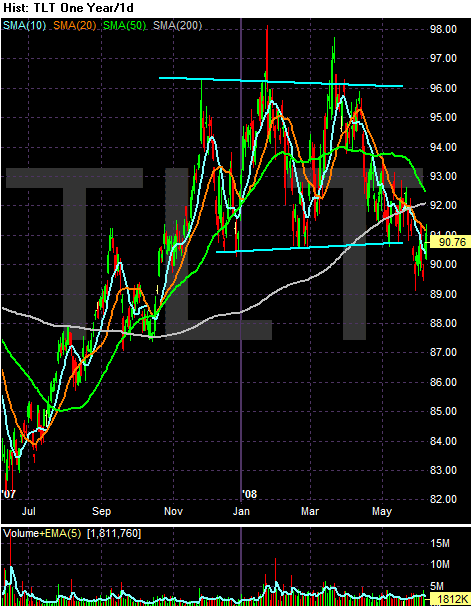
The TLTs have broken their trading range -- which they had been in since late last year -- and are firmly moving lower.
Renewed banking trouble Monday sent investors scrambling to buy low-risk government debt, with shorter-dated maturities making the biggest gains.
The two-year note rose 8/32 point, or $2.50 for every $1,000 invested, to yield 2.512%. That is down from 2.641% Friday as bond yields fall when prices rise. The yield on the benchmark 10-year note fell below the 4.0% mark again -- a level just breached last week. It was yielding 3.971% Monday.
The advances helped government debt gain back some ground after suffering a rout in the past few weeks amid rising inflation worries, speculation over higher interest rates and a recovery in risk appetite.
But risk aversion returned Monday after British mortgage lender Bradford & Bingley warned about the outlook for 2008, and two major U.S. banks, Wachovia Corp. and Washington Mutual Inc. made management changes. That reminded investors that the credit-market crunch, while improved from the worst levels in March, is far from over.
Standard & Poor's downgrades of the counterparty ratings on three major U.S. brokers added to investors' worries, as the ratings firm said it expects Merrill Lynch & Co., Lehman Brothers Holdings Inc. and Morgan Stanley to make additional writedowns.
"You are seeing a flight-to-quality bid into Treasurys again," said Gary Pollack, who helps oversee $12 billion as head of fixed-income trading at Deutsche Bank AG's private wealth-management unit in New York. "The credit market crisis isn't over. This is just a reminder of that. The market is repricing risk."
and inflationary pressures.
Crude oil spiked to new records around $139 per barrel, deepening a stock market sell-off and driving flows out of riskier assets into safe-haven Treasuries. However, a sustained acceleration of inflation pressures even in a period of weak economic growth could later prove negative for bonds, analysts warned.
However, looking at the charts you could argue that inflation fears are starting to win, with the flight to safety trade happening as events warrant.
Also remember that last week we saw Bernanke and Paulson jawboning the dollar. This implies that interest rates might be rising. And then there was this from Bernanke yesterday:
Federal Reserve Chairman Ben S. Bernanke said policy makers will ``strongly resist'' any surge in inflation expectations, delivering his clearest message yet the central bank is done lowering interest rates.
Bernanke played down the biggest jump in the unemployment rate in 22 years in May and said the risk of a ``substantial downturn'' receded in the past month. Policy makers will need to pay ``close attention'' to make sure the increase in commodity costs doesn't pass through to broader consumer prices, he said in a speech to a Boston Fed conference late yesterday.
The Fed chief's remarks spurred investors to bet that officials will raise rates later this year and sent two-year note yields to their highest level since January. Bernanke and his colleagues are raising the alarm on inflation after oil costs doubled in the past year and companies from Dow Chemical Co. to tire-maker Titan International Inc. raised prices.

The short end of the Treasury market bounced between a narrow set of points from Tuesday of last week to Friday. However, the short end sold off yesterday.

The 7-10 year part of the curve is caught between two points. This a trading range which indicates traders are still caught between several conflicting interpretations of the markets.

And the 20+ year area of the market is still moving between interpretations as well.

Looking at the short end's daily chart, we see the following:
-- Prices have been in a downtrend since a little after the beginning of the year. This is a sell-off that came at the end of the fight to safety from last year.
-- Prices have just moved below the 200 day SMA
-- Prices are below all the shorter SMAs
-- All the shorter SMAs are moving lower
-- The shorter SMAs are below the longer SMAs

On the 7-10 year chart, notice the following:
-- Prices are bouncing around the 200 day SMA, but haven't made a firm move either above or below.
-- Prices are below all the shorter SMAs
-- All the shorter SMAs are moving lower
-- The shorter SMAs are below the longer SMAs
-- Prices have been in a confirmed downtrend since the beginning of the year

In the 20+ year market, notice the following:
-- Prices have moved below the 200 day SMA
-- Prices are below all the shorter SMAs
-- All the shorter SMAs are moving lower
-- The shorter SMAs are below the longer SMAs
-- Prices have been in a confirmed downtrend since the beginning of the year
The yearly charts show we are at/near a crossroads.

The short end of the curve has been declining for awhile and prices are right at the 200 day SMAs.

The IEFs (7-10 year) have also been declining since the beginning of the year and have been bouncing around the 200 day SMA

The TLTs have broken their trading range -- which they had been in since late last year -- and are firmly moving lower.
Today's Markets
The big news today was Lehman Brothers announcing they are raising $6 billion in capital along with a $2.8 billion dollar loss. Guess what? The credit crisis is far from over. In a sign the housing market is nowhere near bottom, pending home sales dropped 13.1% from last year's level. Paulson didn't rule out the possibility of dollar intervention. New York Federal Reserve President Tim Geithner made a similar statement. This is the third federal official who has come out talking about the need to watch and possibly support the dollar in the last few weeks. Finally the Saudis called for a meeting between oil producers and consumers.
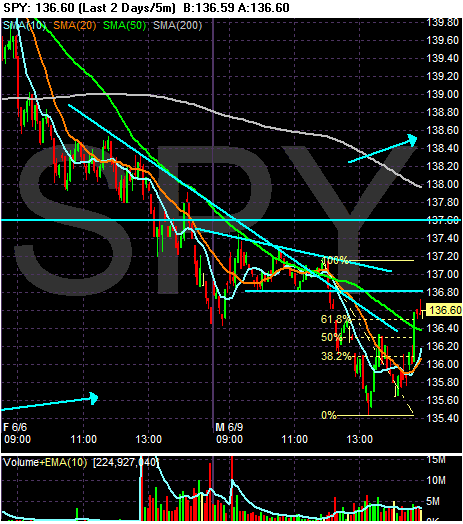
The SPYs moved sideways for most of the morning. However, the bar that printed at noon shows a strong move downward move, followed by a continued move downward with a heavy volume spike 15 minutes later. The market continued to move lower until about 1:45 when the market rebounded. The SPYs printed a double bottom and then broke through the 10 and 20 minute SMA to close right around the 61.8% Fibonacci level from the morning's sell-off.
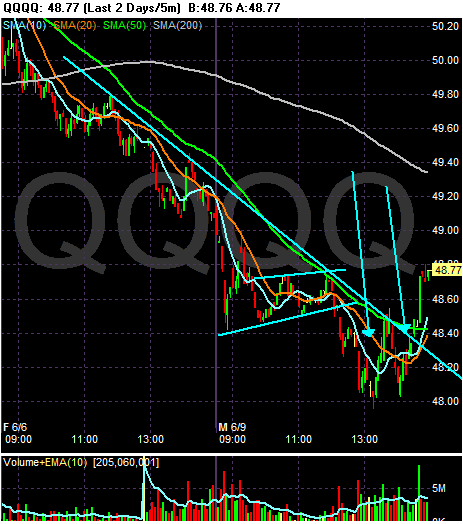
Notice the QQQQs continued their downward move started on Friday. The market opened lower then consolidated sideways. However, the 50 minute SMA provided resistance right around noon and the marker moved lower, eventually gapping down twice. The two arrows point out a double bottom, but the market printed a strong upward moving bar on strong volume 20 minutes before the close.
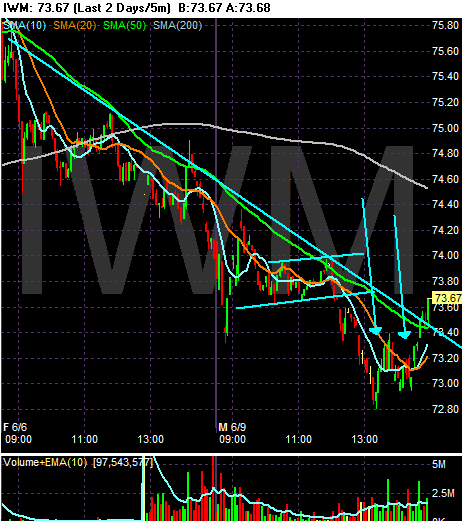
The IWMs dropped at the open, but moved sideways until they found resistance at the downward trend line started on Friday. The market moved lower until it formed a double bottom (pointed out by the two arrows). The market rallied at the end of the day, eventually closing above the resistance line started on Friday.

The SPYs moved sideways for most of the morning. However, the bar that printed at noon shows a strong move downward move, followed by a continued move downward with a heavy volume spike 15 minutes later. The market continued to move lower until about 1:45 when the market rebounded. The SPYs printed a double bottom and then broke through the 10 and 20 minute SMA to close right around the 61.8% Fibonacci level from the morning's sell-off.

Notice the QQQQs continued their downward move started on Friday. The market opened lower then consolidated sideways. However, the 50 minute SMA provided resistance right around noon and the marker moved lower, eventually gapping down twice. The two arrows point out a double bottom, but the market printed a strong upward moving bar on strong volume 20 minutes before the close.

The IWMs dropped at the open, but moved sideways until they found resistance at the downward trend line started on Friday. The market moved lower until it formed a double bottom (pointed out by the two arrows). The market rallied at the end of the day, eventually closing above the resistance line started on Friday.
Gas at $4/ Gallon
From Bloomberg:
There's only so much strain consumers can take. At some point, they will day, "to hell with it" and stop spending. In addition, at some point, prices will start to really impact overall consumer behavior. In fact, price may already be at that level. For example, in their recent announcement of 4 plant closings, GM stated consumers were walking away from big SUVs in droves and moving into smaller, more fuel-efficient cars. Because of the importance of car purchases in the consumer budget this is huge news and could signal an incredibly large shift in consumer behavior.
Let's add to that predictions like these:
U.S. gasoline rose to $4 a gallon at the pump for the first time, threatening to further shake the confidence of consumers whose spending makes up two-thirds of the economy.
.....
``The fact that confidence has gone down as inflation expectations are going up indicates gasoline has been an important driver because it's one of the reasons expectations are rising,'' Nigel Gault, chief U.S. economist at Global Insight Inc. in Lexington, Massachusetts, said.
Consumers are already rattled by falling home values and a weakening job market, prompting them to curb spending and threatening to halt the six-year expansion. Consumer confidence in May fell to a 28-year low, as inflation expectations rose to their highest in more than two decades, according to last month's Reuters/University of Michigan sentiment survey.
There's only so much strain consumers can take. At some point, they will day, "to hell with it" and stop spending. In addition, at some point, prices will start to really impact overall consumer behavior. In fact, price may already be at that level. For example, in their recent announcement of 4 plant closings, GM stated consumers were walking away from big SUVs in droves and moving into smaller, more fuel-efficient cars. Because of the importance of car purchases in the consumer budget this is huge news and could signal an incredibly large shift in consumer behavior.
Let's add to that predictions like these:
Oil prices are likely to hit $150 a barrel this summer season, the global head of commodities research at Goldman Sachs said on Monday, as tighter supplies outweigh weakening demand.
"I would suggest that the likelihood of that happening sooner has increased tremendously ... sometime in summer," Jeffrey Currie told an oil and gas conference in the Malaysian capital, referring to oil at $150 a barrel.
Goldman Sachs, the most active investment bank in energy markets and one of the first to point to triple-digit oil more than two years ago -- a once unthinkable level -- said last month oil could shoot up to $200 within the next two years as part of a "super spike."
Will We See a Second Half Rebound?
From Newsweek:
First the good news:
Both of these events are net positives for the economy. For the next few months, the stimulus checks are going out. They are already responsible for the increase in Wal-Mart's recent sales report. In addition, cheaper money is usually a good way to get the economy moving.
But here's the bad:
Let's take these one at a time.
There is a ton of debt in the system which will blunt the effects of lower interest rates. I wrote this last week:
Simply put, the US is literally drowning in debt. And it's going to take awhile to pay this debt off.
The housing crisis shows no signs of abating. The ultimate sign of problems is the massive drop in price:
When prices drop that much, you've got a problem.
We're still getting mixes news on the credit crisis front. Libor is still higher than the Federal Funds rate, indicating banks are still reluctant to lend to one another. In addition, the TED spread is still high, although it has come in a bit:
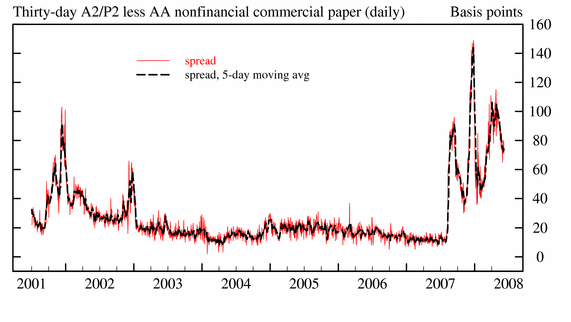
While some analysts have said the crisis is over (or has at least turned the corner) there are still sign of problems. For example:
As a result of events like this, some analysts see problems for the foreseeable future:
And then there is oil. Here's the daily chart:
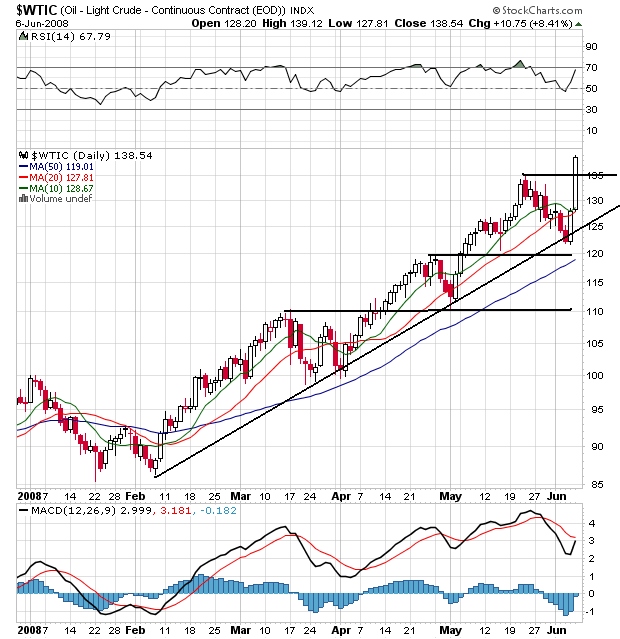
This is a bull market chart. Notice the following:
-- Prices are above all the SMA
-- All the SMAs are moving higher
-- The shorter SMAs are higher than the longer SMAs
-- Prices have continually moved through upside resistance
This is a bull market chart, plain and simple.
And here's a chart of gas prices from the latest This Week in Petroleum:
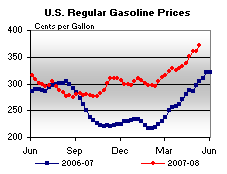
Not a pretty picture, is it?
And I'll add my own biggie: job growth stinks:
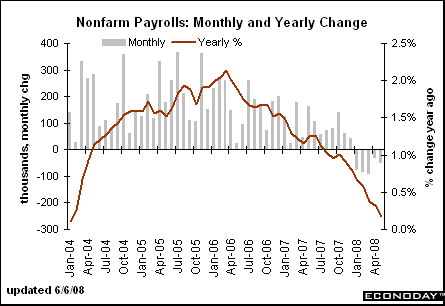
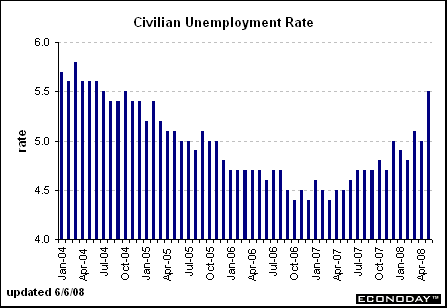
Bottom line -- it just doesn't look that promising right now.
First the good news:
The cause for optimism: the U.S. has called in the economic cavalry, which has responded in textbook fashion. The Federal Reserve has aggressively cut interest rates, bringing the Federal Funds rate down from 5.25 percent last September to 2 percent. Earlier this spring, Congress and President Bush, in a rare moment of bipartisan accord, passed a stimulus package, which will shove nearly $100 billion into the pockets of American consumers by mid-July.
Both of these events are net positives for the economy. For the next few months, the stimulus checks are going out. They are already responsible for the increase in Wal-Mart's recent sales report. In addition, cheaper money is usually a good way to get the economy moving.
But here's the bad:
But this downturn is likely to last longer than the eight-month-long recession of 2001. While the U.S. financial system processes popped stock bubbles quickly, it has always taken longer to hack through the overhang of bad debt. The head winds that drove the economy into this dead calm— a housing and credit crisis, and rising energy and food prices—have strengthened rather than let up in recent months. To aggravate matters, the twin crises that dominate the financial news—a credit crunch and the global commodity boom—are blunting the stimulus efforts. As a result, the consumer-driven economy may not bounce back as rapidly as it did in the fraught months after 9/11.
Let's take these one at a time.
it has always taken longer to hack through the overhang of bad debt
There is a ton of debt in the system which will blunt the effects of lower interest rates. I wrote this last week:
Total debt outstanding -- that is personal, corporate and government debt outstanding -- is $31.758 trillion. Total US GDP is $14.196 trillion. That means that there is 2.23 times the amount of debt in the US relative to the total value of the US economy.
Total household debt is $13.960 trillion. That means total household debt as a percentage of GDP is 98.33%. Disposable income at the national level is $10.502 trillion. That means that total household debt is 132.92% of disposable income at the national level.
Simply put, the US is literally drowning in debt. And it's going to take awhile to pay this debt off.
The head winds that drove the economy into this dead calm— a housing and credit crisis, and rising energy and food prices—have strengthened rather than let up in recent months
The housing crisis shows no signs of abating. The ultimate sign of problems is the massive drop in price:
May 27 (Bloomberg) -- Home prices in 20 U.S. metropolitan areas fell in March by the most in at least seven years, pointing to weakness in the housing market that will constrain economic growth.
The S&P/Case-Shiller home-price index dropped 14.4 percent from a year earlier, more than forecast and the most since the figures were first published in 2001. The gauge has fallen every month since January 2007.
Prices continue to slide as record foreclosures put more homes on the market and stricter lending standards make it harder to get loans. Falling home values are slowing consumer spending, threatening to halt the six-year expansion.
``There is excess supply, weakening demand, prices are falling and will continue to fall,'' said Kevin Logan, senior market economist at Dresdner Kleinwort in New York. ``Housing sales are still trending lower.''
When prices drop that much, you've got a problem.
We're still getting mixes news on the credit crisis front. Libor is still higher than the Federal Funds rate, indicating banks are still reluctant to lend to one another. In addition, the TED spread is still high, although it has come in a bit:

While some analysts have said the crisis is over (or has at least turned the corner) there are still sign of problems. For example:
Lehman unloaded at least $120 billion of holdings in the second quarter, said people with direct knowledge of the matter. At least $18 billion of the assets were tied to mortgages and leveraged-buyout loans that plummeted in value, said one of the people, who declined to be identified because the figures haven't been disclosed.
``They're doing all the right things, such as de-leveraging aggressively, but these are stressful times, and they don't always get the credit they deserve,'' said UBS AG analyst Glenn Schorr, who has a ``neutral'' rating on Lehman. ``Although Lehman is very different than Bear, there's one similarity, and that's what could undo all the other positives: perceptions can become reality.''
As a result of events like this, some analysts see problems for the foreseeable future:
Fund manager BlackRock expects the global credit crisis to last another two to four years as a weakening U.S. economy triggers more writedowns by banks, its chief investment officer for equities said on Monday.
"The credit crisis will be with us for a long time," said Bob Doll, CIO and also vice chairman of the U.S. money manager, which managed $1.36 trillion in assets at the end of March.
"The deleveraging of the financial system, which is the outgrowth of the credit crunch, will likely last a couple of more years -- two, three, four," he said.
Financial institutions around the globe such Citigroup and UBS have suffered more than $300 billion of write-downs and credit losses during a credit crisis triggered by the collapse of the U.S. subprime mortgage market.
And then there is oil. Here's the daily chart:

This is a bull market chart. Notice the following:
-- Prices are above all the SMA
-- All the SMAs are moving higher
-- The shorter SMAs are higher than the longer SMAs
-- Prices have continually moved through upside resistance
This is a bull market chart, plain and simple.
And here's a chart of gas prices from the latest This Week in Petroleum:

Not a pretty picture, is it?
And I'll add my own biggie: job growth stinks:


Bottom line -- it just doesn't look that promising right now.
Market Mondays
Wow - what a sell-off on Friday. The big news was the employment report -- or the lack thereof. Simply put, we're shedding jobs, and have been for some time on a year over year basis. I dealt with the numbers more here. The huge jump in gas prices didn't help either. Basically, we learned that things aren't that hot and that "Goldilocks" isn't in the house right now.
Let's see what the charts say is going on. The overall picture is very interesting.
First we have the SPYs
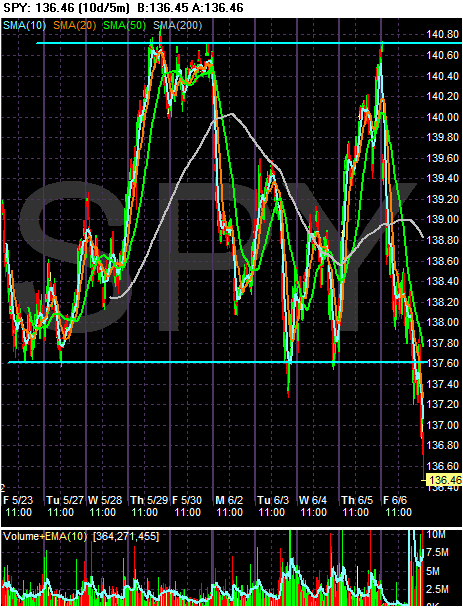
On the 10 day, 5 minute chart notice the SPYs have been bouncing between 137.60 and about 140.70 for the last ten days. We've started this 10-day period (2 weeks ago) down around 137.60, then spiked to 140.60 level on May 29 and 30. Prices dopped back down to the 137.60 area by last Wednesday, but they rallied again on Thursday. Then came Friday, when prices moved below the 137.60 level in a convincing way. Also note the heavy volume spike at the end of trading -- no one wanted to hold anything over the weekend. This indicates a great deal of concern among traders.
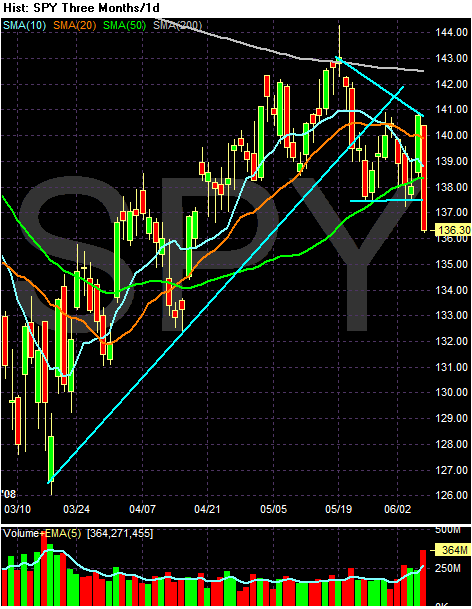
On the SPYs weekly chart, notice the following:
-- Prices hit the 200 day SMA about two and a half weeks ago. Since then they have retreated. Prices could not get across the 200 day SMA.
-- Prices dopped to the 50 day SMA, rallied to the 10/20 day SMA, fell back, rallied again, and are now through the technical support offered by the 50 day SMA.
-- The 10 and 20 day SMA are both moving lower
-- The 10 day SMA crossed below the 20 day SMA.
This chart is turning bearish.
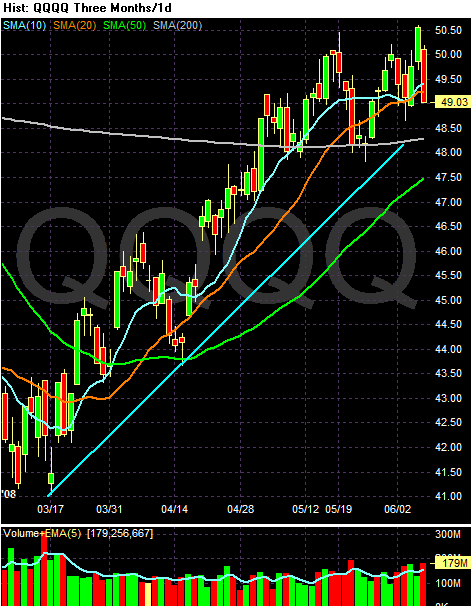
On the QQQQs 3 month chart, notice the following
-- The chart is still in an uptrend
-- The 10, 20 and 50 day SMAs are all moving higher.
-- The smaller SMAs are above the longer SMAs
-- Prices are above the 200 day SMA
In other words -- this is still a good chart. While you could argue the index may be forming a double top, we're still way too early to make a formal call.
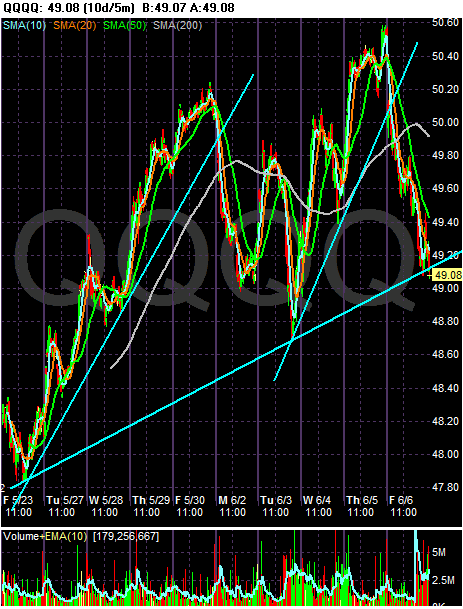
On the 10-day chart, notice the overall trend is up, and there are some minor ups and downs. However -- also notice that prices closed just below the 10-day trend line on Friday. That makes today's open that much more important.
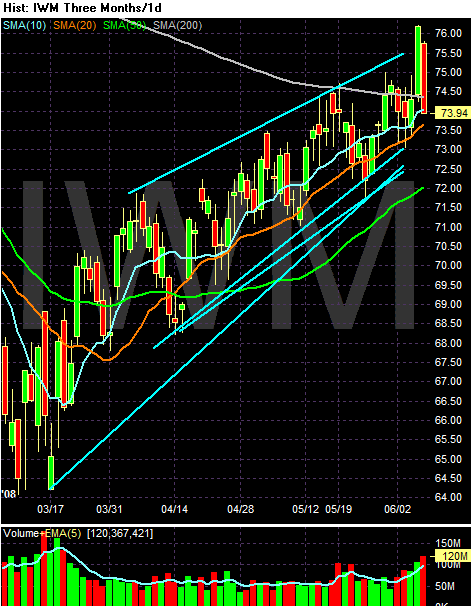
On the IWMs 3-month chart, notice the following:
-- The chart is still in an uptrend
-- Prices made a convincing move above the 200 day SMA on Thursday, but quickly retreated below that level on Friday's sell-off
-- The 10, 20 and 50 day SMAs are all moving higher
-- The 10 day SMA is > 20 day SMA which is > 50 day SMA -- a bullish alighment
-- Prices retreated to the 10 day SMA on Friday's sell-off
This is still a bullish chart
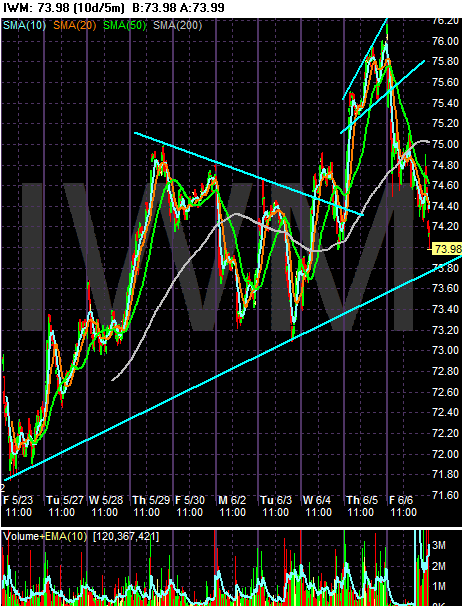
The 10 day, 5-minute chart of the IWMs still has an upward bias. There have been two mini-rallies and sell-offs, but the overall trend remains.
So -- what does all of this mean?
The SPYs are in danger of turning bearish, but the QQQQs and IWMS still have strong formations. The question now becomes "will the SPYS lead the market lower, or will the other averages pull the market higher?"
Let's see what the charts say is going on. The overall picture is very interesting.
First we have the SPYs

On the 10 day, 5 minute chart notice the SPYs have been bouncing between 137.60 and about 140.70 for the last ten days. We've started this 10-day period (2 weeks ago) down around 137.60, then spiked to 140.60 level on May 29 and 30. Prices dopped back down to the 137.60 area by last Wednesday, but they rallied again on Thursday. Then came Friday, when prices moved below the 137.60 level in a convincing way. Also note the heavy volume spike at the end of trading -- no one wanted to hold anything over the weekend. This indicates a great deal of concern among traders.

On the SPYs weekly chart, notice the following:
-- Prices hit the 200 day SMA about two and a half weeks ago. Since then they have retreated. Prices could not get across the 200 day SMA.
-- Prices dopped to the 50 day SMA, rallied to the 10/20 day SMA, fell back, rallied again, and are now through the technical support offered by the 50 day SMA.
-- The 10 and 20 day SMA are both moving lower
-- The 10 day SMA crossed below the 20 day SMA.
This chart is turning bearish.

On the QQQQs 3 month chart, notice the following
-- The chart is still in an uptrend
-- The 10, 20 and 50 day SMAs are all moving higher.
-- The smaller SMAs are above the longer SMAs
-- Prices are above the 200 day SMA
In other words -- this is still a good chart. While you could argue the index may be forming a double top, we're still way too early to make a formal call.

On the 10-day chart, notice the overall trend is up, and there are some minor ups and downs. However -- also notice that prices closed just below the 10-day trend line on Friday. That makes today's open that much more important.

On the IWMs 3-month chart, notice the following:
-- The chart is still in an uptrend
-- Prices made a convincing move above the 200 day SMA on Thursday, but quickly retreated below that level on Friday's sell-off
-- The 10, 20 and 50 day SMAs are all moving higher
-- The 10 day SMA is > 20 day SMA which is > 50 day SMA -- a bullish alighment
-- Prices retreated to the 10 day SMA on Friday's sell-off
This is still a bullish chart

The 10 day, 5-minute chart of the IWMs still has an upward bias. There have been two mini-rallies and sell-offs, but the overall trend remains.
So -- what does all of this mean?
The SPYs are in danger of turning bearish, but the QQQQs and IWMS still have strong formations. The question now becomes "will the SPYS lead the market lower, or will the other averages pull the market higher?"
Subscribe to:
Comments (Atom)