Friday, December 10, 2010

Weekend Weimar and Beagle


We'll be back on Monday. Until then:


Weekly Indicators: St. Nick brings lower jobless claims edition

- by New Deal democrat

There was very little in the way of monthly numbers this week. Total consumer credit increased, for the second month in a row, after 2 years of nearly relentless declines. Revolving credit, however, continued to decline. Consumer sentiment improved to the best level in 5 months - including expectations, one of the 10 leading indicators.

But this week's high frequency data included the most noteworthy statistic of all.

The BLS reported 421,000 new jobless claims. The 4 week moving average fell to 427,500, the lowest since early August 2008. Six of the last seven weeks have shown 440,000 or fewer new claims. This week's decline is strong confirmation that we are moving into a lower range. Since mid-August the 4 week average has declined almost like clockwork, a total of over 60,000 in 15 weeks. If this trend continues (no guarantee), the average will drop below 400,000 by February.

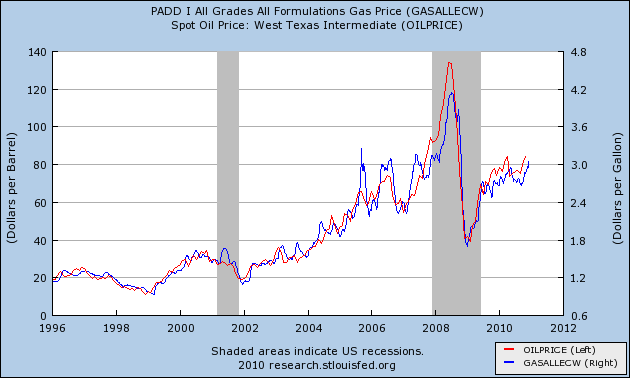
Gas at the pump increased ten cents to $2.96 a gallon last week. This is about $0.25 above its average from a few months ago. Oil increased to over $90 a barrel briefly this week. Gasoline usage rose above that of last year, 9.171 B gallons vs. 9.012 B a year ago. Gasoline stocks remain back in their normal range for this time of year.

The EIA appended an interesting note this week, reading in part:
... U.S. total demand over the February through September period is growing at an even stronger pace, slightly over 500,000 barrels per day on average, or about 3 percent.
.... U.S. year-over-year growth of almost 750,000 to over 900,000 barrels per day in August and September is of an order approaching, or even exceeding, growth levels seen in China. When the swing from huge declines last year to large third quarter growth levels observed this year is taken into account, the U.S. contribution to tightening global balances is considerable. Nevertheless, even given strong growth this year, U.S. oil demand remains well below peak levels seen in 2005
The choke-collar applied by Oil prices to growth is a continuing an chronic problem, and bears continued close scrutiny.

The Mortgage Bankers' Association reported that its seasonally adjusted Purchase Index increased 1.8% last week, the third increase in a row, and rose to yet another post-April high. This series is approaching year-ago levels, without benefit of stimulus. This is good news. Contrarily, the Refinance Index declined yet again, another 1.4% from a week ago, the fourth decrease in a row. Rapidly increasing mortgage interest rates are killing refinancing, and this may have an effect on consumer spending later.

The ICSC reported same store sales for the week ending November 27 increased 2.6% YoY, but were down -2.1% week over week. Shoppertrak reported that sales rose 2.3% YoY in the week ending December 4. They stated, "Annually in the week following the strong Black Friday weekend ... , retailers experience a bit of a lull as consumers recover from the three-day spending frenzy and wait for the next big deal throughout the season. Because of this, ShopperTrak is reporting that even a minimal sales increase should be seen as positive."

Railfax showed that baseline traffic, for the second time since summer, is just barely ahead of last year. On the other hand, both intermodal and cyclical loads are well ahead of last year, and increased in the past week, as opposed to decreasing a year ago.This is a change from the last few weeks.

The American Staffing Association reported for the week ending November 27 their index fell from 101 to 97. This is entirely due to Thanksgiving and this type of drop happens for one week every year.

M1 was up 1.5% for the week, up 2.8% vs. last month, and +9% YoY, meaning "real M1" is up 7.8%. M2 was up less than 0.1%for the week, 0.4% vs. last month, and 3.1% YoY, meaning "real M2" is up 1.9%. Real M2 has stalled without being able to break out of the "red zone" below +2.5% YoY.

Weekly BAA commercial bond rates remained flat last week back at 5.95%. This compares with yields on 10 year bond yields going up .09%. This suggests investors are "reaching for yield" and is inconsistent with any stress on corporate bonds.

The Daily Treasury Statement showed receipts in the first 6 reporting days of December of $44.8 B vs. $38.3 B a year ago, for a gain of 19%! For the last 20 days, however, the YoY gain is only 4%, $134.1 B vs. $128.8 B a year ago.

Finally, a special weekly indicator: contrary to the DK Pied Piper of Doom, Bank of America failed to implode this week, it's shares instead rising above their 50 day moving average.

P.S. We have a lot of new readers this week, and we're not exactly sure where you all are coming from. If you just started reading this blog, please leave a comment and let us know how you were pointed here.

Have a nice weekend!

Where is Job Growth Coming From?

Something that I've been interested in doing, but simply have not had the time to do, is break down the establishment survey data and normalize it to see where we are seeing job growth. That is the purpose of this article -- to see where jobs are coming from. I've taking the establishment data from Summary Table B of the latest BLS report, and broken the data out according to the various sub-groups (construction, retail trade etc..). I've tried to put similar job activities on the same graph (goods producing, professional services etc..) but probably came up short in my classification scheme. Finally, I normalized the data, placing everything on a scale of 100.


Goods producing industries -- natural resource and mining, construction and manufacturing jobs -- all lost jobs during the recession. However, since the end of the recession, only the natural resource and mining sector has added a significant amount of jobs.


Of the professional, financial services and information service jobs sector, only the professional services sector has seen any job growth.


Interestingly enough, retail trade has not seen a meaningful increase (despite some strong retail sales numbers), although leisure and hospitality is seeing some growth (although not at a strong pace).


Wholesale trade and transportation jobs are increasing, but at a very slow rate.


The government sector is actually cutting jobs right now.


Education and health care employment continues to increase -- and saw no decrease during the recession.

Yesterday's Market


The equity market opened with a gap higher, but then moved lower in a downward sloping pennant pattern. Prices traded sideways for a period of time, getting caught in the EMAs. They tried to move higher at the end of trading (d), but this amounted to a grinding higher move rather than a strong rally.


Notice that equity prices are still caught right above key support (a), although there are plenty of strong technical developments: a strong EMA picture (b), a rising MACD (c), and a rising A/D and CMF line. I'm still expecting prices to move back to an EMA before a move higher.


Yesterday, the Treasury market was more or less flat, with prices closing near their opening level (a). However, there was a strong sell-off (b) and attempt at at rally (c) during the day. The fact prices returned to a median indicates the current sell-off may be nearing an end, at least for this round.


On the daily chart, notice the Treasury market has now printed two small bars (b) after falling in a downward sloping pennant pattern (a). Smaller bars are considered weaker.


The oil market is still trading right at key levels (a). Notice that price are still printing small bars right at key price levels -- traders aren't selling but they aren't buying either. They're waiting for .... something.

Thursday, December 9, 2010

Initial Claims Are Finally Moving in the Right Direction


The 4-week moving average has been moving lower for the last four months, which is obviously a far better trend than the near stagnation we were seeing for most of this year.

Oil and the Recovery redux: go read Econbrowser

- by New Deal democrat

I was going to put up a nice in depth post about how Oil prices hitting $90 again created the danger of yet another slowdown if it continued (setting up an interesting juxtaposition with the LEI), together with this nifty graph:


when I see that. lo and behold, Prof. James Hamilton today already said everything I wanted to say, and much better too. So go read Econbrowser.

Well, OK, I'll add one comment: Oil remains a choke collar on growth. Every time it takes off, Oil goes right back to $90.

The Bond Market Does Not Like the Tax Deal

From Marketwatch.com

Treasury prices fell on Wednesday, pushing yields on 10-year notes to the highest level since June, as investors signal worry that the U.S. is not dealing with its budget deficit.

Yields on 10-year notes /quotes/comstock/31*!ust10y (UST10Y 3.26, -0.01, -0.40%) , which move inversely to prices, rose 10 basis points to 3.24%.

The yields touched 3.34%, the highest level in six months and up from 2.94% on Monday -- still the biggest 2-day increase since June 2009 in late afternoon trading.

Yields on 2-year notes /quotes/comstock/31*!ust2yr (UST2YR 0.61, -0.02, -3.19%) rose 9 basis points to 0.62%, having touched the highest since July: 0.65%.


.....

On Tuesday, yields jumped by the most since June 2009 after the White House and Republicans revealed a tax-compromise bill that is expected to boost consumer spending and growth, but also increase the federal deficit and trigger more debt issuance. See story on Obama, tax deal.


Let's go to the chart:


Prices were stable on Monday (a), but gapped lower on Tuesday morning and moved lower throughout the day, hitting resistance at the EMAs (c). Prices gapped lower again yesterday (d), but rallied back to near the open by the close. Prices have dropped 2.58% in the last three days -- which is a pretty big move for the bond market, unless there is a fundamental problem. Bonds just aren't that volatile. So, when we see a 30 basis point increase in the yield on the 10-year in a few days, we should take notice.

Here's the deal: as NDD and I mentioned yesterday, the tax deal is not about cutting the deficit, which is really ironic in a very painful way because all we've heard for the last two years is how we need to get the deficit under control. In addition, considering that personal income taxes as a percent go GDP are near their historical norm and total federal taxes are near 60 year lows, it's not as though we are being taxed to death.

The short version is the only way to deal with the deficit is to raise taxes and cut spending; the gap between expenditures and receipts at the federal level is simply too wide to be tackled with any other methodology.

Update: A commenter has added that Krugman has argued this is a sign of recovery, a point I made in today's market report:

So -- we have a rising stock market and declining bond market. This is usually the beginning of the second part of the market moves in a bull market. In the first, both Treasuries and stocks rally. Treasuries rally because there is still concern about the economy and little fear of an increase in rates, while equities rally in anticipation of recovery. In the second part of the rally, Treasuries start to sell off as the safe money starts to move into the riskier parts of the market.


However, one point I didn't factor into my previous statement was the timing of the bond market sell-off (which started in earnest this week) and the depth of the sell-off (2.5% in two days). I believe a gradual sell-off in bonds would be more indicative of a move from fixed income to equities -- say a 5% drop in bonds over a month. That being said, Krugman's observations are also a valid interpretation of recent bond market events.

Wednesday, December 8, 2010

Yesterday's Market


Prices dropped right after the open (a), bit a momentum bottom (b) and then started to grind higher (c). Notice the the accompanying momentum indicator was barely moving higher; hence, the word grinding.


After moving through key resistance prices have printed two weaker candles (a). However, the A/D and CMF (c and d) still indicate we're seeing a net inflow into the market and the MACD (e) indicates momentum is positive. However, given the last two days of price action, I would not be surprised to see prices move lower to the 10 or 20 day EMA to blow off some steam before resuming higher.


On the IEF, notice the gap down a little over a week ago (a), followed by a consolidation (b), followed by another gap lower (c). Prices then moved lower still and gapped lower at today's open. There is a pretty big exodus out of the market right now.


Notice that prices are moving lower still, although they have printed a hanging man (a). We're still seeing a net outflow of cash (b and c) and declining momentum (d).

So -- we have a rising stock market and declining bond market. This is usually the beginning of the second part of the market moves in a bull market. In the first, both Treasuries and stocks rally. Treasuries rally because there is still concern about the economy and little fear of an increase in rates, while equities rally in anticipation of recovery. In the second part of the rally, Treasuries start to sell off as the safe money starts to move into the riskier parts of the market.


The dollar has rebounded from its recent drop, but has hit resistance at Fibonacci levels (a).


Oil may be entering a new phase. First, it has broken through the lower 80's resistance it was hitting for a few months. In addition, it is in a good short rally right now (A). Prices have printed some very strong price bars (B) and are currently hitting resistance at previous levels (D). Notice that over the last four days the price action has been extremely narrow (C). There has not been a sell-off, where traders take profits after a short rally. Considering the strength and quickness of the last rally, that is interesting. In addition, momentum has room to run (E). In short -- prices are lining up for a move higher, which could be a problem for the economy.

The True Cost of Extending The Bush Era Tax Cuts

- by New Deal democrat

From the NY Times Economix blog, Sunday:
how else Congress could spend $60 billion a year — the annual cost of extending the Bush tax cuts on income above $250,000 a year?
From the NY Times News section, quoting the National Governors' Association, Sunday:
By the end of fiscal 2011, states estimate that they will have spent nearly $240 billion in Recovery Act funds. Within this temporary aid to states, $151 billion has been flexible funds (Medicaid and State Fiscal Stabilization Funds) that has helped states avoid draconian cuts. However, the wind down of these flexible funds in fiscal 2012 will result in a cliff of more than $65 billion.
Maybe all those who lose their jobs or otherwise suffer from state and local budget cuts can get jobs polishing the billionaires' yachts.

Bonddad here:

There are plenty of fiscal issues involved, especially with the high end tax cuts.

Let's start with this question: please draw a "laffer curve" using all available data that demonstrates where the optimum tax rate would be. Here's the answer -- you can't. Tax rates are simply way too complicated to reduce to a graph drawn on a napkin (unless you're in public relations and not economic analysis). In addition, ever notice that everyone who uses the argument that the laffer curve is valid also assumes current tax rates are on the right side of the curve? It never occurs to anyone that rates -- which are already low -- are too low (again, according to the laffer curve).

Let's look at this from the standpoint of personal behavior. Letting the tax cuts expire would not lead to a Herculean increase in tax rates -- that is, we're not seeing a jump from 39.6% to 75%. Instead, we're talking about a few percentage points. To argue this will grossly distort personal behavior in such a manner as to lead the economy into recession is ludicrous.

No -- we are not being overtaxed in the US. According to the CBO, individual income taxes amount to 8.5% of GDP -- which is about in the middle of their historical average and hardly overly burdensome. In addition, total federal taxes are at their lowest level in 60 years.


And no -- tax cuts do not lead to jobs. Ask any business owner what will lead them to hire new employees and they'll all give you the same answer: sales that are increasing at a somewhat predictable rate and a certain amount of overall economic predictability.

Then there is the fact that ratings agencies have stated this move will lead to problems for the US fiscal future.

Then there is the simple issue that it costs money to run a country -- especially one the size of the US. There are roads to pave, kids to educate, services to provide that in one way or another benefit us all. Yet we want everything for free.

Finally -- before the trolls come out -- we also need to cut spending, which I've noted on many occasions as well. Our primary long-term issue is medical expenses as a percent of spending.

LEI's signal re-acceleration of economy in New Year

- by New Deal democrat

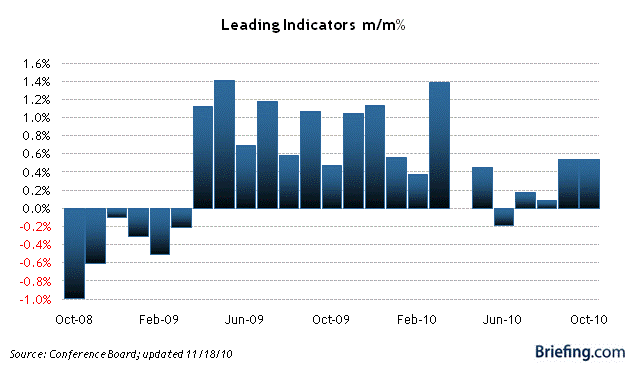
Last springtime, the LEI's really slowed down and were essentially flat in midyear. The summer slowdown hit job growth, and industrial production in particular has gone sideways in response in the last couple of months.

Now the signs are that the economy is set to accelerate after New Year's. As this graph from Briefing.com shows, the LEIs increased to +0.5 in both September and October.


The advance read on the November LEI's from the same service is a whopping +1.2. In addition to the financial component, which has been relentlessly positive for almost two years, Initial Jobless Claims had a big downdraft in November, and supplier deliveries as measured in the ISM manufacturing report increased sharply. Consumer expectations about the future also increased. Meanwhile new capital orders decreased, but were cancelled out by new orders for consumer nondurables. The manufacturing workweek went sideways. Only housing permits remain unknown, and it is not expected that they will change too significantly.

Three months in a row of good numbers strongly suggests the economy will re-accelerate beginning in about January.

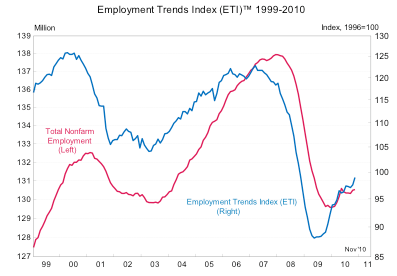
Meanwhile the Conference Board also updated their Employment Trends Index, their leading indicator specifically for jobs. Here is the latest information:


This suggests that job growth will also re-accelerate in the beginning of the new year.

I realize that in an absolute sense the economy is in terrible shape, and this is a long, slow, painful slog -- much moreso than it ought to or has to be. But we are making progress.

This is Not the Way to Improve Income Inequality -- Or, Why Offshoring to Asia Makes Sense

Yesterday, I noted that educational achievement is a big factor in unemployment. Interestingly enough, on the same day, the NY Times noted that US students are performing poorly compared to their counterparts in other countries:

With China’s debut in international standardized testing, students in Shanghai have surprised experts by outscoring their counterparts in dozens of other countries, in reading as well as in math and science, according to the results of a respected exam.

.....

“I know skeptics will want to argue with the results, but we consider them to be accurate and reliable, and we have to see them as a challenge to get better,” he added. “The United States came in 23rd or 24th in most subjects. We can quibble, or we can face the brutal truth that we’re being out-educated.”

In math, the Shanghai students performed in a class by themselves, outperforming second-place Singapore, which has been seen as an educational superstar in recent years. The average math scores of American students put them below 30 other countries.

PISA scores are on a scale, with 500 as the average. Two-thirds of students in participating countries score between 400 and 600. On the math test last year, students in Shanghai scored 600, in Singapore 562, in Germany 513, and in the United States 487.

In reading, Shanghai students scored 556, ahead of second-place Korea with 539. The United States scored 500 and came in 17th, putting it on par with students in the Netherlands, Belgium, Norway, Germany, France, the United Kingdom and several other countries.

In science, Shanghai students scored 575. In second place was Finland, where the average score was 554. The United States scored 502 — in 23rd place — with a performance indistinguishable from Poland, Ireland, Norway, France and several other countries.

US students are performing poorly in science and math -- the two subject areas that will lead to better jobs.

If you were a company that was looking to build a factory/manufacturing facility, where would you locate it? Frankly, offshoring to Asia makes sense because of the far better educated work force.

Yesterday's Market


Prices gapped higher at the open (a) but as indicated by the MACD (e), this was the full brunt of the morning momentum blast, leading to decreasing prices, which first dropped to the EMAs and finally to the 50% Fibonacci retracement level from the previous days low to the mornings high (c). Prices reversed and moved higher, gaining some momentum (f), but eventually fell through support at the close (d).

Considering the strength of the news (the tax cut deal) and the morning gap higher, the end of the day sell-off is a disappointment, indicating weakness in the rally.


Notice that prices printed a downward bar today (a) -- adding further credence to the weakening market argument, which is further bolstered by decreasing volume.


Treasury prices moved lowed yesterday. They gapped lower at the open (a), hit resistance at the EMAs and then moved continually lower, printing lower lows (b) and lower highs (c) throughout the day. Notice that momentum was negative for the whole day (d).


Prices made a big move yesterday, breaking downward support of the downward sloping pennant pattern and moving through the 200 day EMA.


After hitting resistance at the 200 day EMA, the dollar moved lower, and is now entangled with the EMAs (b). Notice that all the EMAs are essentially moving sideways, indicating a lack of overall direction in the market.

Tuesday, December 7, 2010

The Washington Lobotomy Factory Kicks Into High Gear

For the last two years, we've been pummeled with the concept that all this spending and the ever rising deficits will lead to our financial ruin. This was a central tenant to this falls elections. However, to fix the deficit, we're going to have to see two things happen: an increase in taxes and a decrease in spending -- with an emphasis on health care expenditures.

So -- in their first move of the new Congress, did we see a move to raise revenue to help stave off the imminent danger of federal deficit?

No.

We saw a "kick the can down the road' response to the problems we face.

As usual, Washington fell down on the job.

"Two Americas," Income Distribution and Education


Something that Ben Bernanke said in the 60 minutes interview has been sticking in my brain. When asked about income disparity, Bernanke commented on the current situation with the unemployment rate and educational achievement. To that end, consider this chart from Calculated Risk that shows the unemployment rate by educational achievement. Notice that the lower one's educational achievement, the higher the unemployment rate. Also notice the wide margin -- less education means a remarkably higher rate of unemployment. I realize that education is not the be all and the end all but it is obviously a very important factor in this equation.

Employment Thoughs

Consider the following chart of total private jobs:


Notice the private sector job situation actually turned faster after the latest recession compared to the previous two recession. However, the real issue is the amount of job losses that occurred during the recession -- notice the steep decline that occurred during the last recession.


Prices had an early morning rally (a), followed by a quick reversal bounded by two trend lines (b and c). This was followed by a grinding rally for most of the rest of the day (d). However, there was a strong sell-off at the end of trading (e).


Notice that prices are right at important resistance levels (a). However, yesterday prices did not make any upward progress.


Prices gapped higher at the open. But as is typical with that development, the MACD (d) indicated that all the momentum occurred at that one move (d). Prices moved down to the 50% retracement level (b) but rallied for the rest of the day (c).


The overall trend in the Treasury market is still lower (a), with prices forming a downward sloping pennant pattern. Also note the very bearish EMA picture -- all are moving lower, the shorter are below the longer and prices are below all of the EMAs.


Oil has overcome the technical resistance it encountered in the lower 80s (A). Prices have twice advanced strongly beyond this level (B and C). Notice that prices are now at important technical levels (C). Also note the MACD (D) has given a buy signal. At some point, oil can become a problem for the economy.


Gold has three trends. First, there is the strong uptrend (A) of prices followed by a triangle consolidation that moves sideways (B). This is followed by a strong upside breakout (C). Also note the MACD has given a buy signal (D).

Monday, December 6, 2010

No Really -- The Economy Is Doing Well

From the AP:

The economy is starting to fire on almost every cylinder these days but the one that matters most: Job creation.

Factories are busier. Incomes are rising. Autos are selling. The holiday shopping season is shaping up as the best in four years. Stock prices are surging.

And many analysts are raising their forecasts for the economy's growth. Goldman Sachs, for instance, just revised its gloomy prediction of a 2 percent increase in gross domestic product in 2011 to 2.7 percent and forecast 3.6 percent growth for 2012.

"The upward momentum has more traction this time," says James O'Sullivan, chief economist at MF Global.

If only every major pillar of the economy were faring so well.

Despite weeks of brighter economic news, employers still aren't hiring freely. The economy added a net total of just 39,000 jobs in November, the government said Friday.

That's far too few even to stabilize the unemployment rate, which rose from 9.6 percent in October to 9.8 percent last month. Unemployment is widely expected to stay above 9 percent through next year, in part because of the still-depressed real estate industry.


What's important here is the following:

1.) I'm not the only person who has noticed that the economy is doing well;

2.) In reality, there are a lot of reasons for economists to be optimistic.

Bernanke On 60 Minutes

I remember when I was a kid, on Sunday nights the family would have dinner and watch 60 minutes. It was the only time we would watch TV at dinner. Back then, 60 minutes was "it." I don't know if it still is or not, but last night Bernanke was on 60 minutes. He seems to be engaging more -- which I think is very good, considering our political discourse is dominated by abject stupidity. I caught the last half of the interview. Here is the interview in its entirety.

November Jobs Report will probably be revised significantly higher

- by New Deal democrat

Take a deep breath. The November jobs report was either an outlier, or at least at the low end of the expected range of error in the trend. That's probably why the stock market shrugged it off on Friday. The odds are very good that it will be revised significantly higher in the next two months. Regardless, since the source of the problem was how to deal with seasonal retail hiring, the best view is to average the October and November reports together. That means even without upward revisions the economy added ~105,000 jobs a month in the last two months - and it is likely to look better within 60 days.

First of all, let's put this in perspective. Even though Friday's jobs report felt like a kick in the gut, at this time last year we were dealing with relentless job losses. November 2009 job losses had just preliminarily been reported as -11,000, and that was over 100,000 better than the next least-worst report. By contrast, here are the monthly jobs numbers (in thousands), excluding census, for 2010:

MonthJob gains
Jan+5
Feb+23
Mar+160
Apr+147
May+21
Jun+50
Jul+77
Aug+113
Sep+53
Oct+172(p)
Nov+39(p)

Every single 2010 jobs number has been positive. No, it's not enough to overcome population growth, which would require about 150,000 a month. Nor is it enough to really begin undoing the job losses of the Great Recession, which would probably require at least 300,000 a month. But excepting the summer slowdown, we have been moving in the right direction for a long time.

Secondly, we have been here before. Here is something Bonddad wrote after September 2009 had just been reported as showing -263,000 jobs lost, another "feel like I've been kicked in the gut" report:
this is a clear step in the wrong direction. Considering the rate of job losses at the beginning of the year (600,000+/month) expecting an immaculate recovery is highly unrealistic. However, the bleeding has to stop at some point. So by the end of this year we have to be far lower than today's number for a recovery to be viable. Consumers cannot continue to hear news like this and expect to have a positive attitude about the economy. It's that simple.
Two months later, that had been revised to -139,000, and November would ultimately be revised to +4,000, the first positive jobs report after the bottom of the Great Recession.

Keep that thought in mind and consider the following: here is the change between initial and final jobs report for each month so far this year, with the net change (including census jobs, which have no impact on the result):

MonthInitialFinalnet change
Jan-20+14+34
Feb-36+39+75
Mar+162+208+46
Apr+250+313+63
May+431+432+1
Jun-125-175-50
Jul-131-66+75
Aug-54-1+53
Sep-95-24+71
Oct+151 +172(p)+21(p)
Nov+39

(p)=preliminary revision

Every single initial jobs report in 2010 except one has been revised higher. The median final revision of the Jan-Sep initial reports has been +53,000. All but two of the nine that have been finally revised have increased by at least +46,000. A revision of +53,000 to November would give us +92,000. Even if October is not revised any higher, the average of the two months would be +132,000, the best showing since March-April. If October were also revised up +53,000 from its initial report, that would be +204,000 for a two month average of +148,000 and a three month average of +136,000. In other words, just normal revisions in line with those previously this year would put us very close to the point where we are keeping up with population growth -- but we won't know that for sure for 2 more months.

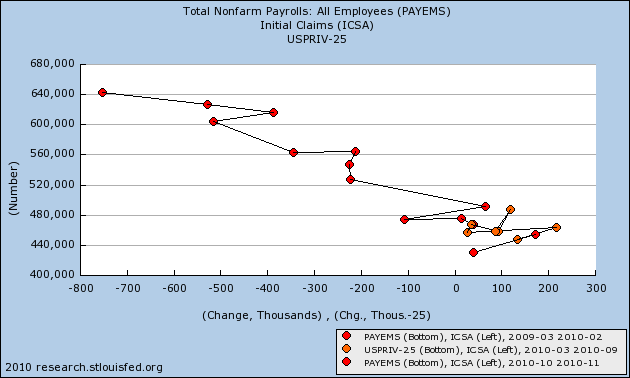
And it is clear that, if November's report wasn't an outlier, than it was at the very low end of the range of error. Here is the update of the scatter graph of Initial Jobless Claims vs. Nonfarm Payrolls since the March 2009 high in claims:


It is pretty clear that the initial November report comes in at the weakest point of the overall trend range.

Third, we know the source of the shortfall in the November report: retail hiring. Every month the BLS includes spreadsheets breaking out the data in their report. Schedule B breaks out the establishment report by type of job. Here is a screenshot of that portion of the spreadsheet dealing with service jobs:


Look at the lines entitled "retail trade" and "other services." Had both of these been at the same levels as October, that would have added +80,000 jobs to the report! Further, compare November with the last two months, and with November last year. The monthly change in both series is significantly lower, retail dramatically so, than even last year when the economy was losing jobs.

So let's break out "retail sales" and "other services" (the two areas that were responsible for the big change between October and November) and take a closer look:

Here is the breakdown of the ultimate Seasonally Adjusted numbers, and m/m change:

First, here is "Other services:"

MonthJobsmonth/month change
Jan5317+3
Feb5310-7
Mar5321+11
Apr5333+12
May5337+4
Jun5330-7
Jul5352+22
Aug5363+11
Sep5410+17
Oct5402(p) +30(p)
Nov4319(p)-8 (p)

The median month over month gain for Jan-Sep was +11. If Oct and Nov simply followed that, (i.e., +11 and +11), then Oct overestimated by +19, but Nov's ultimate number is on the mark.

Now, here is "Retail trade:"

MonthJobsmonth/month change
Jan14409.1+49.1
Feb14416.2+7.1
Mar14438.9+22.7
Apr14453.3+14.4
May14447.5-5.8
Jun14431.3+16.2
Jul14442.4+11.2
Aug14448.8+6.4
Sep1444,9-3.9
Oct14457.9(p) +13.0(p)
Nov14429.8(p)-28.1(p)

The median month over month gain in retail jobs for Jan-Sep was +7.1 If October and November simply added +7.1 each month, then October is too high by ~6, but November is WAY off. November is too low by ~30!

Another way of looking at this is that, according to the BLS, in November we gave back almost every single retail job we added since February. Further, the last time we gave back 30k or more jobs in one month was in October 2009. Is there anybody who thinks that really happened?


Just to check how big (or not) a role revisions to the "retail trade" number was in the overall revisions, I specifically checked the initial vs. final revised number for that item. Here is the result:

MonthInitialFinalnet change
Jan42.149.1+7.0
Feb-0.4+7.1+7.5
Mar14.922.7+7.8
Apr12.414.4+2.0
May-6.6-5.8+0.8
Jun-6.6-16.2-10.2
Jul6.711.2+4.5
Aug-4.9+6.4+11.3
Sep5.7-3.9-9.6
Oct27.9 13.0-14.9(p)

The median change for the "retail trade" series in the Jan-Sep 2010 revisions is only +4.5 thousand, meaning that if the November initial report missed big on retail positions, while not likely it is at least possible that in addition to a significant upward revision on the order of +50,000 for the other items in the initial November report, there could also be a big positive retail jobs revision .

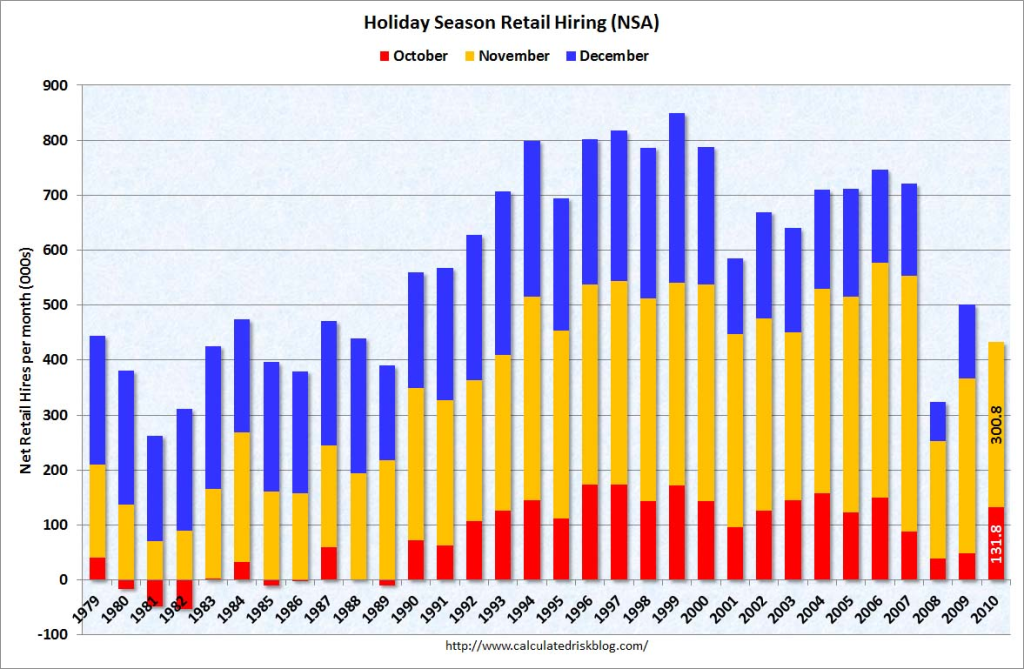
Fourth, it is adjusting for seasonal retail hiring that is the problem. Retailers hire a lot of temporary help for the holiday season. It is a known factor and so is automatically seasonally adjusted. But the adjustment can create outsized effects. In October, the BLS "expected" employers to hire about 118,800 retail employees. In fact they hired 131,800, so the Seasonally Adjusted number was +13,000. In November, the BLS "expected" employers to hire +328,900 retail employees, but they actually hired +300,800, so the inital Seasonally Adjusted number reported on Friday was -28,100.

This is the logic behind the following graph by Calculated Risk, showing non-seasonally adjusted October through December retail hiring for the past 30 years:


Contrast this with, for example, May, when the BLS "expects" employers to add 101.900 "retail trade" jobs, only about 1/3 of November's adjustment.

In short, relatively minor changes in employment plans at this time of year, because of seasonal adjustments, can have outsized effects. As a result, it is probably best to average October and November's reports, as I have done above, to deal with these effects.

Finally, let's bear in mind that both ADP and TrimTabs called for job gains of between 90,000 and 120,000 in November, and both have been consistently understating the BLS reports this year. A revision more in line with those reports would make sense.

In that regard, I have been favored by Matt Trivisonno with a YoY withholding tax graph from his Daily Jobs Update site, current through last week, which adjusts for the "making work pay" credit of the ARRA. It has been relentlessly improving:


This graph has accurately tracked YoY aggregate hours worked in the past ten years, and is currently showing the same YoY% improvement it did at the end of 2004 -- when the economy was consistently adding 200,000 jobs a month.


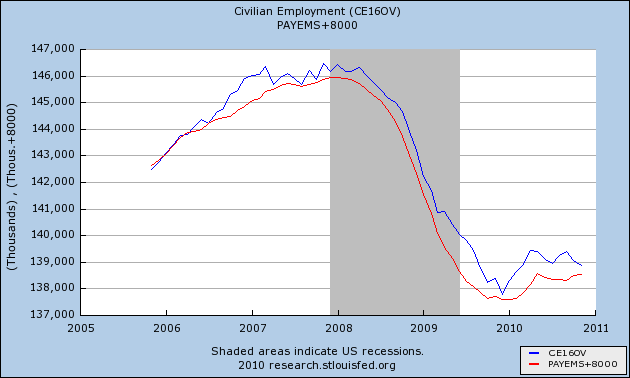
Two caveats: On the other hand, a comparison of the Household Report and the Establishment Report, including Friday's numbers, shows that both have leveled off since the census began its layoffs in May. Furthermore, it cannot be denied that the Household Report has shown actual declines in the last two months, which were not affected by the census at all.


In addition to that very significant caution, bear in mind that the BLS has already told us that they are going to reduce the total jobs count for the 12 months between March 2009 and March 2010 by an average of 30,000 a month. This is very much a wild card. On the one hand, the September 2009 report mentioned at the outset of this post, after having been increased to -113,000, was knocked back down to -225,000 by the yearly adjustment announced this past February. On the other hand, the November 2009 report - the one and only positive report - was actually increased by 64,000 jobs in those yearly revisions. The BLS has historically underestimated job losses during recessions, and underestimated job gains in the first part of a recovery, so it is about equally possible that the revisions which will be announced in February 2011 will go either way.

Bottom line: it is likely, but not certain, that the November payrolls report will be revised significantly higher, and that we continue to move in the right direction. The best approach is to average the October and November reports for the truer trend, which even now is +105,000 each month.

Sunday, December 5, 2010

Yesterday's Market


Considering the disappointment from of the jobs report, Friday's chart is actually decent. Prices moved sideways for most of the day, consolidating in a rectangle pattern (a). Prices broke out in the late afternoon, trading right on top of important levels (b), before moving higher into the close on increasing volume (c).


On the daily chart, prices are right at important resistance levels (a). Also note the EMA picture is bullish (b). The A/D and CMF confirm that more money is moving into the market right now (c and d) and the MACD has given a bullish buy signal (e).


First, on the IEF chart, notice that prices have continued to run into upside resistance at the EMAs and Fibonacci levels.


Treasury prices gapped higher at the open (a), but fell quickly and sharply. They attempted to rally (b) but the MACD indicated the rally was on weakening momentum (c). Prices continued to move lower throughout the rest of the trading day, hitting resistance at the EMAs.


Treasury prices continue to move lower (a) with the EMAs printing a very bearish picture. Also note that money is flowing out of the market (b and c) and momentum is clearly bearish (d).


After breaking the upside trend (a) and moving lower for two days (b), the dollar gapped lower on Friday (c).


Prices hit upside resistance at the 200 day EMA (a) and have since moved lower (a). Prices are now finding support at the 50 day EMA (b). Note the A/D line has printed lower (c) and the CMF is also showing money moving out of the market. Also note the MACD is also about to print a sell signal (e).