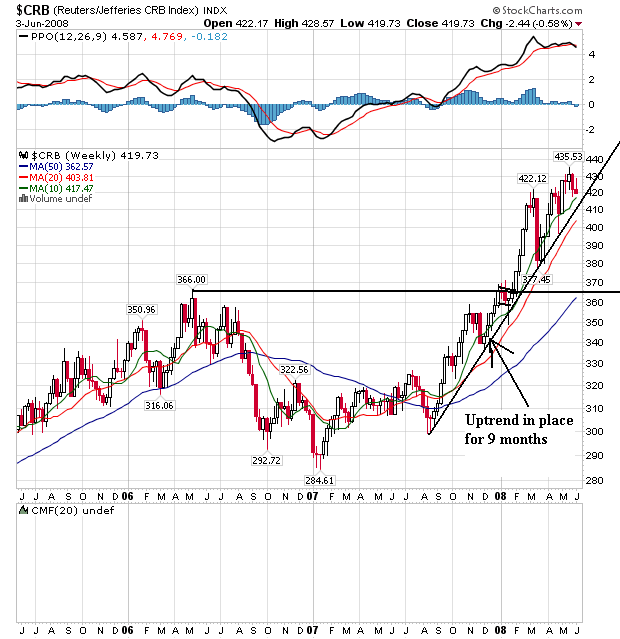
The overall CRB index has been in a rally since the end of last summer and is still there. Notice the index broke through previous price levels at the beginning of this year and has been rallying since.
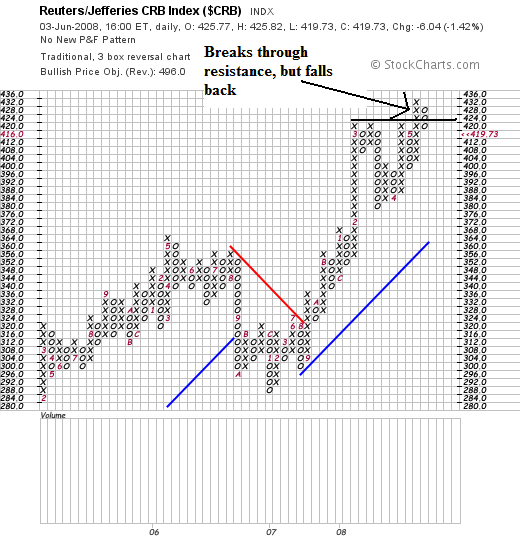
On the P&F chart, notice the prices broke through resistance but have since fallen back. The 427 - 433 area has proven tough to get through.
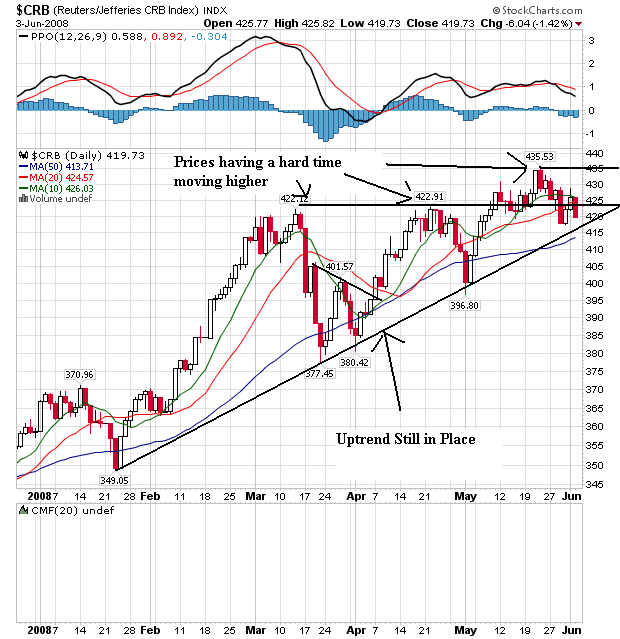
And on the daily chart, we see the difficulty in a bit more detail. Notice prices made two runs at the 422 area before getting through. And now after prices have moved through this area they have retreated a bit.
On the SMA front, notice that prices and the 10 and 20 day SMA are tangled up. The 20 day SMA and the 50 day SMA are still moving higher, but the 10 has stalled a bit. The 10 is more volatile, so this isn't the best long-term predictor. But notice it has stalled a bit as well.
The CRB may be stalling. As with all chart we'll have to wait and see how this plays out. It's also possible we're consolidating for the next move higher as well. So long as prices stay above the long-term trend that is always a possibility.
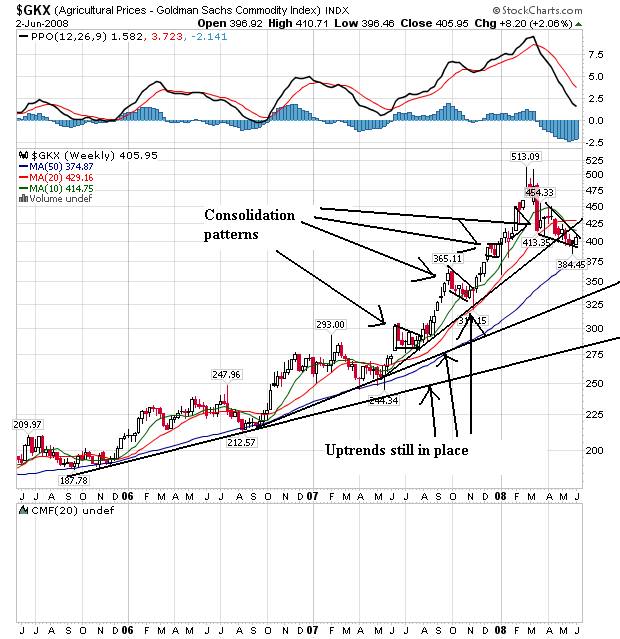
Agricultural prices have been a concern of mine for the last 6-9 months. So the latest price retreat is a welcome development from an inflationary perspective. However, several long-term uptrends are still in place, indicating the latest pennant formation could be a simple consolidation before we move higher.
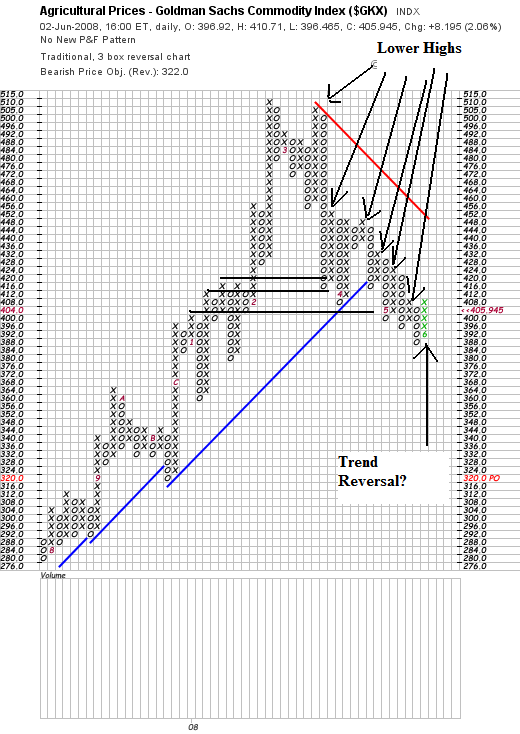
On the P&F chart, notice the series of lower highs, indicating the upward pressure is easing.
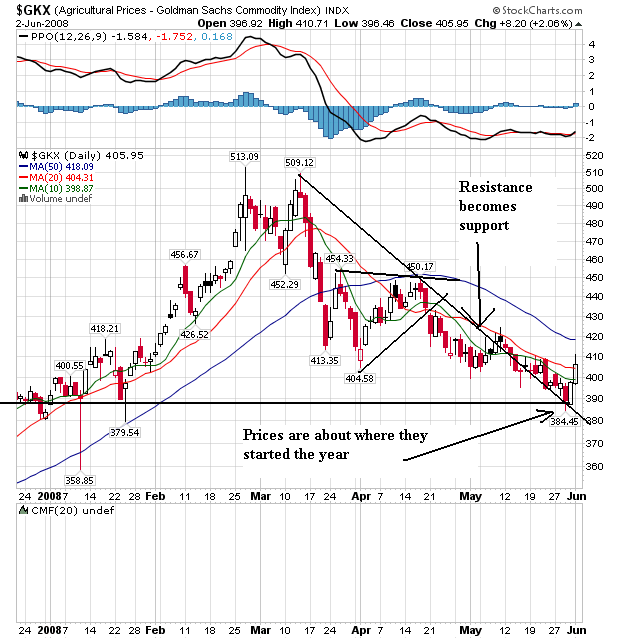
On the daily chart, notice the following.
-- Overall, prices have moved to levels we saw at the beginning of the year
-- The short term SMAs are all pointing lower, with the smaller below the longer. This is a bearish configuration.
-- However, prices have moved through the 10 and 20 day SMA, and the resistance line that started at the recent peak of 509.12 has become support. That could be a sign the market is ready for another move higher.
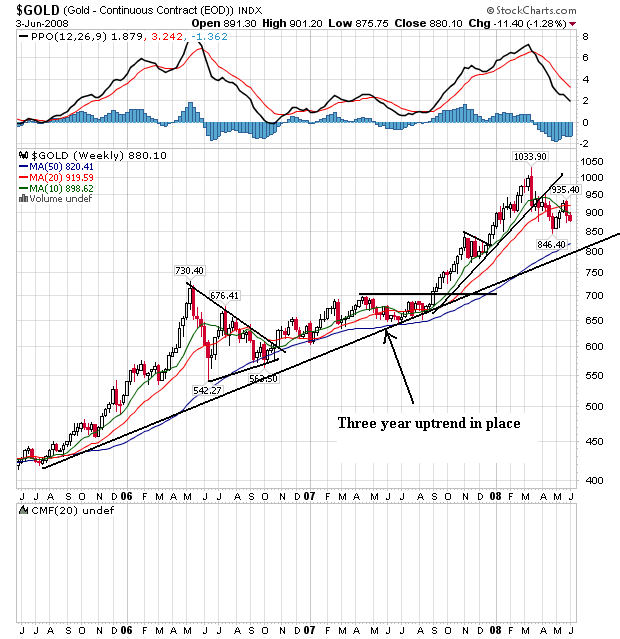
On the three year gold chart, notice the long-term uptrend is in place but prices have retreated over the last few months. This indicates that inflation expectations are still looking at higher future prices, but traders are reevaluating the overall tenor of the economy to see if that could change.
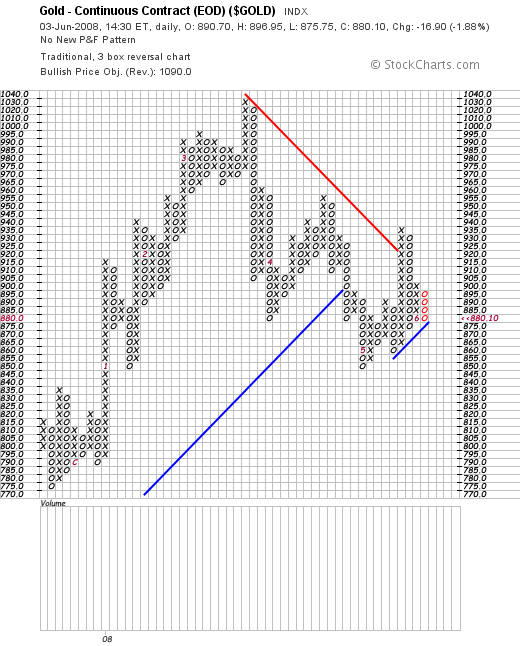
On the P&F chart, notice we have three major price peaks at lower levels.
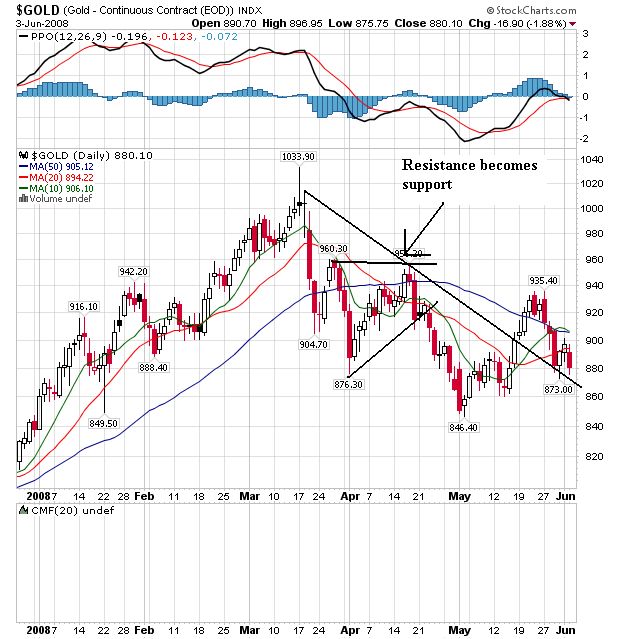
On the daily chart, we have several diverging trends.
-- Prices have dropped from their peak of 1033.90.
-- However, like the agricultural chart, we have resistance becoming short-term support along with a jumbled price/SMA picture. We need some more time with this chart for a long-term trend to develop.