Shoppers spending their government rebate checks helped push May retail sales higher, giving companies such as Wal-Mart Stores Inc. a bigger-than-expected lift.
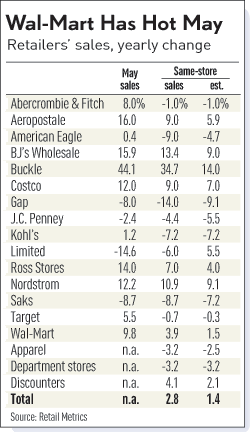
The majority of the growth came at discounters, such as Wal-Mart, Costco Wholesale Corp. and BJ's Wholesale Club Inc. Most department stores' sales declined, and sales at clothing chains fell short of forecasts.
IBD added the following:
Cash-strapped consumers flocked to value-oriented retailers known for low prices on necessities like food, but they scrimped on buys at stores that sell nonessentials like clothes.
.....
Department stores and women's apparel chains continued to struggle. Cooler weather hurt sales of summer goods, said Perkins. But consumers just were not in a mood to buy nonessentials.
"We had these ongoing macro drags like $4 gas, rising food prices and a soft job market, which are very much cutting into discretionary spending," he added.
Same-store sales fell 6.5% at specialty apparel stores and 3.5% at department stores, said Michael Niemira, chief economist at the International Council of Shopping Centers.
.....
But overall, the consumer remains very frugal, Niemira said.
Frugality has led consumers to trade down. Middle- to upper-income households, who typically shop at Target (WMT) and elsewhere, are looking more at Wal-Mart, dollar stores and food discounters, says Frank Badillo, senior economist at TNS Retail Forward.
Here is a graph from IBD that shows how various stores did:

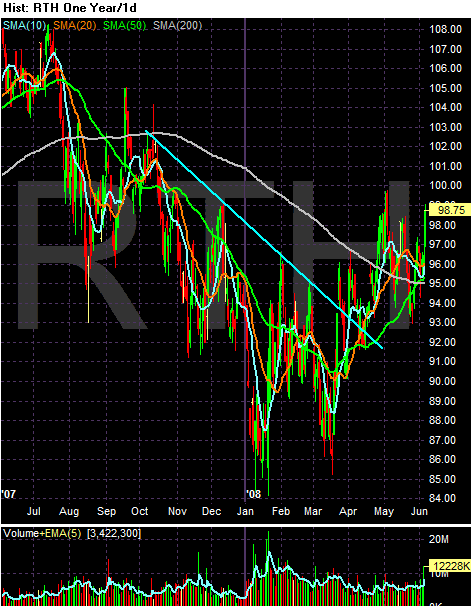
While we're talking about retail, let's look at the retail holders ETF to see how retain is doing overall in the market.

Retail -- like most areas of the market -- dropped after the initial shocks from the credit crisis hit the markets in the late summer of 2007. The index crossed below the 200 day SMA at the end of the summer in 2007 and continued to move lower until mid-March of 2008. Looking at the chart there is a double bottom that formed with the first bottom in January and the second in mid-March. Prices have rallied along with the market since the mid-March rally started.

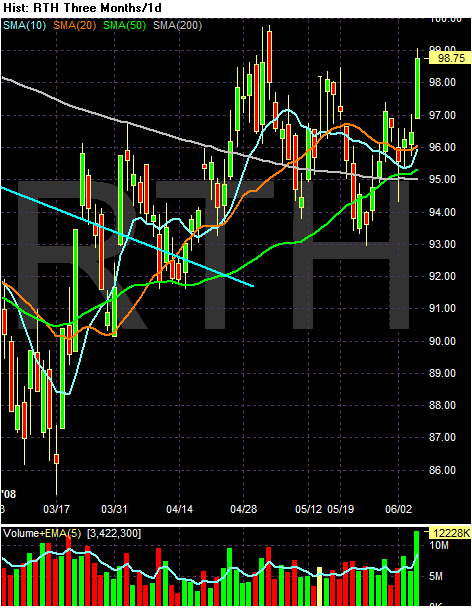
On the 3-month chart, notice the following:
-- Prices are above the 200 day SMA
-- Prices are above all the SMAs
-- Prices are technically in a bullish alignment, with the shorter SMAs above the longer SMAs. But....
-- The 10 and 20 SMAs have been heading lower since the end of April.
-- However, yesterday we saw a big volume move.