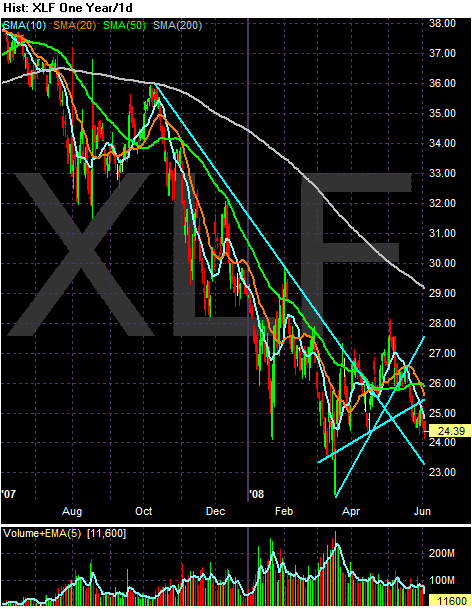
Notice the following points on the long-term chart.
-- Prices broke through their downtrend in May in an attempt at a rally. But they have since fallen.
-- Prices are below the 200 day SMA
-- Prices have broken through two smaller support lines that started in April

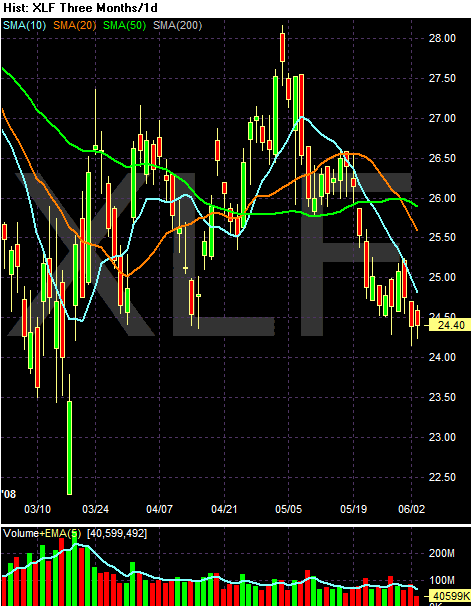
On the three month SMA chart, notice the following:
-- Prices are below all the SMAs
-- The 10 and the 20 have moved through the 50
-- The 10 and the 20 are both headed lower
-- The 50 just turned lower as well
Short version: this chart says sell me.