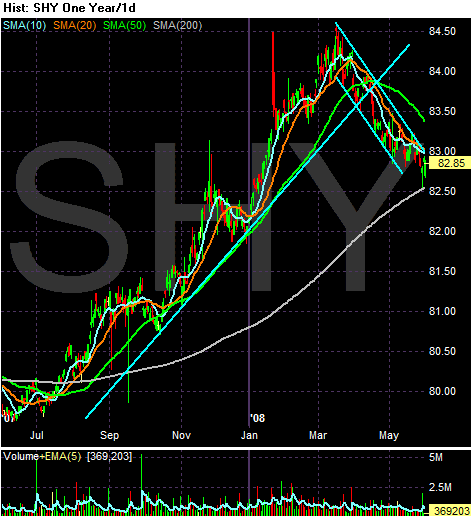
The short-end of the curve started to rally at the end of last summer. This was largely because Treasuries are seen as a safe investment. As the credit markets were melting down investors become worried about return of capital rather than return on capital. That's why they bid up the short end of the Treasury curve. But the credit markets have started to thaw a bit and people have started to move money back into the market which has dropped Treasury prices. Note the SHYs are approaching crucial support at the 200 day SMA.
Also regarding the SMAs, notice the following:
-- The shorter SMAs are below the longer SMAs
-- All the shorter SMAs are moving lower
-- Prices are below the SMAs, which will further lower the SMAs
These are bearish developments on the chart and indicate further declines.

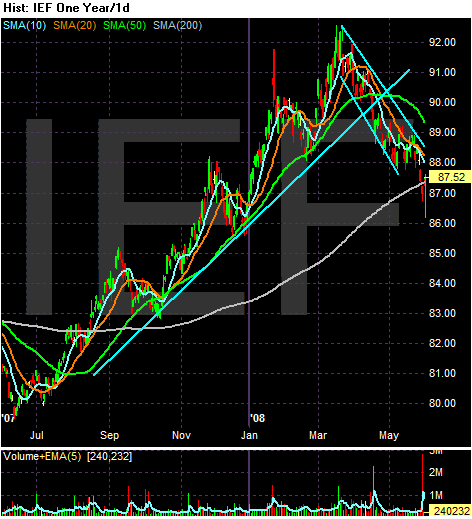
The mid-section of the Treasury curve rallied along with the short end of the curve at the end of last summer. Note the solid rally. There is a solid trend line and prices moved higher and then sold-off back to the trend line. But this section of the Treasury market has also sold off starting in early May, and has really had a downhill move as the markets have risen. This indicates money is simply moving from the Treasury market to the stock market. As with the SHYs, notice the market is right around the 200 day SMA, marking the line between bull and bear market.
-- The shorter SMAs are below the longer SMAs
-- All the shorter SMAs are moving lower
-- Prices are below the SMAs, which will further lower the SMAs
These are bearish developments on the chart and indicate further declines.

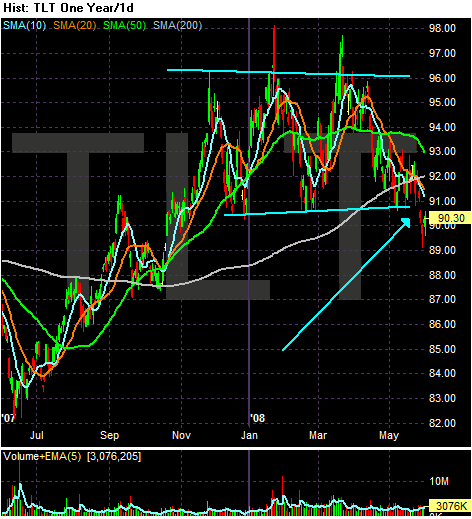
On the TLT's notice the long part of the Treasury market has been trading in a range since the end of last year. Also note it has recently broken through support of that trading range. Also note the following:
-- The 10 and 20 day SMA are both headed lower
-- The 10 and 20 day SMA just crossed below the 200 day SMA
-- The 50 day SMA just went negative
-- Prices are below the 200 day SMA (bear market territory)
-- Prices are below all the SMAs
The bottom line with all the chart is for further declines in the Treasury market.