In addition, the Fed's statement implies they are near the end of rate cutting (for more on this topic see this commentary) If the Fed is near the end of rate cutting, that means an end to lower short-term interest rates which would help the dollar.
So, let's see where the commodity/dollar trade-off stands.

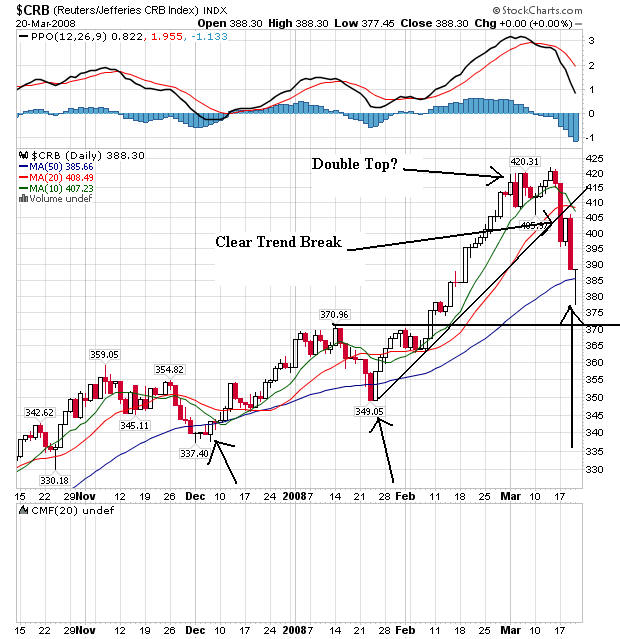
On the CRB index, notice the following:
-- The index sold off through the 10 and 20 day SMA last week.
-- Also note the index is close to the 50 day SMA which has provided technical support on two other recent occasions (see arrows)
-- The index may have formed a double top over the first few weeks of March
-- The index clear broke the short-term uptrend that started at the end of January.

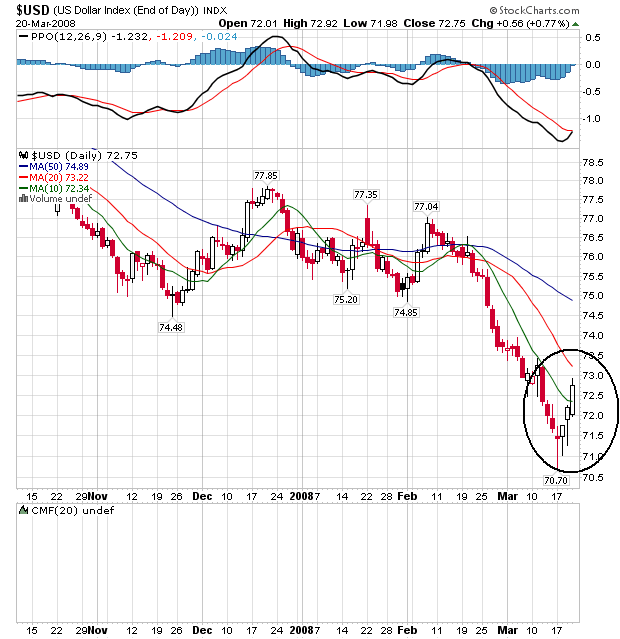
On the dollar chart, notice the following:
-- Prices moved through the 10 day SMA
-- Prices had three days of strong increases -- something prices had only one other time in 2008 (at the beginning of February).
-- Given the overall tenor of the dollar chart (which is decidedly negative) last week's rally looks more like a bear market rally than a turnaround -- at least for now.
For the dollar to see a real technical turnaround we'll need to see a whole lot more than this chart's points.