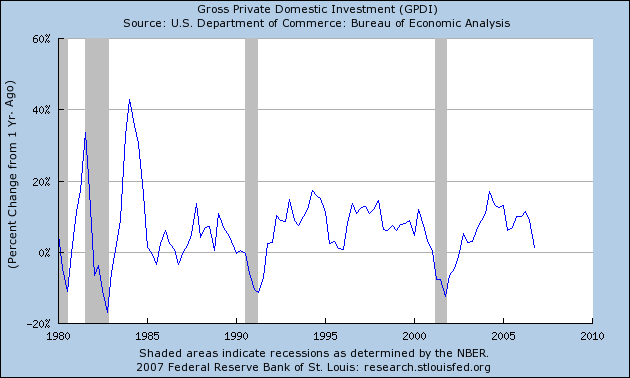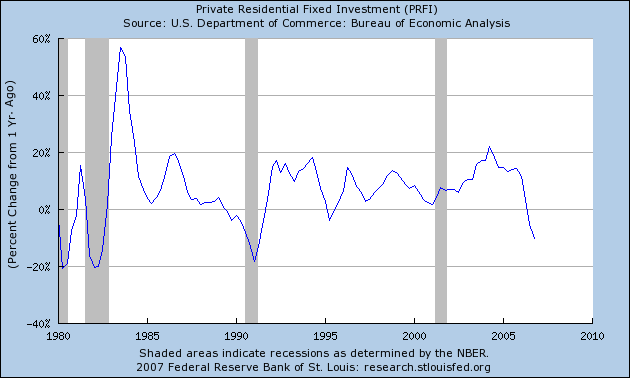
Let's break the gross number down. Once again, residential investment decreased from the preceding month, this time at a 19.2% clip. This is the third quarter in a row of declining residential investment. Below is a chart of the year over year change in residential investment. Again, this chart does not include this week's number which also would have sent the chart lower.

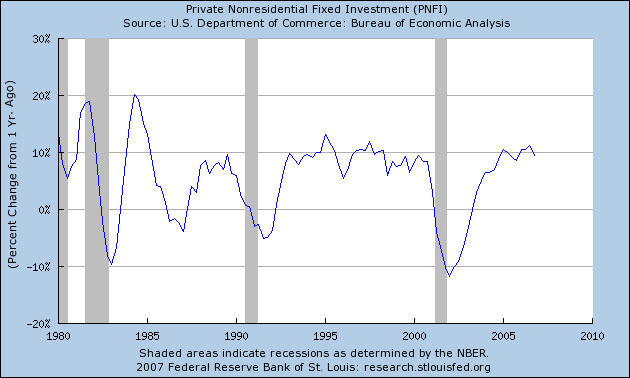
Here is a chart of non residential fixed investment. It shows a a solid year over year change. The year over year change for this figure in last week's GDP report was 7.4%. So, we are still in decent territory here.

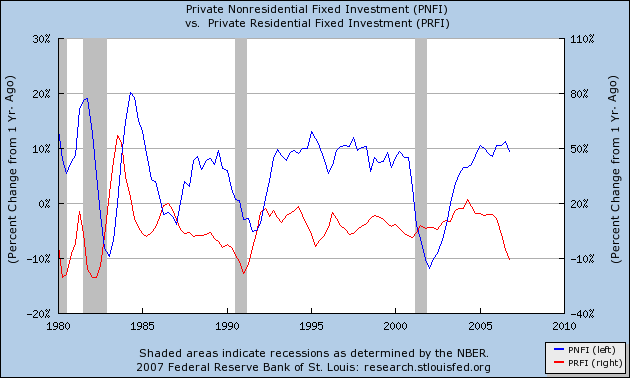
Here's a chart that shows residential versus nonresidential year over year change in investment. Notice that in the early 1980s housing investment led business investment but in the 2001 recession business investment declined without a corresponding residential decline. The 2001 situation was the result of the massive Y2K investment. In other words, it was a unique economic event.

It's important to note January's manufacturing numbers. All of the Federal Reserve districts reported lukewarm results. Chicago's PMI moved into a recessionary level. While 4th quarter industrial production increased .4%, the 4th quarter saw an overall decline. In short, manufacturing numbers were moderate at best.
This means that February's manufacturing surveys are very important, so keep your eye on them.