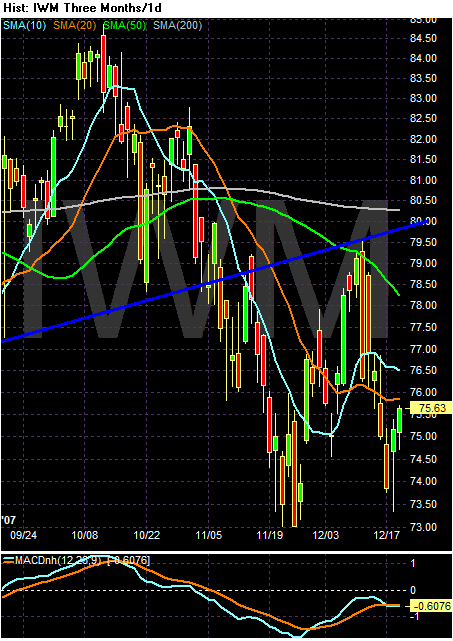
Remember, that diagonal blue line is the lower trend line of a 4 year upward sloping trend. Notice the IWMs could be forming a double bottom right now, with the first bottom occurring at the end of November and the second occurring over the last few days. In order for this pattern to be confirmed the index would have to rise about the high set in early December. But it is something to keep an eye on.
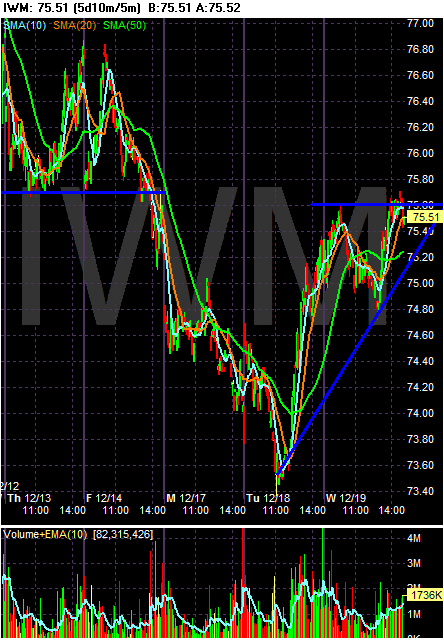
On the five day chart, notice the strong upward move of the Russell 2000. Today the index sold-off, but ended near session highs.
The developments in the IWMs are interesting because this index is by far in the most bearish situation of all the indexes.
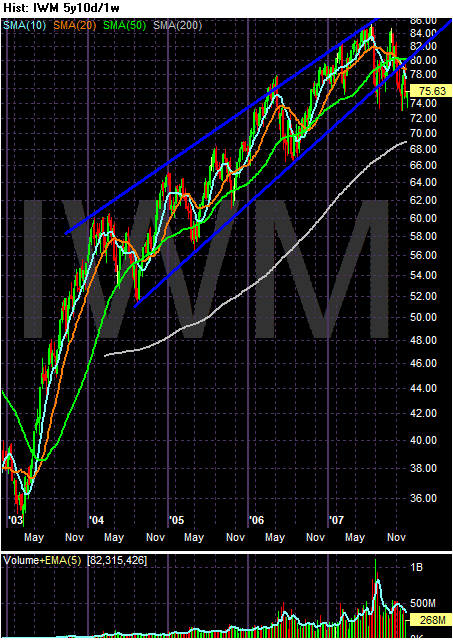
Notice the index is below the long-term trend line and has rallied into the trend line but been rebuffed on its advance.
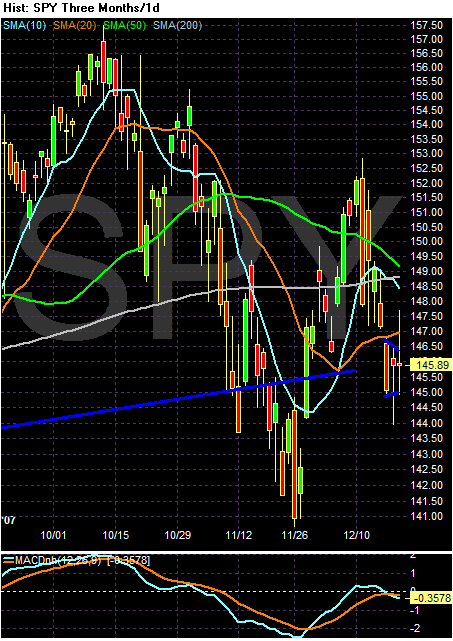
On the SPYs daily chart, notice the chart is in a small consolidation pattern. But also notice the moving averages are bunched up and sending a myriad of conflicting signals. The 50 and 10 are moving lower which the 20 and 200 are moving up.
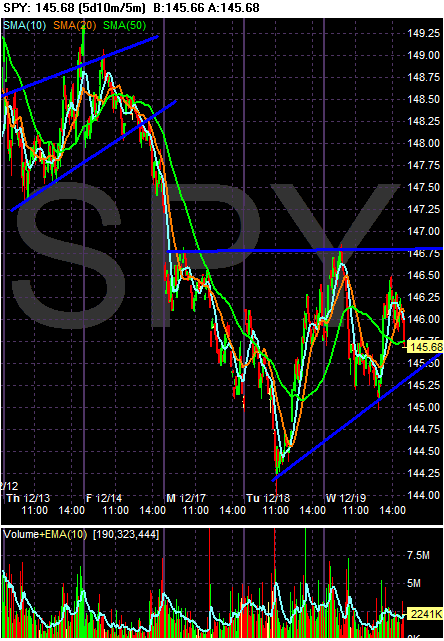
But on the five day chart, notice it's just a big damn mess.
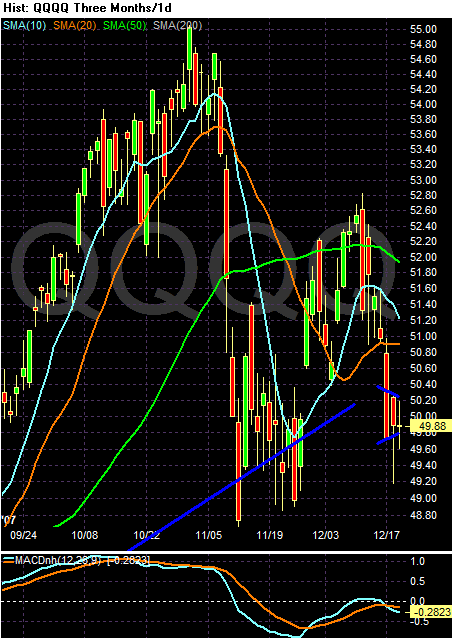
On the daily QQQQ, also notice the same technical problems as the SPYs -- moving averages sending a variety of conflicting signals. While prices are above the 200 day SMA, the 50 and 10 are moving lower and the 20 day is stagnant.
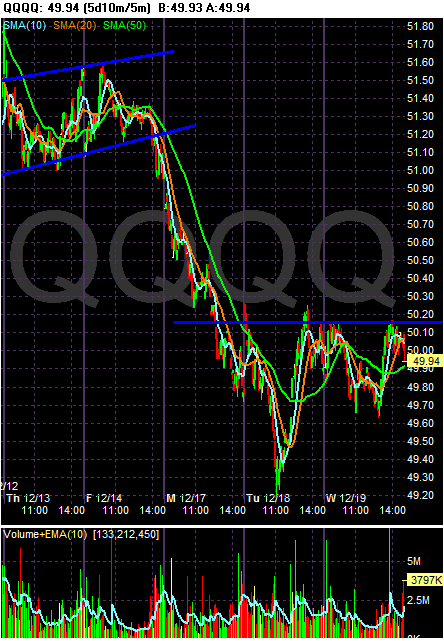
And like the SPYs, the 5 day chart is nothing more than a big mess.
Short version: the markets are searching for a direction, but not finding it. And there are a lot of reasons to think this will go on until the end of the year. The credit markets are still trying to unclog, the economy is on questionable footing and consumers are waiting for the last big sales promotion for Christmas.