I'm going to do this a bit backwards today. Here is the 5-day SPY chart in five minute increments.
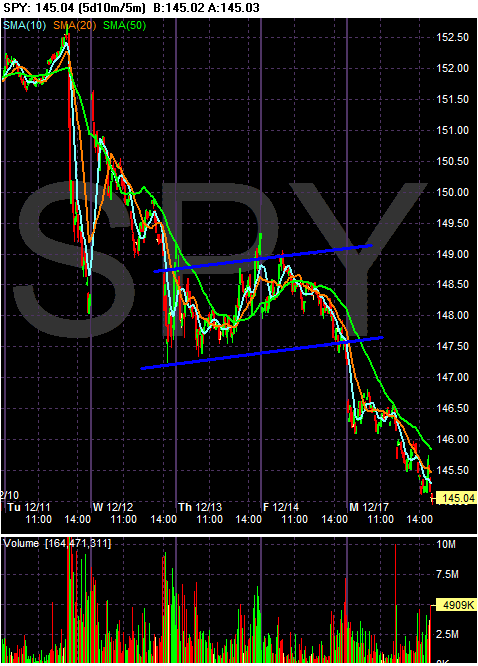
Ever since the Fed's policy announcement the market has not been happy. Notice that
1.) The market dropped immediately after the announcement.
2.) While the market popped the next day, it could not hold.
3.) The market consolidated on Thursday and Friday. However, the market sold-off at the close on Friday.
And then there is today's chart:
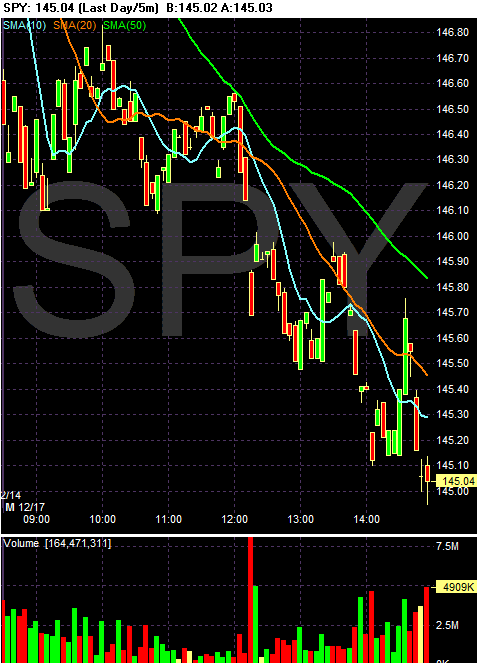
Notice the numerous gaps, and the heavy volume on several down bars. In addition, the market sold-off on heavy volume right at the close.
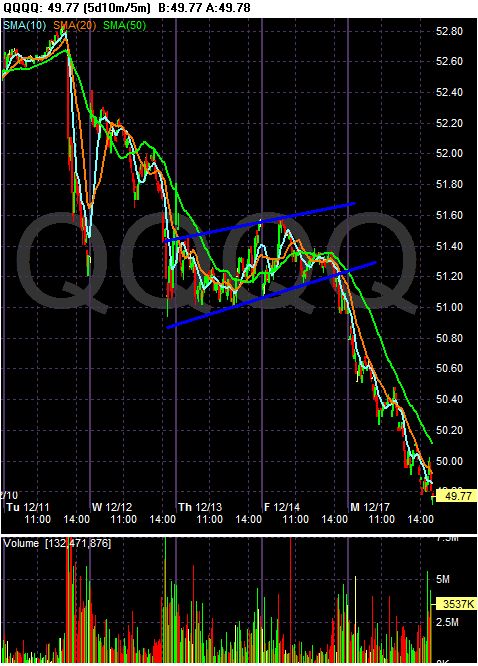
While much of the analysis for the SPYs applies to the QQQQs, notice on today's chart:
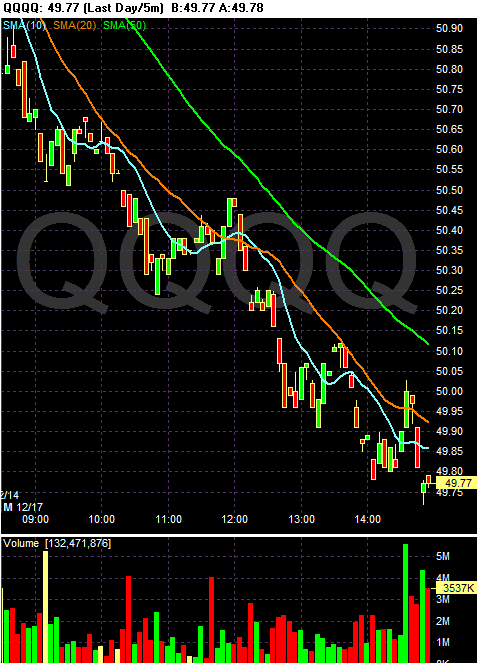
We have a solid downward trend with heavy selling at the close.
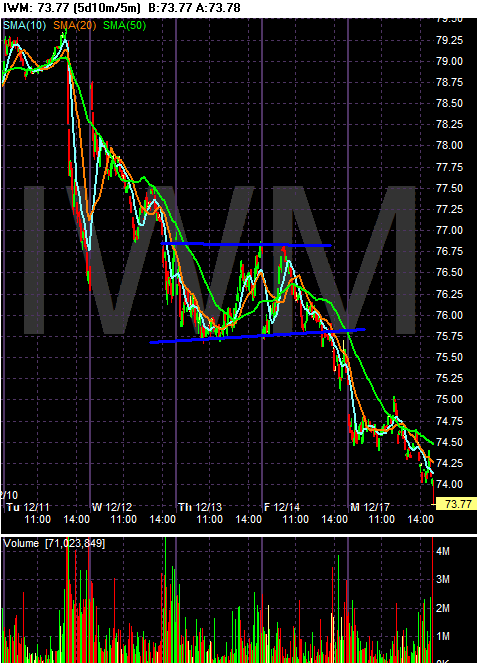
And the Russell 2000 has a lot in common on the five day chart....
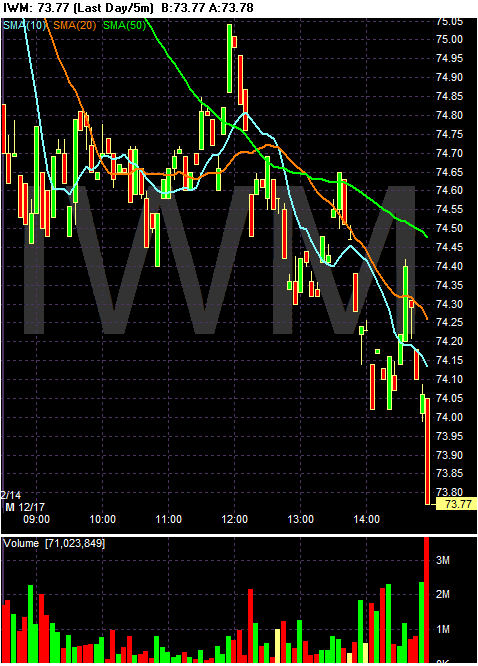
But like the SPYs, this index couldn't hold the consolidation pattern it established in the morning.
Go back to the daily charts -- the charts from today. Notice that on all three charts the bulls tried to regain control of the markets. There are places where you can find a strong upward moving bar with accompanying heavy volume. But also notice the market could not maintain this upward momentum. That's a troubling development, because it indicates the bears are developing more control over the market right now.
Let's go to the three month daily charts:
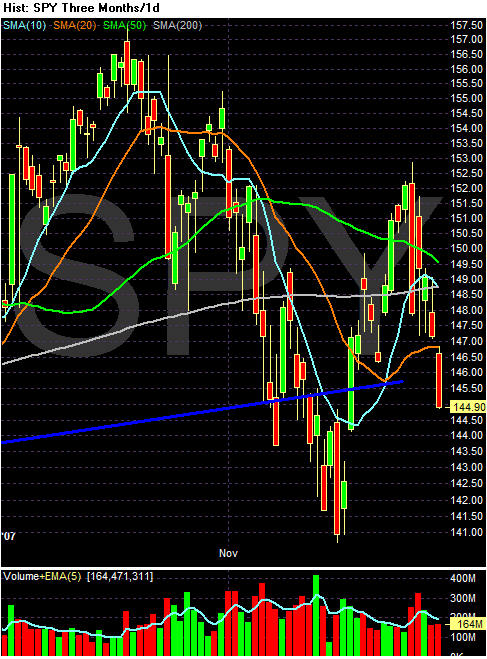
Today, prices moved through the 20 day SMA and the upper trend line of the 4-year uptrend of the average. That's not good. There is little technical support below the current price level, save previously noted price levels.
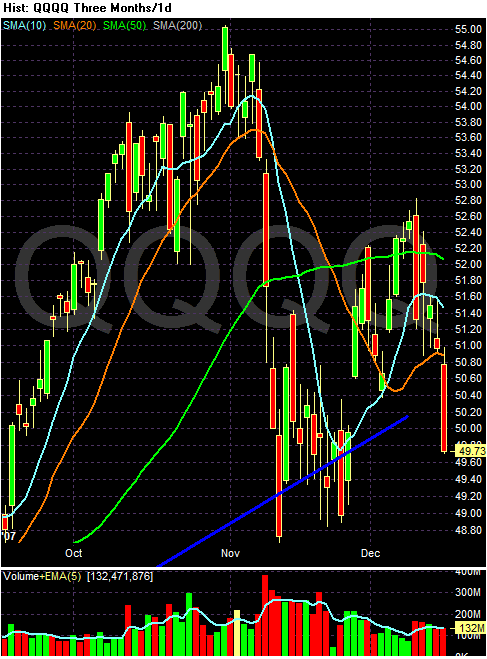
On the QQQQs we have the same situation, although today's bar is far more bearish because it is longer.
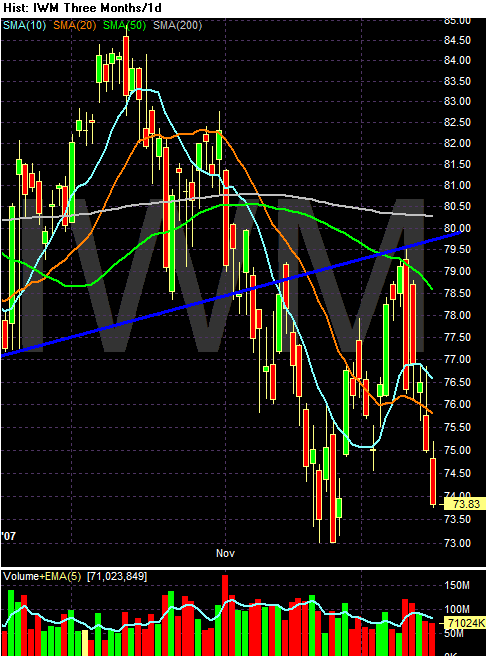
And on the IWMS, notice this is the second day prices have moved below the lowest moving average. Also notice there is only one close technical support is from the lows of late November.
About the only good thing about the daily charts is the SMAs are a mess. The SPYs and QQQQs have very conflicting signals coming from their moving averages right now. however, the IWMs are very close to a very bearish alignment with the shorted SMAs below the longer SMAs.