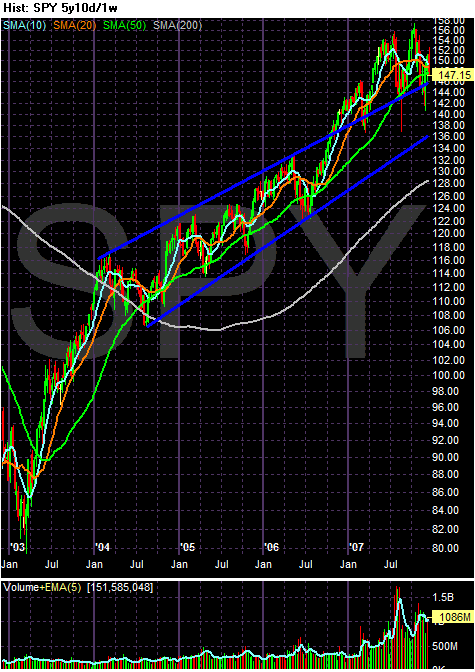
On the five year SPY chart we have a clear upward sloping channel that started in early 2004. The SPYs broke out of this channel in late 2007 and have used the upper channel line as support. What's important about this chart is the existence of two long-term trend lines that provide lower support for the average.
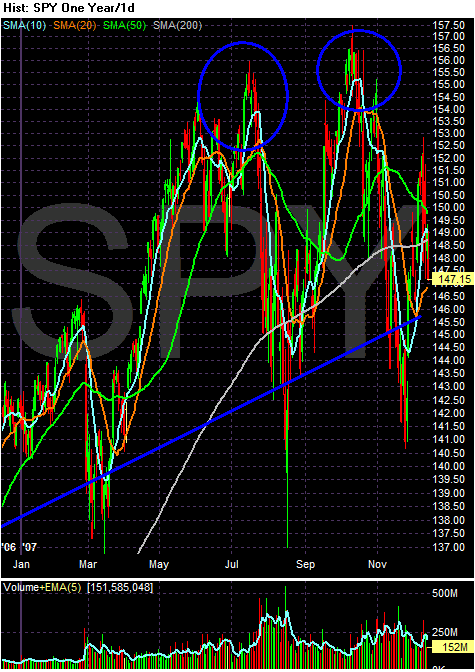
On the one year chart, we can better see how the average has used the upper channel line for support. What's important here is the possible formation of a double top. This would make sense considering the fundamental economic background. While we've seen some wild price swings over the last few months, the index has enough strength to keep from falling too far below the trend line. However, also notice that prices have stayed below the 200 day SMA for some ling periods of time.
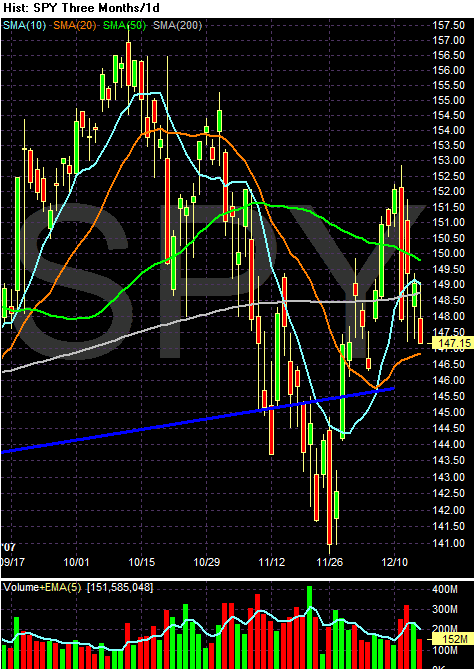
The 3-month chart gives us a better view of the moving average picture, and it is a mess. No SMA gives us any idea of a possible direction. The 50 day SMA is moving lower, the 10 is jumping around and all of the SMAs are within close proximity of each other. In short -- this index has no idea where it wants to go.
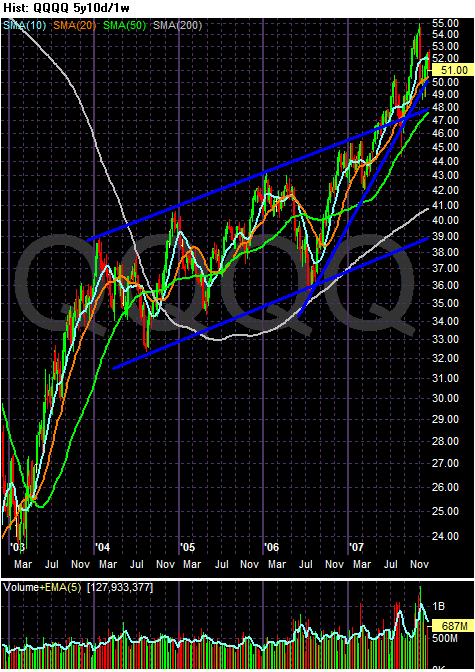
There are two trends on the 5 year QQQQ chart. The first is an upward sloping channel and the second is a rally that started in late 2006. So we have three trendlines that can provide technical support for the average.
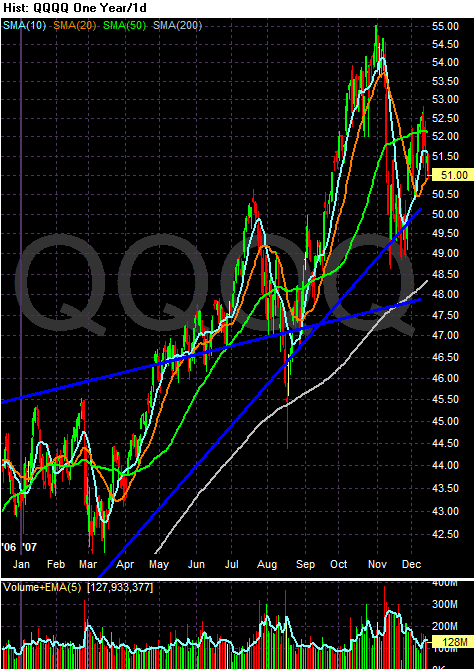
On the year-long chart, we have a weakening rally. Note that prices have not moved higher after their peak in late October. That is a troubling development because it indicates upward momentum may not be there anymore.
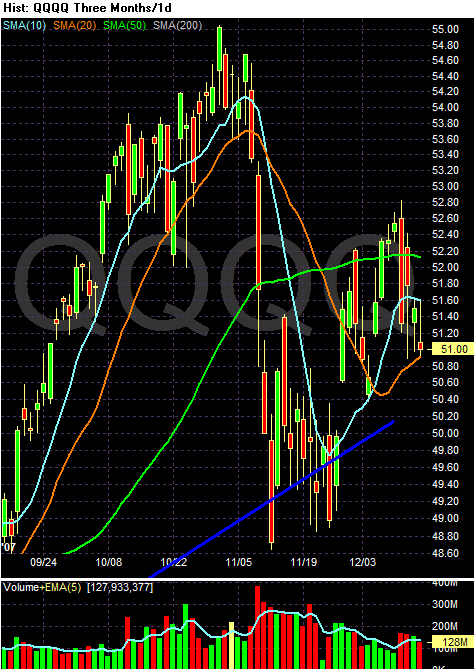
The three month chart shows the SMAs, and they are a big mess. While prices are above the 200 day SMA, the other SMAs are bunched together. The 50 is the highest which is not a good development. In short -- and like the SPYs -- this index is looking for a direction right now.
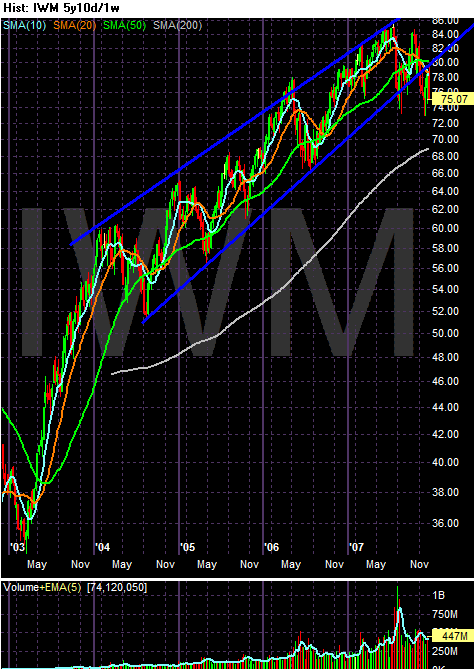
This is the chart that causes me the greatest concern. The Russell 2000 was in a good four year rally, but has fallen through support. And it gets worse.
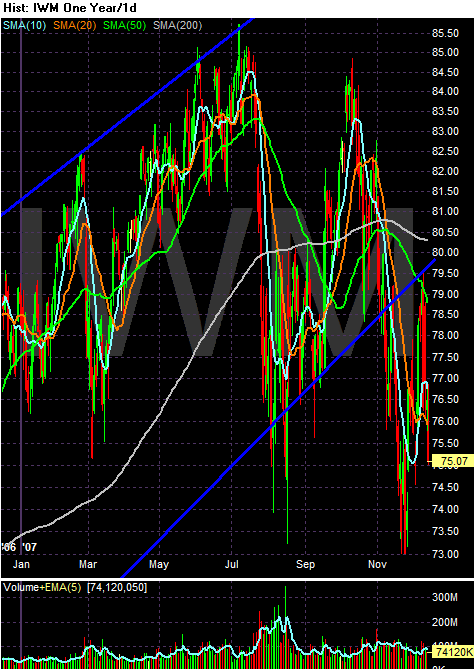
The index has bounced off the lower channel of the four year uptrend. In addition, we have a bearish lower lows and lower highs pattern developing, starting in early July.
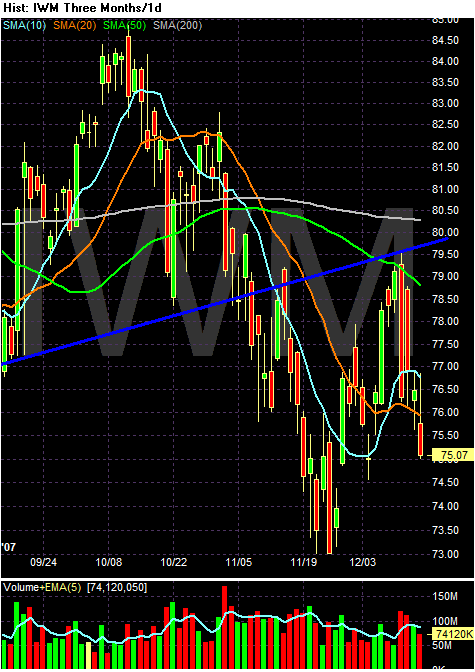
On the 3 month chart, note the average is below the 200 day SMA, the 200 day SMA is heading lower along with the 20 day SMA, the shorter SMAs are below the lonoger SMAs and prices are below all the SMAs. This is not a good chart.