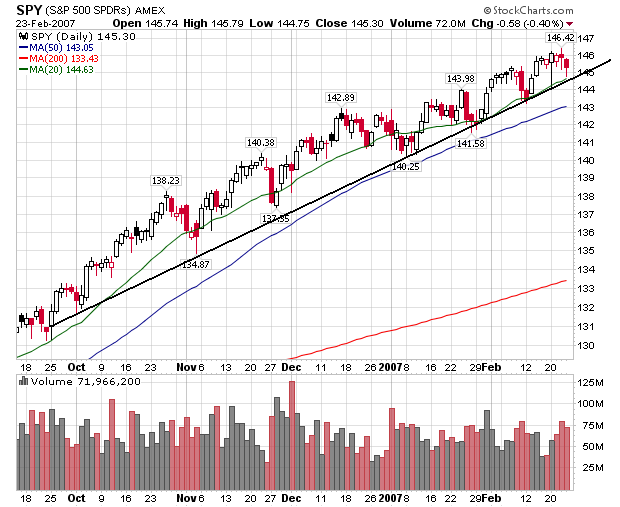
The uptrend is still firmly in place. The SPYs pretty much treaded water last week. They did well off on Friday on decent volume. This indicates there is some selling pressure in the market. But until a downtrend breaks through a level of technical support this type of selling is simply short-term profit taking.
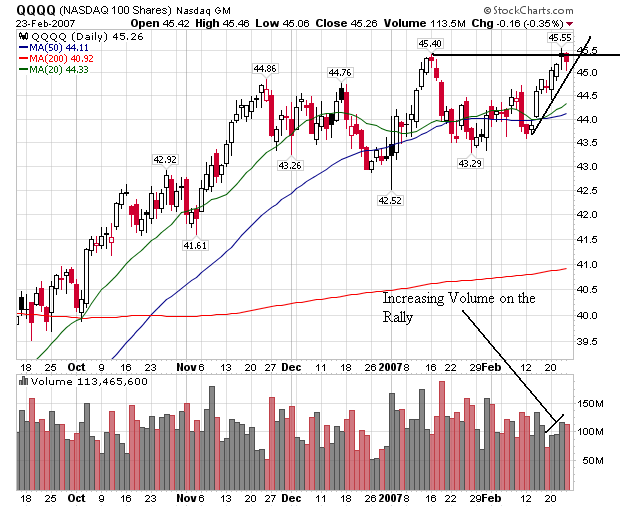
Here's a chart of the QQQQs

We did have increasing volume on the rally, but again we hit the 45.50 area and met selling pressure. While we do have a mini-rally in place, the average is a bit extended from the 20 day SMA. The last time the QQQQs did this they reverted back to the 20 day SMA. Friday's sell-off had some decent volume. This indicates the market still thinks 45.50 is a selling level.
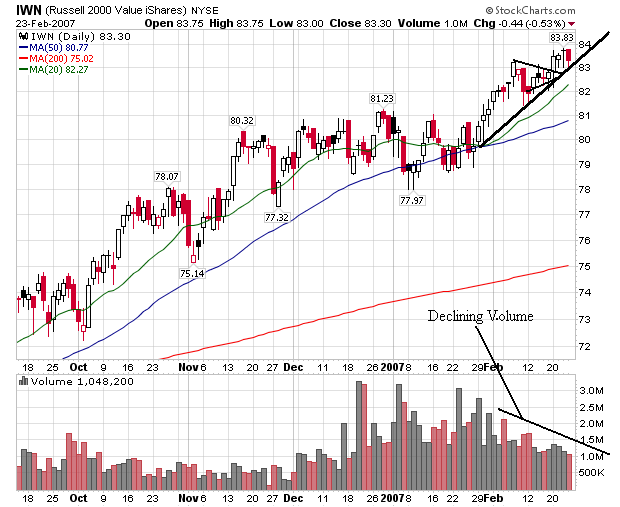
Here's a chart for the IWNs

While the market rallied starting in late January and consolidated these gains in a triangle formation in mid-February, volume has steadily headed lower. This indicates a lack of buying enthusiasm as the rally has progressed. At the same time, Friday's sell-off was on lower volume, indicating the selling isn't the most enthusiastic.