Showing posts with label Empire State. Show all posts

Friday, January 15, 2010

Empire State Up; CPI Shows Moderate Increase

From the NY Fed:

The Empire State Manufacturing Survey indicates that conditions for New York manufacturers improved for the sixth consecutive month in January. The general business conditions index climbed 11 points, to 15.9. The new orders and shipments indexes posted similar increases, and the unfilled orders index rose above zero. Both the prices paid index and the prices received index rose significantly, with the latter moving above zero for the first time in more than a year. Employment indexes advanced into positive territory. Future indexes were highly optimistic; activity and employment were widely expected to improve over the next six months. Prices, however, were expected to continue to climb in the months ahead.


Here is a chart from the report:


Over the last two months the number dropped to near 0, leading to some concern. But the numbers have rebounded indicating this region is doing well. Also note that this is the 6th straight month of positive readings; this is not a one time event but a clear trend.

From the BLS:

On a seasonally adjusted basis, the December Consumer Price Index for All Urban Consumers (CPI-U) rose 0.1 percent, the U.S. Bureau of Labor Statistics reported today. Over the last 12 months, the index increased 2.7 percent before seasonal adjustment.


There is plenty of good news in this report. First, inflation is moderate but not crushing. A little inflation is a good thing because it indicates either demand pull or cost push inflation (or most likely a combination thereof) exists. But neither demand not cost is strong enough to lead to runaway inflation. Secondly, this report indicates that the deflationary scare from 2008 is more or less over at this point. To that end, consider these charts:


Click for a larger image.

The month to month CPI numbers have shown continued increase since August and are up 7 of the last 8 months.


Click for a larger image

While the YOY number is 2.7%, remember the comparison is to a very low December 2008 level. That means the YOY numbers for the next two months will be high.

Overall, both of these numbers were very good.

Friday, April 17, 2009

New York and Philly Fed Indexes

From Econoday. Click for a larger image.


From the NY Fed:

The Empire State Manufacturing Survey indicates that conditions for New York manufacturers continued to deteriorate in April, but at a much slower pace than in recent months. The general business conditions index climbed 24 points from its March record low, to -14.7. The new orders index shot up 41 points to a reading just below zero, and the shipments index rose 25 points, also reaching a level near zero. The inventories index continued to fall, hitting a record low -36.0. The indexes for both prices paid and prices received remained negative. The index for number of employees, while negative, improved in April, but the average workweek index fell. Future indexes were much improved, with the future general business conditions, new orders, and shipments indexes rising sharply to levels not seen since September of last year. The capital spending and technology spending indexes remained below zero, although they were considerably above last month’s levels.


Let's take this in pieces:

-- Referring to the chart above, the gray line was decreasing for 7 months, albeit not continually. That means the latest news is counter-trend. Before we get excited about the change in direction, remember we need additional data to day things are definitely better.

-- The general change is encouraging; a jump of 24 points is good news.

-- In addition, the jump in new orders and shipments is also encouraging. However it's one months worth of data.

-- The continued drop in inventories is also encouraging because it indicates people are getting more and more "down to the bone" and will be forced to by simply to have a few items in stock.

Here is the summation paragpaph from the Philly Fed report. Click for a larger image


The survey has similar points as the New York Fed's Report:

-- The overall index increased. BUT as the chart at the top of this post notes we're still at low levels. The line that represents the Philly index does appear to be bottoming, but we need more data and a strong and continued move higher to say for sure. In addition, the index has been negative for 16 of the last 17 months.

-- While the new order number rose, the shipments number decreased.

-- The future expectations index has been positive for the last 4 months. However, it's easy for people to say "things will get better". It's a good sign , but take it with a grain of salt.

There are encouraging signs. BUT -- the data points supporting that statement aren't numerous. Instead they are one or a few months worth of data. So keep that in mind when reading them.

Tuesday, September 16, 2008

Manufacturing Taking A Hit

Amidst all of yesterday's turmoil two key pieces of economic data were lost. The Empire State index and Industrial Production.

Why is this information important? It's one of the four economic areas the NBER looks at when they are dating a recession:

The committee places particular emphasis on two monthly measures of activity across the entire economy: (1) personal income less transfer payments, in real terms and (2) employment. In addition, we refer to two indicators with coverage primarily of manufacturing and goods: (3) industrial production and (4) the volume of sales of the manufacturing and wholesale-retail sectors adjusted for price changes. We also look at monthly estimates of real GDP such as those prepared by Macroeconomic Advisers (see http://www.macroadvisers.com). Although these indicators are the most important measures considered by the NBER in developing its business cycle chronology, there is no fixed rule about which other measures contribute information to the process.


Let's start with the Empire State Index, which is from the NY Fed:

The Empire State Manufacturing Survey indicates that manufacturing activity in New York State weakened in September. The general business conditions index slipped 10 points, to -7.4. The new orders and shipments indexes rose modestly and were slightly above zero. Current employment indexes were negative. Current and future price indexes, though still elevated, retreated noticeably—particularly for prices paid. Indexes for future business conditions and most future activity measures remained close to last month’s levels or rose moderately in September.


Here's a chart from econoday:


This number (the gray line on the chart) has been weak for the last year. That's 8 months of sketchy reads which is not good. The only good news in this release is the current and future prices component which dropped. In conjunction with yesterday's CPI release, we're getting more and more indications inflation is becoming less of an issue.

As for industrial production:

Industrial production decreased 1.1 percent in August and was revised down in June and July to show smaller gains of 0.2 percent and 0.1 percent respectively. After little movement over the previous three months, factory output was down 1.0 percent in August, in part because of a drop of 11.9 percent in the production of motor vehicles and parts. Excluding motor vehicles and parts, the index for manufacturing decreased 0.3 percent. The output of mines declined 0.4 percent, and the output of utilities fell 3.2 percent, as temperatures in August were unseasonably mild.


Here are the relevant charts from econoday:


Note the year over year decline has been going on for the last 8 months and has been negative since the beginning of the year.

Also note that capacity utilization is still dropping, indicating the country is using less and less of its manufacturing capacity:


The bottom line is this is terrible news. Exports -- which have been an important growth component for the last year or so -- haven't been strong enough to keep these readings anywhere except stagnant. And domestic demand is obviously not strong enough to keep things humming. The capacity utilization drop indicates manufacturing is slowing shutting down what it can to remain profitable.

Friday, June 20, 2008

Manufacturing Looking Weak

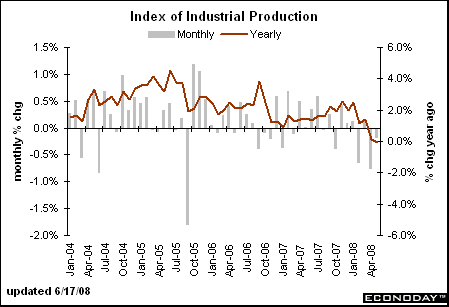
Over the last few weeks we've seen three important manufacturing reports released: industrial production from the Federal Reserve, the Empire State index from the NY Fed and the Philadelphia Index from the Philadelphia. All three point to a continued slowdown in the manufacturing sector.

First up is overall industrial production:

U.S. industrial production fell unexpectedly by 0.2 percent in May as output at utilities shrank, while capacity use slipped to the lowest level in almost three years, the Federal Reserve said on Tuesday.

Economists polled by Reuters were expecting a 0.1 percent rise in output at the nation's factories, utilities and mines after a 0.7 percent fall in April.

Manufacturing output was unchanged during the month after a 0.9 percent decrease in April. Utilities output dipped by 1.8 percent.

Overall industrial production is 0.1 percent below its year-earlier level.

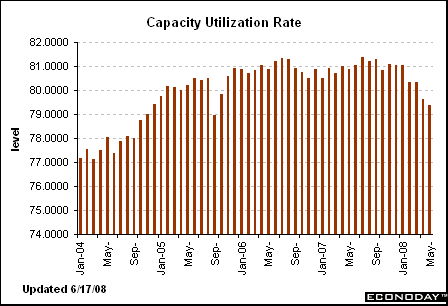
In further evidence of the slowing economy, total industry capacity use fell to 79.4 percent, the lowest since September 2005, from 79.6 percent.


The year over year chart indicates this indicator has been in a downward trend for some time. In addition, the overall report was weak with declines in a variety of sectors. In other words, there wasn't one number within the report the sent it lower; it was all the individual parts of the report sending it lower.


Also note the capacity utilization has been dropping. That means we're using less of our productive capacity to make stuff. That means manufacturing facilities are slowly cutting resources to save money. That's not a good development either.

The individual reports were not good either. From the Empire State survey:

The Empire State Manufacturing Survey indicates that manufacturing activity in New York State continued to deteriorate in June. The general business conditions index fell 5 points, to -8.7. The indexes for new orders, shipments, and unfilled orders were negative and lower than their May levels. The prices paid index remained elevated, falling only slightly below last month’s record high. The prices received index rose markedly and, at 26.7, approached a record level; the future prices received index also rose sharply, reaching a record high of 47.7. Employment indexes hovered around zero. Future indexes generally improved only slightly from the relatively low levels of the past several months, although the capital expenditures index rose several points.


This report shows a double whammy. First, overall activity is dropping right now. At the same time, prices are increasing. That places policy makers in a serious bind. To stimulate activity they need to lower interest rates (which they already have). However, to do so would increase the possibility of inflation.

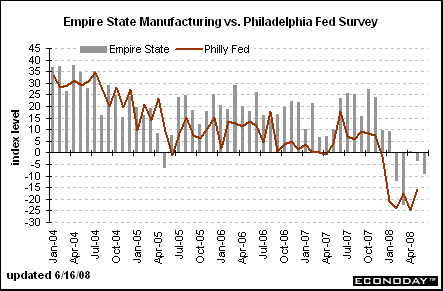
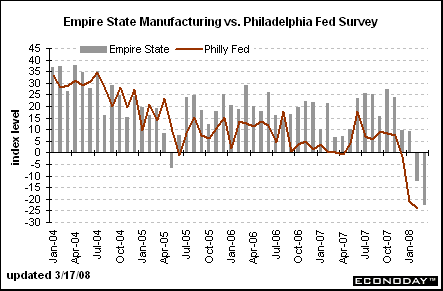
Here is a chart of the Empire and Philly indexes:


Note the Empire state number has been down 4 of the last 5 months.

The Philly report is not much better:

The region’s manufacturing sector continued to contract this month, according to firms polled for the June Business Outlook Survey. Indexes for general activity, new orders, shipments, and employment were all negative this month and registered lower readings than in May. There was an appreciable increase in the share of manufacturers reporting price pressures this month, and about one-third of the firms continued to report higher prices for their own products. The region’s manufacturing executives remained optimistic about future activity, but most future indicators fell back from their May readings.


Notice the exact some conditions as the Empire state number: declining activity and increasing price pressures. Not a good combination.

Short version: there is an overall slowdown underway right now.

Tuesday, March 18, 2008

Industrial Production and Empire State Survey Show Increasing Weakness

From the WSJ:

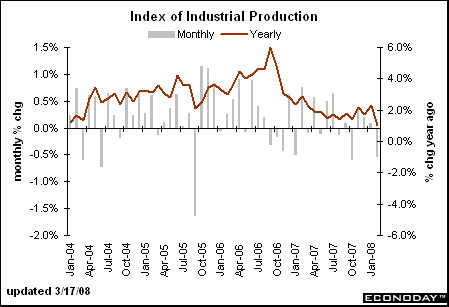
The Federal Reserve reported that industrial production fell 0.5% in February after rising 0.1% in January. "The industrial sector remains in recession," said Daniel Meckstroth, chief economist of the Manufacturers Alliance/MAPI trade group.

In a separate report, the Fed's New York district bank said its Empire State manufacturing survey stood at minus 22.23 in March, down from minus 11.72 in February. The previous low was minus 19.6, in November 2001. "New York manufacturing is rapidly slowing and the record-low measure of activity makes it clear the economy is in trouble," said Joel Naroff, president of Naroff Economic Advisors.


On the chart notice the year-over-year change in production was pretty even from about April 2007 to last month. Yesterday's figure moves the number lower in a big way. As mentioned below, one month does not a trend make.

In Fed's industrial production index is a very broad measure of production. It includes everything made or consumed in the US. Note the broad nature of the decreases:

The production of consumer goods decreased 0.6 percent in February with declines in the production of both consumer durables and consumer nondurables.

The output of business equipment edged up 0.1 percent in February, as an increase in information processing equipment outweighed decreases both in transit equipment and in industrial and other equipment.

The output of defense and space equipment declined 0.3 percent in February after having increased 1.0 percent in January.

The output of construction supplies fell 0.8 percent in February after having decreased 0.6 percent in January; the level of production in February was nearly 1 percent below its year-earlier level and 5.2 percent below its peak in 2006. The output of business supplies declined 1.1 percent in February.

The production of materials fell 0.5 percent in February after having changed little in January.


As for the New York Fed, their report was not encouraging:

The Empire State Manufacturing Survey indicates that conditions for New York manufacturers deteriorated further in March. The general business conditions index fell another 10½ points to -22.2, a reading that eclipsed the record-low of -19.6 set in November 2001. Although the new orders index rose modestly, the shipments index edged down, and both remained in negative territory. The prices paid index rose for the third consecutive month, reaching its highest level since mid-2006, but the prices received index declined. Employment indexes remained close to zero. Future indexes were generally positive and up slightly for the month, but still well below levels of late last year. However, the future employment indexes rebounded noticeably after falling steeply in February.


And here's the chart:


That's gonna leave a mark.

Monday, September 17, 2007

Empire State Drops But Still Positive

From the NY Fed:

The Empire State Manufacturing Survey indicates that conditions for New York manufacturers continued to improve in September, but at a slower pace than in the past few months. The general business conditions index fell to 14.7.

The new orders index dropped, while the shipments index declined sharply. The prices paid index, although elevated, held steady, as the prices received index rose several points. The number of employees index inched upward. Future indexes conveyed continued optimism, with the future shipments index increasing notably. The capital expenditures index fell for a second consecutive month.


This report jibes with the latest national Fed survey on industrial production:

Industrial production rose 0.2 percent in August after an increase of 0.5 percent in July. At 114.4 percent of its 2002 average, total industrial production in August was 1.7 percent above its year-earlier level. Manufacturing output fell 0.3 percent in August after five consecutive months of increases, mining output dropped 0.6 percent, but unusually hot weather contributed to an increase of 5.3 percent in the output of utilities.

....

The production of consumer goods edged up 0.1 percent in August. The production of durable consumer goods decreased 1.0 percent; the drop was due mainly to a reduction of 2.1 percent in the output of automotive products. Elsewhere, the output of home electronics declined 0.2 percent; the output of appliances, furniture, and carpeting fell 0.6 percent; but the index for miscellaneous durable goods rose 0.2 percent. The production of nondurable non-energy consumer goods fell 0.3 percent; decreases in the production of foods and tobacco, of clothing, and of paper products more than offset an increase in the production of consumer chemical products. Boosted by residential sales of electricity, the index for consumer energy goods rose 3.5 percent.

The index for business equipment fell 0.2 percent in August. The output of transit equipment declined 0.2 percent, as a reduction in motor vehicle assemblies more than offset an increase in the production of civilian aircraft. The index for industrial and other equipment decreased 0.6 percent; although farm machinery increased for the second month in a row, other machinery categories registered declines. The production of defense and space equipment fell 0.6 percent.

The index for construction supplies stayed flat in August. The index for business supplies rose 1.0 percent as a result of an increase in the commercial sales of electricity; the output of non-energy business supplies was unchanged.

The production of materials rose 0.2 percent in August. Within non-energy materials, the index for durable materials fell 0.2 percent, and the index for nondurable materials fell 0.1 percent. The decrease in durable materials reflected reduced output of motor vehicle parts as well as decreases in a variety of equipment parts. Among nondurable materials, declines in the output of textiles and of chemicals more than offset an increase in the production of paper. The output of energy materials climbed 1.5 percent.


The key to these reports is from the Fed's Industrial Production report: Manufacturing output fell 0.3 percent in August after five consecutive months of increases. In addition, the Empire State Index is still at an expansionary level. My guess is we're simply seeing a natural drop after some increases.

Remember that exports are doing very well. They increased smartly in the latest report and the dollar makes exports very competitive internationally. I wouldn't expect this number to radically drop in the near future so long as the international economic scenario remains fairly strong.

Wednesday, August 15, 2007

Empire State Survey Pretty Good; Industrial Production Up

From the NY Fed:

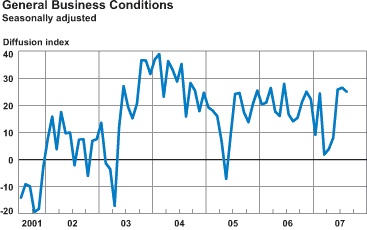
The Empire State Manufacturing Survey indicates that conditions for New York manufacturers continued to improve in August. The general business conditions index held steady at 25.1.

The new orders and shipments indexes remained at similarly high levels, while the unfilled orders index continued to hover near zero. The prices paid index also remained essentially unchanged, while the prices received index fell to its lowest level in two years. Employment indexes were positive and above their July readings. Future indexes conveyed steady optimism, although the future shipments index turned sharply lower. While positive, future price indexes fell, as did the capital spending and technology spending indexes.


Here's the accompanying chart.


From the Federal Reserve:

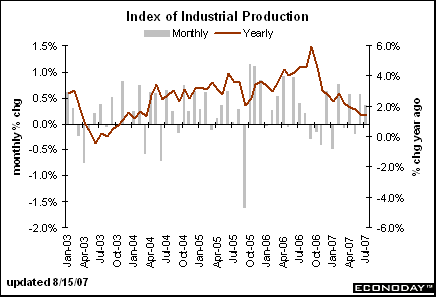
Industrial production rose 0.3 percent in July after an increase of 0.6 percent in June. At 113.9 percent of its 2002 average, total industrial production in July was 1.4 percent above its year-earlier level. In July, manufacturing output moved up 0.6 percent and mining output advanced 0.7 percent, but the output of utilities fell 2.1 percent. Capacity utilization for total industry edged up to 81.9 percent, a rate 0.5 percentage point below the level in July 2006 but 0.9 percentage point above its 1972-2006 average.

....

Manufacturing output rose 0.6 percent in July, as production of both durable and nondurable goods increased. The increase in manufacturing followed a similarly sized gain in June. The production of durable goods rose 0.9 percent in July, and gains were widespread across components. The production of nondurable goods rose 0.3 percent, after a gain of 0.4 percent in June. Substantial advances in July occurred in paper, petroleum and coal products, and chemicals. However, the output indexes for textile and product mills, apparel and leather products, and plastics and rubber products all declined. The output of the non-NAICS manufacturing industries (logging and publishing) rose 0.8 percent. The factory operating rate advanced 0.3 percentage point, to 80.7 percent, a rate about 1 percentage point above its 1972-2006 average.


However, the year-over-year change has been declining for a bit:


Both of these are welcome reports considering the overall market tenor of the last 3-4 weeks. Manufacturing continues to be a bright spot in the economy. My guess is the very low position of the dollar has a lot to do with this.

Monday, July 16, 2007

Empire State Index Shows Strength

From the NY Fed:

The Empire State Manufacturing Survey indicates that conditions for New York manufacturers continued to improve in July. The general business conditions index held near its June level, at 26.5.

The new orders index climbed for a fourth consecutive month to its highest level in more than a year, while the shipments index remained near its June level. The inventories index tumbled sharply into negative territory. The prices paid index, although elevated, eased modestly, as the prices received index held steady. Employment indexes were modestly positive. Future indexes conveyed significant optimism, with notable improvements in the outlook for employment and capital spending.


I'm a big fan of these regional Federal Reserve reports. They give us a nice regional picture of good, general business information.

This release gives us further confirmation of a strengthening manufacturing sector. However, the inventory questions could indicate a period of slowing activity in the next few months. That situation -- as with most in the economics realm -- will have to play out.

I should add that I am not a big fan of the future outlook question because it's really easy for those being polled to be really optimistic.

Thursday, April 19, 2007

Two Manufacturing Reports Show Slow Growth

I missed the NY Fed's manufacturing survey on Monday. Here's the main point of the report:

The Empire State Manufacturing Survey indicates that conditions for New York manufacturers were flat again in April. The general business conditions index edged up 2 points, to 3.8, rebounding only marginally from March.


New orders were just above 0. Shipments dropped.

Here's some bad news for the Fed. Prices paid increased while prices received dropped slightly. The prices received index has dropped for three-straight months. This may indicate producers are having to cut prices to move product. In addition, inventories have increased three straight months, indicating future production may drop to prevent more of an inventory build-up.

The Philadelphia Fed reported similar conditions:

Activity in the region’s manufacturing sector was basically unchanged again this month, according to firms polled for the Business Outlook Survey. The index for general activity was near zero, and indicators for new orders, shipments, and employment were only slightly positive, suggesting little change from March. Regarding future activity, the region’s manufacturing executives were somewhat more optimistic this month than they were in March.


The Philly area also reported similar pricing problems as the New York Area -- increasing inputs and stagnant prices received:

Area manufacturers reported higher costs for inputs again this month. The prices paid index edged three points higher and has now increased for three consecutive months. Thirty-seven percent of the firms reported higher input prices, up seven points from March; 13 percent reported lower input prices in April.

Despite increased costs, fewer firms reported higher prices for their own goods this month: 17 percent reported higher prices, down nine points from March. The prices received index fell 11 points, to 5.2, its lowest reading since August 2005.


These two reports indicate the decline in Capex spending may be hitting home with manufacturers.

In addition, manufacturers are just hanging on in positive/expansion territory.