Showing posts with label housing prices. Show all posts

Tuesday, March 6, 2012

Are home sellers being reasonable about asking prices?

- by New Deal democrat

First of all, I want to thank Bill McBride a/k/a Calculated Risk for the link noting that I've been watching YoY asking prices since last May.

The key question is whether sellers' asking prices are reasonable, i.e., are they correctly reacting to the most current conditions in the market. I think they are. Rather than appropriate Bill's work here, go back and take a look at his graph of the YoY change in asking prices for the 25th percentile (starter/working class houses, in gold) vs. Case Shiller sales prices (red). You can see that sellers dropped their prices with the market, and continued to drop them even when prices overall stabilized briefly due to the tax credit in 2008-10.

The point is, for over 4 years, house sellers "got it." In the aggregate, they didn't stubbornly hold out for unsustainable prices. They dropped their prices to make the sale. Five months ago, the top of the sellers' side stopped dropping their prices YoY. One month later, so did the median home seller. In January, the 25th percentile sellers also stopped dropping their prices, and their prices have remained firm YoY since then.

What are they seeing in the market that has caused them, in the aggregate, to stop dropping their prices, after nearly half a decade of "getting it"? I don't think they have suddenly gotten stupid or stubborn. If they have, they will shortly be dropping their prices again. If not, the Case Shiller index should be stabilizing. In that vein, please see this report from Clear Capital, reporting that
National home prices fell by the smallest margin in 10 months in light of REO saturation increases, a trend that Clear Capital calls "unusual and encouraging."

Prices declined 1.9% year-over-year, according to the firm's Home Data Index market report. Short-term prices remained stable, falling only 0.6% quarter-over-quarter, highlighting short-term stability over the last few months.
As I said a month ago, something's gotta give. We should have our answer by mid-summer.

Wednesday, February 8, 2012

Housing prices: something's gotta give

- by New Deal democrat

With Bill McBride a/k/a Calculated Risk calling for a nominal price bottom for housing in March, it appears worthwhile to update my chart of asking prices from Housing Tracker.

Back in June when I first started to publish this asking price data, I noted that:
The Housing Tracker trend in asking prices appears to run 1 to 4 months ahead of the Case-Shiller sales data,...

[T]he rate of decline [in asking prices for houses] is abating, and actual real time data shows that nominal if not inflation adjusted stability may indeed be reached as soon as early next year.
That indeed is what has happened. Median asking prices for houses turned positive YoY in December, and have remained positive since. Here is the updated chart:

Month2007 2008 2009 2010 2011 2012
January ----7.5%-11.5%-5.8%-8.7%+2.9%
February ----7.8%-12.0% -5.2%-8.4%---
March ----8.3% -10.9%-5.0%-7.3%---
April -2.7% -8.6%-9.6%-5.0%-6.8%---
May -3.5% -9.1% -8.1%-5.0%-5.6%---
June -5.0%-9.8%-7.0%-5.0%-4.4%---
July -5.4% -10.4%-6.1% -5.1%-4.2%---
August -6.0% -10.6%-5.5%-6.1%-2.8%---
September -6.2% -11.1%-5.1%-6.6%-1.7%---
October -6.7% -11.4% -4.5%-7.0%-0.9%---
November -6.6%-11.7%-4.5%-6.7%-0.7%---
December -7.2% -11.4%-5.6% -7.8%+1.1%---


Asking prices at the 75th percentile (more affluent houses) turned positive In October and by January asking prices for these were up +4.8%. Asking prices at the 25th percentile (more affordable housing, slightly below the average price of home sales according to the NAR) also finally turned YoY positive in January 2012, up a whopping +0.1%.

In contrast, Case-Shiller comparable sales prices for houses continue to fall, and in the last month, fell at an increasing rate:


It is extremely unlikely that this divergence between asking prices and sales prices is going to continue. Something's gotta give. Either asking prices will start to decline again, or sales prices will firm up.

Frankly, it is hard for me to believe that 6 years into the housing bust, sellers have suddenly become unreasonably stubborn with their asking prices. This is what doubters, like Kieth Jurow, who disagrees with CR's call, need to explain. In fact, the firming of asking prices appears to have everything to do with and be consistent with the strongly declining inventory that is also featured on the Housing Tracker site. Currently that inventory stands at 844,668 compared with 1.075 million last February and 1.560 million at its peak in October 2007. I also note that Housing Tracker data is current through last week, whereas the Case-Shiller data is only current through November.

So I still expect the sales data to confirm the Housing Tracker bottom probably by summertime. If so, please note that like Bill McBride, I expect this will only be a bottom in nominal and not real, inflation adjusted prices.

P.S.: I'll address the issue of housing affordability in another post.

Tuesday, December 6, 2011

November housing roundup

; - by New Deal democrat

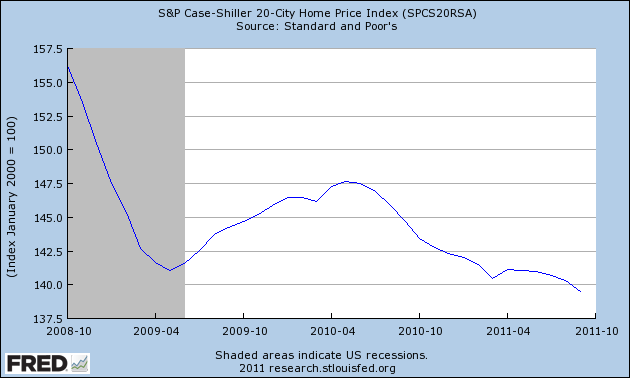
Two months ago I wrote that It's time to admit that house prices have stopped falling. November's housing price data rendered a split decision on that forecast, as asking prices from Housing Tracker confirmed a bottom, while data of repeat house sales in Case-Shiller contrarily did - finally - make a new low under their March 2011 level.

First, here is the 20 city Case Shiller index (from October 2008 to emphasize the post-crash reports, including the effects of the $8000 housing credit):


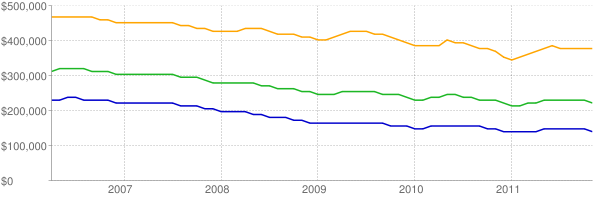
While the Case Shiller indexes report comparable sales prices, Housing Tracker reports asking prices in 54 metropolitan areas. I follow these because they showed the peak in the housing market at the beginning of 2006 before the Case Shiller sales prices did, and because since then they have led trend changes in the Case Shiller reports by about 4 to 6 months -- which makes sense, since houses are put on the market with asking prices months before they go under contract.

Comparing the Case Shiller graph above with this graph of asking prices for the 75th (yellow), 50th (green), and 25th (blue) percentiles for the last 5+ years at Housing Tracker shows that asking prices have been bottoming out for a year:


Indeed, Housing Tracker's data for all of November showed the YoY rate of declines on a monthly basis is now only -0.7% YoY. Here's the updated chart:

Month2007 2008 2009 2010 2011
January ----7.5%-11.5%-5.8%-8.7%
February ----7.8%-12.0% -5.2%-8.4%
March ----8.3% -10.9%-5.0%-7.3%
April -2.7% -8.6%-9.6%-5.0%-6.8%
May -3.5% -9.1% -8.1%-5.0%-5.6%
June -5.0%-9.8%-7.0%-5.0%-4.4%
July -5.4% -10.4%-6.1% -5.1%-4.2%
August -6.0% -10.6%-5.5%-6.1%-2.8%
September -6.2% -11.1%-5.1%-6.6%-1.7%
October -6.7% -11.4% -4.5%-7.0%-0.9%
November -6.6%-11.7%-4.5%-6.7%-0.7%
December -7.2% -11.4%-5.6% -7.8%---


Housing Tracker's weekly YoY comparisons for November are instructive: in order, they were -0.9%, -0.5%, -0.3%, and +0.1%. December will tell, but it appears that the turning point has been reached.

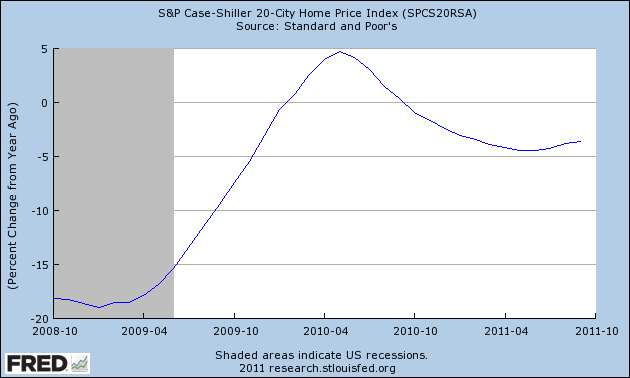
Note that the YoY% decline in asking prices bottomed in January of this year. Case Shiller data shows that the change in YoY% decline in sales prices bottomed in May and June, and has been receding since, as shown in this graph:


Keep in mind that even after a nominal bottom in housing prices, there is likely to be an extended period where they are still declining in real, inflation-adjusted terms. Prof. Shiller himself believes another 15% or more decline in real terms is likely, and I do not have any reason to disagree with that.

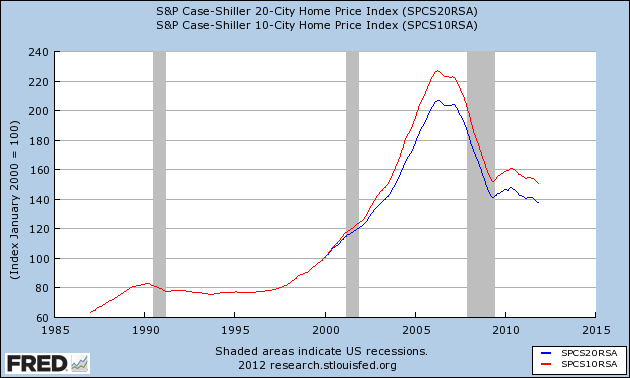
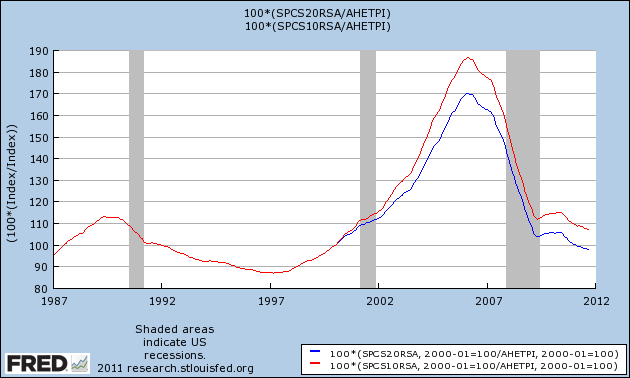
Indeed, adjusting the 10 and 20 city Case Shiller reports for average wages paid (where the beginning of the 20 city index in January 2000 = 100%), shows that in real terms, the average wage buys more house than at any point since that series began, and is only about 10% above the 10 city's average in the late 1980s and 1990s:


The discrepancy between the Case Shiller and Housing Tracker reports will get resolved one way or the other. I continue to expect Housing Tracker to be the leading series. In that regard, Bill McBride a/k/a Calculated Risk has noted that typically price inflection points are reached at about 6 months' housing supply -- more than that means declining prices ahead, less than that means rising prices ahead. As of the October housing sales reports, new home supply is at 6.3 months and has been declining at a rate of 2 months per year for the last several years. Existing home supply is at 8.0 months, and while the trend was distorted much more by the housing credit, recently inventory has been declining at a -10% YoY rate, which has also coincided with a rate of decline of 2 months' inventory per year. If those trends continue, then within a year both will be under 6.0 months and under CR's metric, we should expect housing prices to be increasing.

Wednesday, August 31, 2011

Is the bottom in housing prices staring us in the face?

- by New Deal democrat

Many if not most times you will see me cite year-over-year trends in economic data. This is because prior research has been based on YoY trends, and also because many, many data series have marked seasonality. So, for example, with rail traffic you simply can't compare wintertime post-Christmas carloads with late summer or autumn carloads. Similar issues exist for tax withholding and for state tax receipts. Thus the only valid way to see a trend is YoY.

But where there is no seasonality, or where the data has already been seasonally adjusted, YoY comparisons lag turning points. For example, weekly initial jobless claims are seasonally adjusted by the BLS. Waiting for a YoY change there in 2009 would have completely missed the turning point. YoY initial claims did not turn positive (i.e, lower) until November 19, 2009, even though the bottom was made on the week of March 28, 2009.

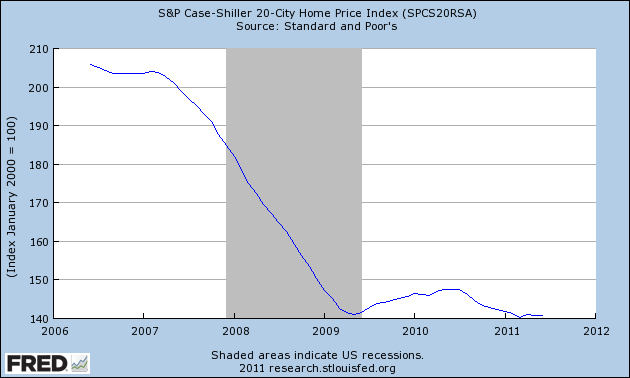
Which brings us to housing prices. Note: I'm discussing nominal prices here, not "real" inflation adjusted prices. Yesterday the Case-Shiller housing indices for June were released. Here's a graph of the Case-Shiller 20 city index for the last five years:


The Case-Shiller data in the graph above IS seasonally adjusted. So we don't have to wait for YoY changes to make valid statements about the data. Well, here is the data for the 20 city index shown above for the last 6 months:

2011-01-01 141.75
2011-02-01 141.31
2011-03-01 140.30
2011-04-01 140.94
2011-05-01 140.84
2011-06-01 140.76

As I pointed out yesterday, the variation in the index over the last 6 months is less than 1%, and on a seasonally adjusted basis we have not made a new low in 3 months. In fact we are less than 1% below where this index stood in mid- 2009 (before most of the $8000 housing credit distortions kicked in).

Yes, it's only nominal and not "real," and by no means is it clear that March will prove to have been the absolute bottom, but even if there is some further deterioration, we are probably near the bottom in nominal (not "real") housing prices. In fact the bottom in housing prices may be staring us right in the face.

----------
P.S.: It may be tempting to think that the overhang of foreclosures will drive house prices further down. But consider that the same overhang existed in January. It existed in February. It existed in March. And April, May, and June, too -- but it did not drive prices down in those six months. Is anything different about the foreclosure overhang now than during the last half year?