- by New Deal democrat
This morning’s JOLTS report for July was in general surprisingly positive on a monthly basis, but continued to show a slowing trend.
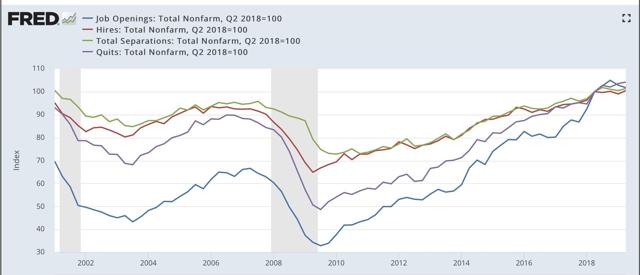
To review, because this series is only 20 years old, we only have one full business cycle to compare. During the 2000s expansion:
- Hires peaked first, from December 2004 through September 2005
- Quits peaked next, in September 2005
- Layoffs and Discharges peaked next, from October 2005 through September 2006
- Openings peaked last, in April 2007
as shown in the below graph (quarterly, normed to 100 as of May 2018):

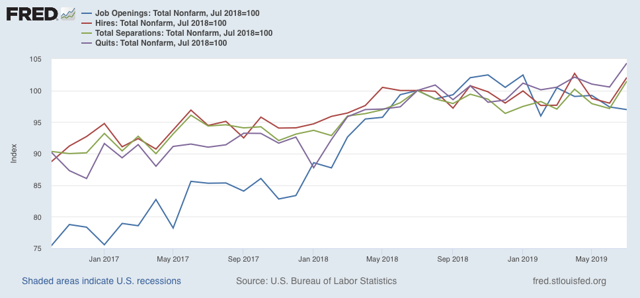
Here is the close-up on the past three years (monthly):

In today’s report, all of the above series improved month over month. But the only series that is meaningfully higher than it was one year ago, was voluntary quits.
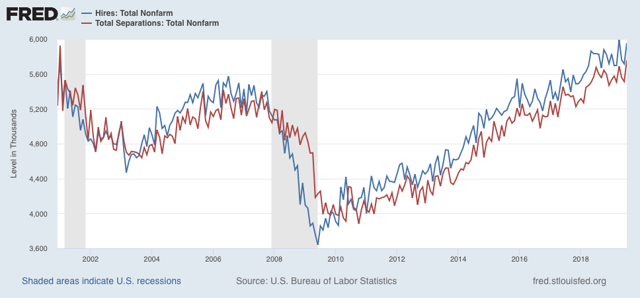
Next, here is the history of the “hiring leads firing” (actually, total separations) metric:

As Is again apparent, both hires and fires have essentially gone sideways for the last twelve months. It is possible both are at a turning point, but it is impossible to know.
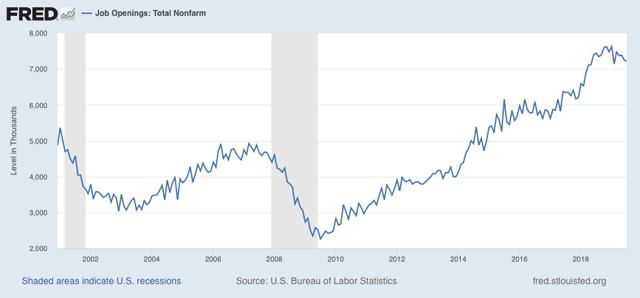
Finally, although I normally don’t bother with the “jobs openings” series because I consider it soft and unreliable data, it is the one series that declined in July, and it is the only series that is negative YoY:

Since it was the last series to turn south before the 2007 recession, this is noteworthy, although — again, because the JOLTS metrics are less than 20 years old — it is impossible to know what if anything at all this may portend.

Since it was the last series to turn south before the 2007 recession, this is noteworthy, although — again, because the JOLTS metrics are less than 20 years old — it is impossible to know what if anything at all this may portend.
In summary, while almost all the monthly changes were positive, this month’s report does little to show an improving jobs market. The main takeway is deceleration just barely above neutral levels.