Yesterday's strong ISM manufacturing report got me wondering if there was any correlation between that report and the employment report. Specifically, how often has expansion in manufacturing nevertheless been accompanied by a decline in employment? So I dug through the data, and I give you the following graphs. It seems to me that there is a very, well, graphic, correlation, but you be the judge.
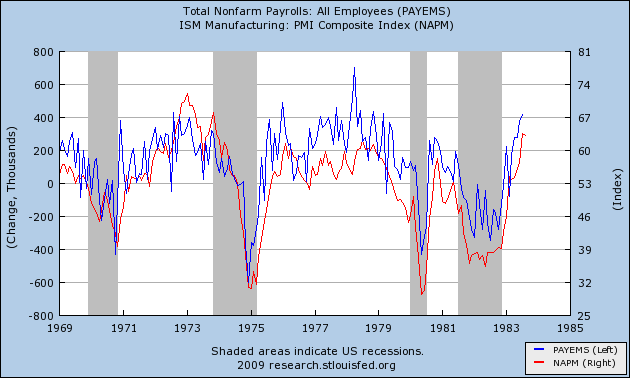
The first covers the years 1969-1983, including 4 recessions and recoveries:

Data confirms that in these traditional recoveries, an ISM manufacturing reading above 50 correlated with actual job expansion.
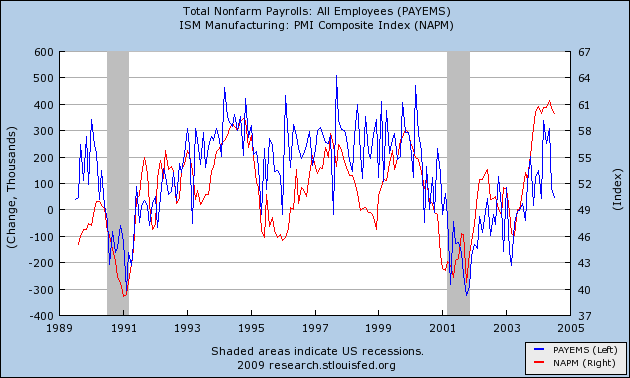
Next, let's look at the graph for 1989-2004. This includes our two previous "jobless" recoveries:

Once again, the correlation is striking, but this time, there were some weakly positive ISM readings that nevertheless were accompaied by negative jobs reports.
Let's look at that in a little more detail. The 1991 recession ended in March, but employment hit it's nadir in May. Unemployment didn't peak until June 1992.
The ISM manufacturing index first turned positive in June 1991. During the period betwen June 1991 and the June 1992 peak, ISM readings above 50 meant positive jobs data with two exceptions:
1991-07-01 50.6 (-47,000)
1992-02-01 52.7 (-66,000)
There was also an outlier in March 1993:
1993-03-01 53.5 (-51,000)
Aside from that, a positive ISM reading correlated perfectly with positive jobs data.
Now let's look at the 2001 recession. Despite ending in November 2001, unemployment did not peak until June 1993, and employment continued to decline until August 1993.
The ISM manufacturing index first turned positive in February 2002. During the period betwen then and August 2003, the ISM index vacillated between expansion and contraction. In descending order, from strongest to weakest expansionary ISM numbers, here are the jobs reports:
2002-06-01 53.6 +45,000
2003-08-01 53.2 ( -42,000)
2002-05-01 53.1 ( -7,000)
2002-03-01 52.4 ( -22,000)
2002-04-01 52.4 ( -85,000)
2002-12-01 51.6 (-156,000)
2003-01-01 51.3 +83,000
2003-07-01 51.0 +25,000
2002-02-01 50.7 (-147,000)
2002-09-01 50.5 ( -55,000)
2002-08-01 50.3 ( -16,000)
2002-07-01 50.2 ( -97,000)
Compare with the August 2009 ISM reading of 52.9. The very worst jobs number in either of the two prior "jobless recoveries" where the contemporary ISM report exceeded 52.0 was ( -85,000). The worst for any reading above 50.0 was ( -156.000).
At no time has there been a reading of 54.0 or above on the ISM manufacturing index during a "jobless recovery." All such readings have coincided with jobs growth and unemployment rate declines.
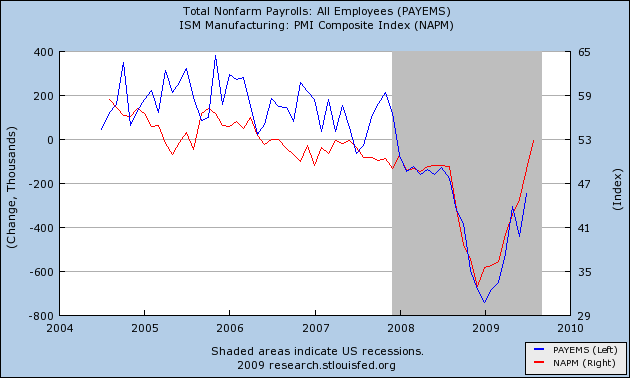
Finally, let's look at the recent "Great Recession" and the present incipient recovery:

Once again, there appears to be a very strong correlation between the two reports.
Needless to say, I haven't had the time to dig through all of the data in depth. It certainly could be that there is an ongoing secular change which means that ISM readings must be even more positive than in either 1992 or 2002 to generate positive jobs data. It could also be that strength will turn up first in aggregate hours worked, average workweek, and overtime, before it turns up in the jobs number itself.
But laying that aside for now, if this recovery's data is in accord with the past two "jobless recoveries" in terms of the correlation between the two data series, then Friday's jobs report could be a surprisingly "strong" (0) to (-150,000), which is why I wanted to put the graphs and data up for you now.