Renewed banking trouble Monday sent investors scrambling to buy low-risk government debt, with shorter-dated maturities making the biggest gains.
The two-year note rose 8/32 point, or $2.50 for every $1,000 invested, to yield 2.512%. That is down from 2.641% Friday as bond yields fall when prices rise. The yield on the benchmark 10-year note fell below the 4.0% mark again -- a level just breached last week. It was yielding 3.971% Monday.
The advances helped government debt gain back some ground after suffering a rout in the past few weeks amid rising inflation worries, speculation over higher interest rates and a recovery in risk appetite.
But risk aversion returned Monday after British mortgage lender Bradford & Bingley warned about the outlook for 2008, and two major U.S. banks, Wachovia Corp. and Washington Mutual Inc. made management changes. That reminded investors that the credit-market crunch, while improved from the worst levels in March, is far from over.
Standard & Poor's downgrades of the counterparty ratings on three major U.S. brokers added to investors' worries, as the ratings firm said it expects Merrill Lynch & Co., Lehman Brothers Holdings Inc. and Morgan Stanley to make additional writedowns.
"You are seeing a flight-to-quality bid into Treasurys again," said Gary Pollack, who helps oversee $12 billion as head of fixed-income trading at Deutsche Bank AG's private wealth-management unit in New York. "The credit market crisis isn't over. This is just a reminder of that. The market is repricing risk."
and inflationary pressures.
Crude oil spiked to new records around $139 per barrel, deepening a stock market sell-off and driving flows out of riskier assets into safe-haven Treasuries. However, a sustained acceleration of inflation pressures even in a period of weak economic growth could later prove negative for bonds, analysts warned.
However, looking at the charts you could argue that inflation fears are starting to win, with the flight to safety trade happening as events warrant.
Also remember that last week we saw Bernanke and Paulson jawboning the dollar. This implies that interest rates might be rising. And then there was this from Bernanke yesterday:
Federal Reserve Chairman Ben S. Bernanke said policy makers will ``strongly resist'' any surge in inflation expectations, delivering his clearest message yet the central bank is done lowering interest rates.
Bernanke played down the biggest jump in the unemployment rate in 22 years in May and said the risk of a ``substantial downturn'' receded in the past month. Policy makers will need to pay ``close attention'' to make sure the increase in commodity costs doesn't pass through to broader consumer prices, he said in a speech to a Boston Fed conference late yesterday.
The Fed chief's remarks spurred investors to bet that officials will raise rates later this year and sent two-year note yields to their highest level since January. Bernanke and his colleagues are raising the alarm on inflation after oil costs doubled in the past year and companies from Dow Chemical Co. to tire-maker Titan International Inc. raised prices.
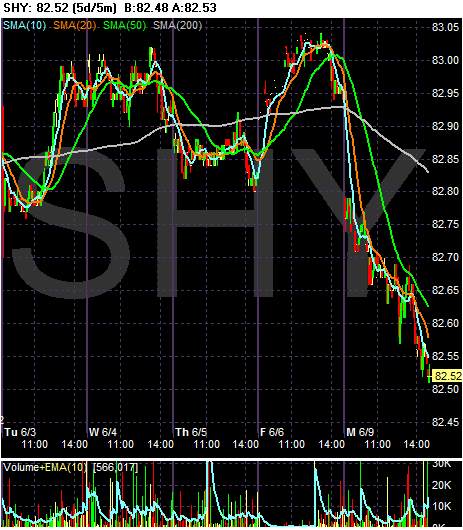
The short end of the Treasury market bounced between a narrow set of points from Tuesday of last week to Friday. However, the short end sold off yesterday.
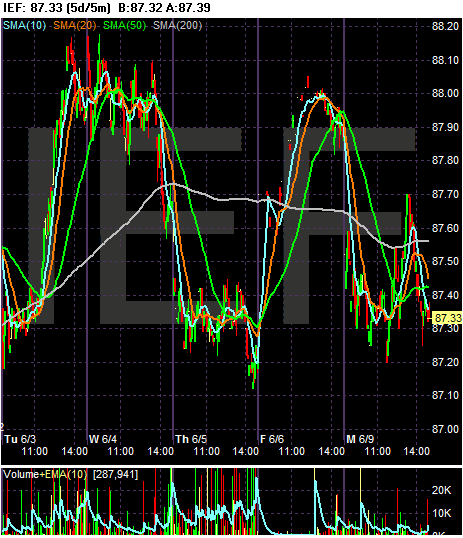
The 7-10 year part of the curve is caught between two points. This a trading range which indicates traders are still caught between several conflicting interpretations of the markets.
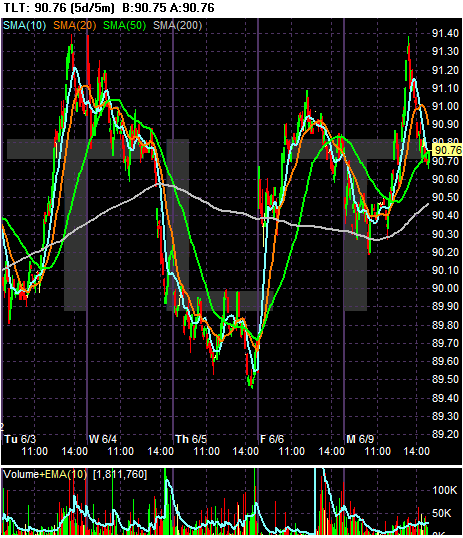
And the 20+ year area of the market is still moving between interpretations as well.
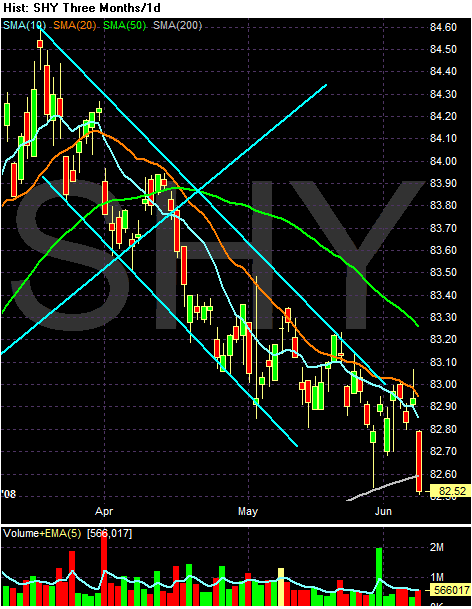
Looking at the short end's daily chart, we see the following:
-- Prices have been in a downtrend since a little after the beginning of the year. This is a sell-off that came at the end of the fight to safety from last year.
-- Prices have just moved below the 200 day SMA
-- Prices are below all the shorter SMAs
-- All the shorter SMAs are moving lower
-- The shorter SMAs are below the longer SMAs
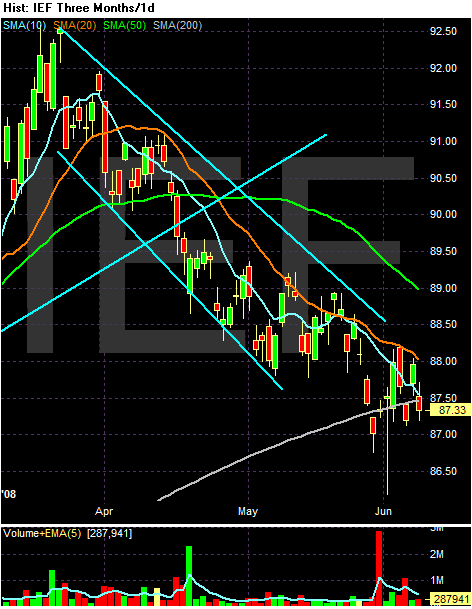
On the 7-10 year chart, notice the following:
-- Prices are bouncing around the 200 day SMA, but haven't made a firm move either above or below.
-- Prices are below all the shorter SMAs
-- All the shorter SMAs are moving lower
-- The shorter SMAs are below the longer SMAs
-- Prices have been in a confirmed downtrend since the beginning of the year
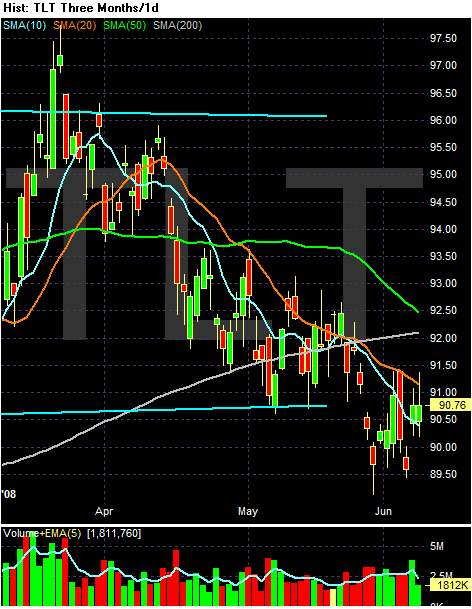
In the 20+ year market, notice the following:
-- Prices have moved below the 200 day SMA
-- Prices are below all the shorter SMAs
-- All the shorter SMAs are moving lower
-- The shorter SMAs are below the longer SMAs
-- Prices have been in a confirmed downtrend since the beginning of the year
The yearly charts show we are at/near a crossroads.
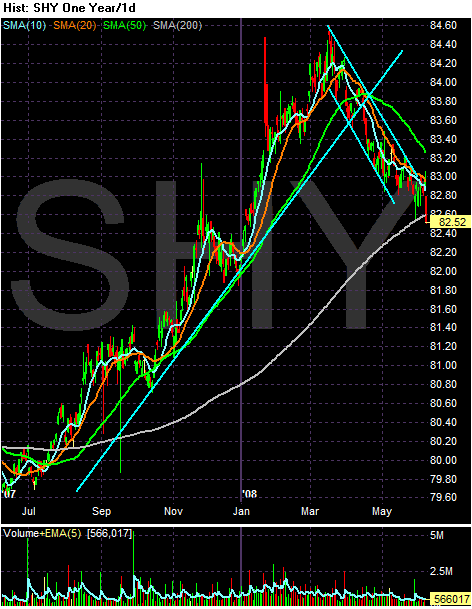
The short end of the curve has been declining for awhile and prices are right at the 200 day SMAs.
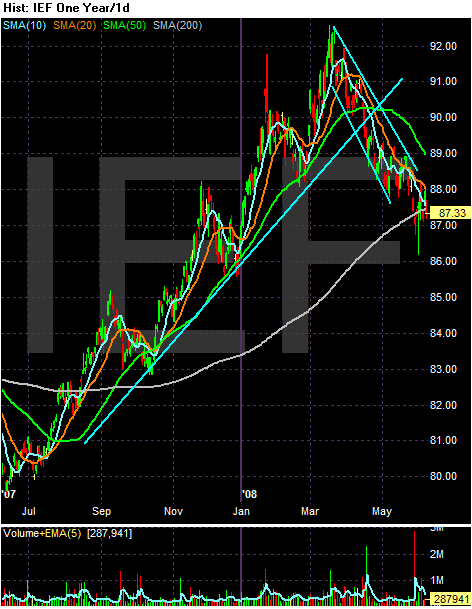
The IEFs (7-10 year) have also been declining since the beginning of the year and have been bouncing around the 200 day SMA
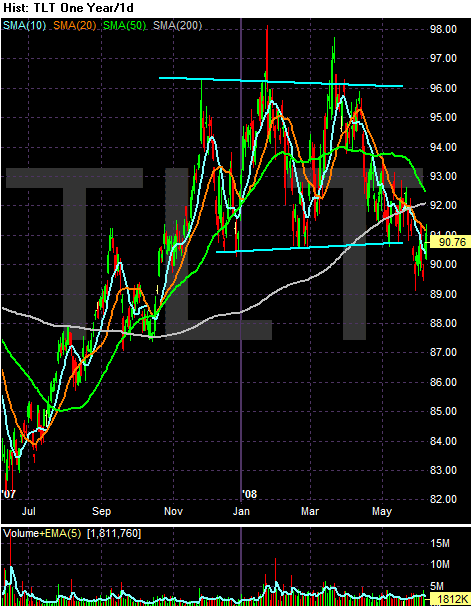
The TLTs have broken their trading range -- which they had been in since late last year -- and are firmly moving lower.